Moving Averages are very versatile in ways how you can interpret them for signals. Whatsmore, adding more than one creates a plethora of ideas as many patterns and shapes emerge in conjunction with the chart. Therefore, traders can make complete systems out of these indicators and all of them are unique in their way.
Some MAs are used more often, such as 100-period MA, 20-period Exponential MA, or 9-period EMA, still, signal interpretations are subjective and MAs are used with other indicators and analysis. This article will address how one professional prop trader uses MAs as an element in their trading system and it should give you an idea of what other uses MAs have aside from traditional trading signal generation. We will present opinions that should not be considered as a fact or trading advice, just as an example of how it is used for technical trend-following systems.
A trader who wants to have a robust and universal system looks to implement measurements of different factor types on the market, covering areas of importance on their trades. According to one such system structure example used by professionals, MA is one element of 6 others. Other elements or tools focus on volume indicators, two trend confirmation indicators, a trade exit indicator, flat markets filter, and volatility measurement for risk management purposes (ATR indicator). Moving Average can double as an Exit indicator when the price cross-closes it but for our example, it is used as a higher probability direction filter. We will go more into this function later, let’s first address the use of the MA as a Trailing Stop.
Trailing Stops
Trailing Stop can be regarded as a trade Exit function with adaptive movement to the price, it will follow the price in real-time and automatically move the level at which a position will be closed if that price level is hit. Most trading platforms or clients like the MT4 have this implemented. Although, Trailing Stops can be calculated based on the moving averages rather than just using the points distance trailing which is a basic Trailing Stop calculation. Now, as there are many types of MAs it means Trailing Stops can also be customized in various ways.
Such tools exist for MT4 and MT5, most of them are a form of Expert Advisor script that expands the way you can use real-time trailing stops for your exits, and more often than not it is more effective than the standard, distance-based trailing stop. Of course, you do not have to use such tools if you do not need real-time custom trailing stops, instead you can just add MA of your choice to your chart and move the Stop Loss order level to it. This is very easy to do if you are on the daily timeframe but gets very demanding if your target timeframe is below M30, especially once you have multiple positions to trail.
The way we can trail on the daily chart is simple. Once our Take Profit target is hit, we move the Stop Loss to the moving average of choice. Or, we can just wait for the price to cross the MA and close the order manually. There are differences here, the first way is more aggressive because if the currency pair becomes more volatile it is likely your stop loss level will be triggered even though the close price has not crossed the MA. So the second method will not “accidentally” close the position prematurely because of the volatility increase, still, it leaves room for flash crashes or other sudden moves to negate gains we might have got from the trend.
In this case, MA has a trade exit function, while trailing the MA with the stop loss order will ensure our profits from the trend. You should pay attention to the MA period settings and set to single-digit numbers as this is what prop traders recommend for the daily chart systems. Trailing stop or exit function MA should not follow the price to the point it is almost the same, the moving average should average the price value and absorb price volatility to some degree but not lag too much.
MA Lagging
Talking about the MA lag, it leads us to mention why some technical prop traders are not fans of MA crossovers. You probably know that MA crossovers are very common signal generators unless you are just starting to trade. Moving Averages absorb volatility so we have a cleaner insight where the trend is emerging, ending, stalling, and so on. When we use MA crossover as trend confirmation indicators, the signal they generate is not optimal. It either lags or if we set low periods – fake signals are overwhelming. No matter what type of MA you use, they seem to always be late to the party. Using popular MAs mentioned above, you may have heard about the Golden Cross and the Death Cross.
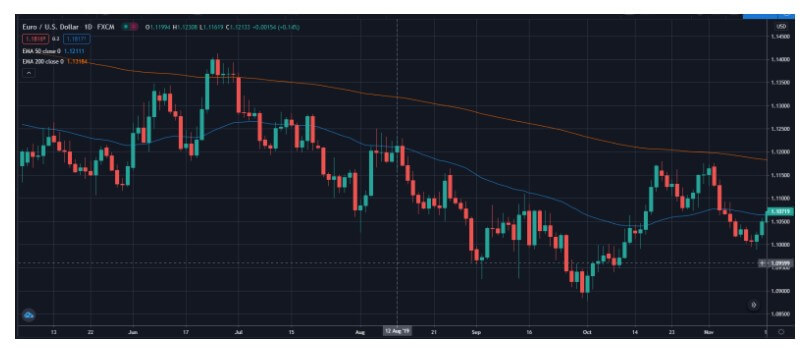
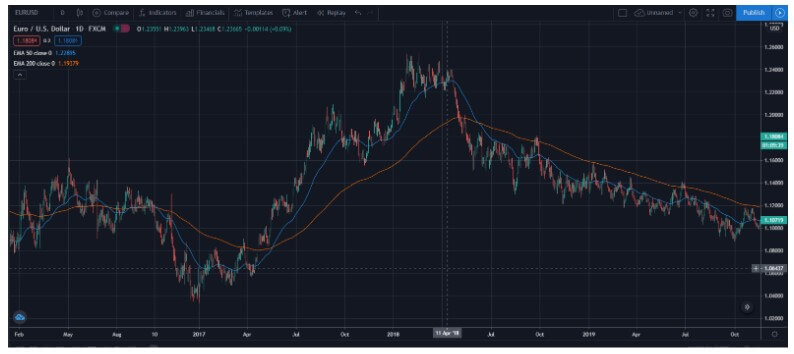
It is obvious from the picture above that these MAs do not cross often on the daily chart our system is using. Golden Cross is a signal when the 50 EMA crosses the 200 EMA and Death Cross is the opposite, short trade signal. These are used often in stocks trading, creating a kind of uniform traders’ behavior once the crossovers happen, putting more pressure on the price momentum. This phenomenon is waited for by investor traders and the strategy has some success because of this coordinated move to dump or hype a stock. Unfortunately, forex is not a good market for these strategies. You may notice trends once the crosses happen but it is not related to the trader sentiment. Whatsmore, the signals are so spread apart you may have to wait for years to happen. If we zoom out the EUR/USD chart you can notice this, meaning even investor-type forex traders will use other trading options for trend confirmations.
Now we need something that moves faster so we can have signals in a more reasonable time span. We can also use the popular 20 and 50 period EMAs.
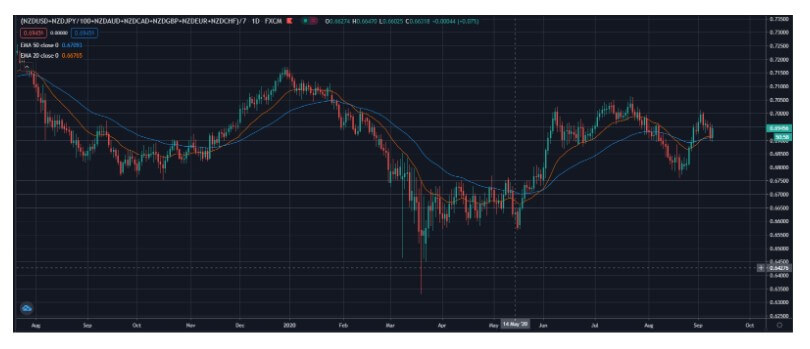
The trend confirmation signals on the MA cross are now more frequent and can be applied to a currency basket, for example, for currency strength analysis. This setup can be used on a currency pair too, however, for a professional, these signals are not good enough. Notice that the cross signals lag to the point they are too late for the bigger trends on the NZD basket picture, entering almost in the middle of the 4 visible confirmations. Smaller trends at the end of the chart are completely off, giving you signals when the trend is over.
Moving averages have this flaw when facing a directionless market, but your system should have a volume or volatility indicator/filter that should save you from these losses by giving you a signal to stop trading. Sticking to the MAs subject, a better option is a very simple adjustment on how we interpret the signal to enter. Let’s just focus on the 50 EMA and delete the other. The trend confirmation signal is when the price cross-closes the 50 EMA. Now we have a very different and much better entry point, capturing most of the 4 trends in the picture.
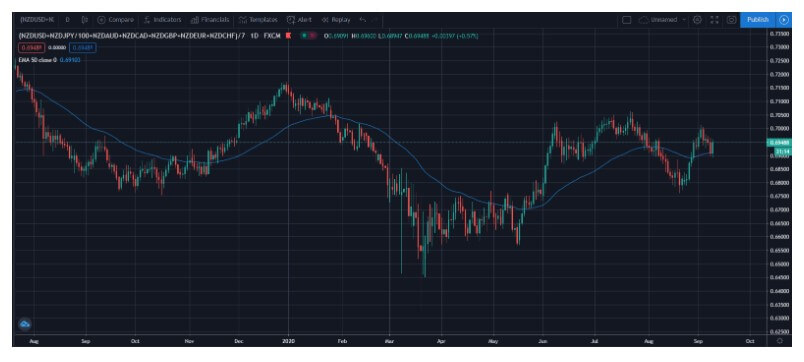
Notice that during the periods of trend exhaustion the signals are not always perfect. If we consider you have an indicator that filters flat periods, each trend entry is at an optimal point, providing you with profits even during smaller trends at the chart end.
When you find an MA that does a great job crossing the price when the trends emerge, that one is absolute gold. Finding one needs a lot of searching and testing, and the MA element plays an important role in the prop trader systems. They also call it the Baseline.
The Baseline Concept
The Baseline concept takes your signals from the first and second confirmation indicators and filters any that are not in line with the MA signal. By doing this, small corrections on the major trends are filtered in case your confirmation indicators are wrong. Once the corrections are exhausted, the major trend continues where you again reenter. This major trend is considered exhausted once the price cross-closes the Baseline and a new one emerges or a period of calm, trendless action is about. Moving Averages are very bad in these flat conditions, so is your baseline, therefore volume or volatility tools need to step in.
By going short only if the major trend is going down, and vice versa, you add up your odds of having a winning trade. Now, this is only one of the baseline functions. In your quest of finding a good MA as a baseline element in your system, you will find so many options and so many settings you can change you might not be sure it is the right one as something better is just around the corner. If you are not sure, take a zoomed-out approach. Your MA of choice should cross the price action at points where new trends emerge but allow smaller corrections of the major trend without fake cross signals.
It should be sensitive enough to give you optimal signals once a new trend starts, unlike 200 EMA for example, which is just too slow for our trading way on a daily chart. Some traders like MAs that are calculated in a way so they represent an average and signals you cannot see with eyes only by just looking at price action. A number of these MAs are developed by John Ehlers but you should aim for an MA that fits your system and take a holistic approach to it.
The Baseline serves as a major trend filter but prop traders understand other concepts to it. Price actions always tend to return to the average value, once it deviates. Unless there is a strong driver (news event) to push the price out of the normal deviation range, the correction towards the baseline is likely. Technical Prop traders measure this distance the price has moved away from the baseline. According to it, they create a rule – if the price has moved too far away from the baseline once it crossed it, they will not make a trade. This signal to enter (if other indicators confirm) will not be optimal, the odds are not very good now. Now, how to measure and find out if the price has moved too far? One of the easiest ways is by looking at the ATR indicator. Measuring the price level pip range from the baseline and comparing it to the ATR (14) gives you an estimate if it is too far.
ATR
ATR measures the volatility of the currency pair and it will give you a measure of how much the price can move away from your baseline daily. If the price is above the daily ATR value, it is a mark it deviated from the normal ranges. This point is also where technical traders put their first Take Profit and move Stop Loss to breakeven. Another important baseline role is also measuring the distance where to put your initial Stop Loss when you enter a trade. According to some testing done by prop traders, the 1.5xATR range is most optimal on a daily chart, but this setting should be adjusted to your system as it may be more or less sensitive.
Of course, only back and forward testing can give you an answer to where the best point is for your system and 1.5xATR can serve as a starting setting. To make your testing process faster, there are tools (for MT4 and MT5) that plot ATR lines above and below the price levels so you can easily see if a trade can be made, if it hit the TP or SL, etc. These tools are not available by default in the MT4 so you will need to find one.
As we can see, the baseline is an important element not just for major trend gauging but also a base for your risk management. A combination of these creates a complete solution to your trading, excluding your guesses that are more often than not bad in terms of probability calculations. As MAs are abundant on the internet, the search for them will likely be easier than for the volume tools, for example. The much harder part is the long testing phase with different settings and calculation types.
Know there are interesting solutions on some specialized forum/websites where one tool can hold several MA calculations, such as TEMA, ADX, Athens MA, SineWave MA, DEMA, Jurik MA, many smoothing options, filtering, and other settings that make an incredible array of how you define your baseline. In conclusion, know MA crossover signals are not a very good option as trade entry signals, MAs are not very good in ranging markets and that there are multiple uses for them, you just need to test a lot.

