Introduction
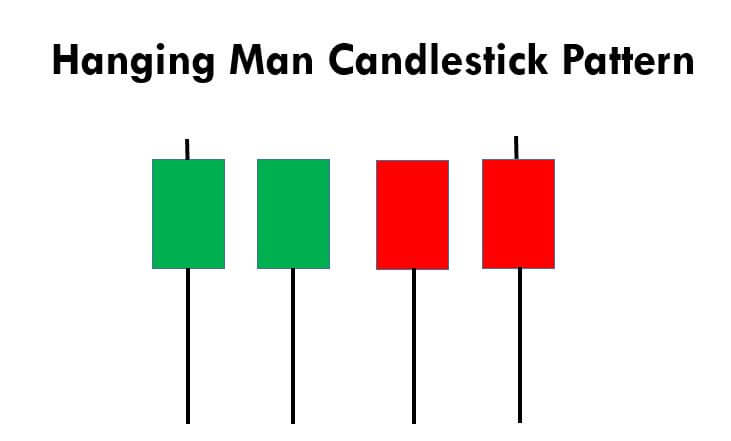
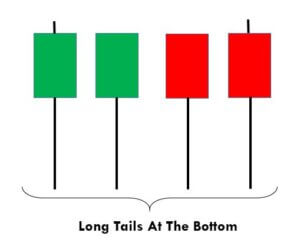
The Hanging Man is a visual candlestick pattern which is used by traders and chartists in all type of markets. The term ‘Hanging Man’ refers to the shape of the candlestick. Visually the hanging man looks like a ‘T,’ and it appears in an uptrend. The formation of this candlestick is an indication that the uptrend is losing its strength. Meaning, sellers started showing interest, and the current trend of an asset is going to get reversed. Anyone can easily predict from the name of this pattern that it is viewed as a bearish sign.
The Hanging Man candle composes of a small body and a long lower shadow with little or no upper shadow. The vital point to remember is that the hanging man pattern is a warning of the upcoming price change, so do not take it as a signal to go short. Also, trading solely based on one pattern is risky. To confirm the sign given by the Hanging Man pattern, traders must pair it with support resistance or any other trading indicator.
 This pattern is not confirmed unless the price falls shortly after the Hanging Man. If the next candle closes above the high of the Hanging Man, this pattern is not valid. After the pattern, if the very next candlestick falls, then it’s a clear indication of the reversal. Now, if you see a Hanging Man candlestick and the above-discussed rules apply, you can go ahead and take the trade. But since it is crucial to have an extra confirmation, let’s pair this pattern with a technical indicator.
Pairing the Hanging Man Pattern With MACD Indicator
In this strategy, we have paired the Hanging Man pattern with the MACD indicator so that we can filter out the low probability trades. MACD stands for Moving Average Convergence and Divergence, and it is one of the most popular indicators in the market. It is essentially an oscillator that is used for trading ranges, trend pullbacks, etc. Also, this indicator identifies the overbought and oversold market conditions. In this strategy, we are using the default setting of the MACD indicator to identify the trades.
Step 1 – Confirm the uptrend first on your trading timeframe
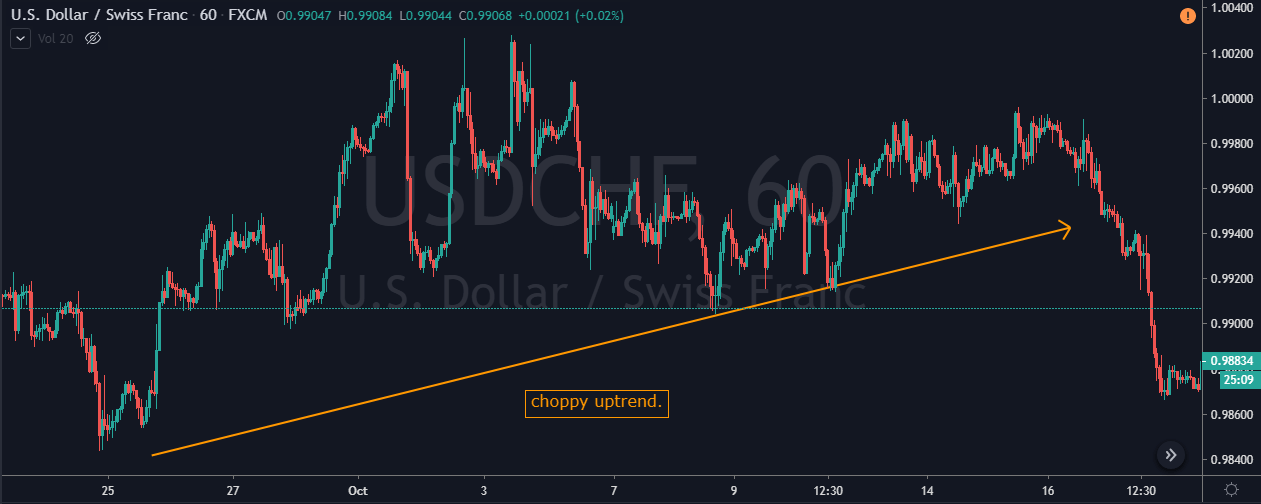
We can’t use the Hanging Man pattern to take the buy trades. Since it is a reversal pattern, it only signals the selling trades. So first of all, find out the uptrend in any currency pair. One more primary thing to remember when trading this pattern is this – After finding a clear uptrend, if you see the market printing the Hanging Man, then try not to trade that pair. Because, in a strong trend, it’s not easy for a single candle to change the direction of the entire trend. But if you find this pattern when the uptrend is a bit choppy, it has higher chances to perform. As we can see in the image below, the uptrend in USD/CHF was not strong enough.
Step 2 - Find out the Hanging Man pattern on your trading timeframe
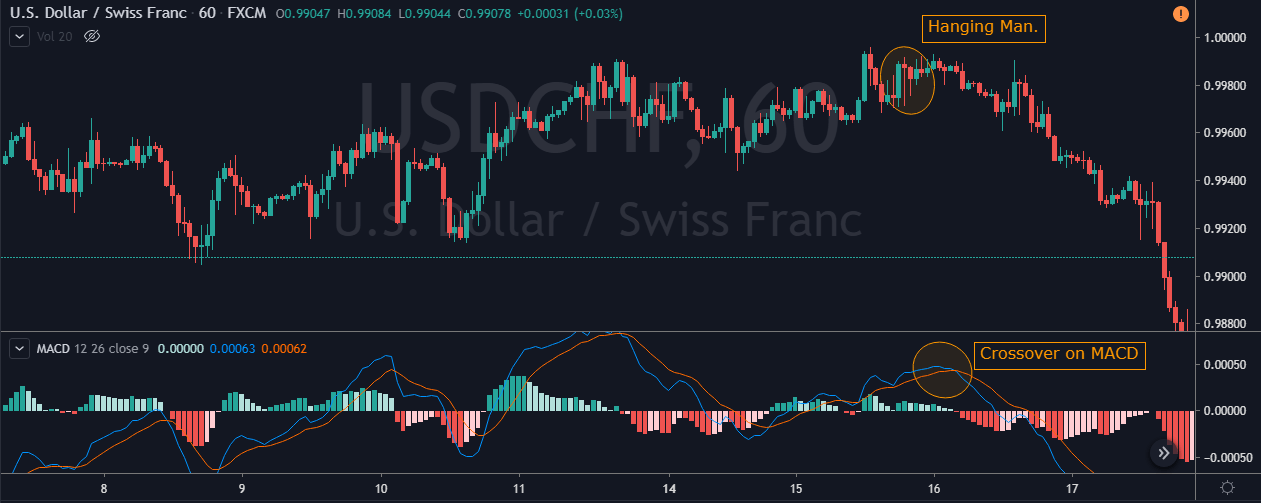
Some traders use two or three timeframes to trade patterns. But that’s not the right way of pattern trading. If you are an intraday trader, use only lower timeframes to identify the pattern. So the next step here is to find out the Hanging Man in this chart. Also, apply the MACD indicator. For us to go short, the MACD indicator must be in the overbought area.
As you can see in the image below, the USD/CHF Forex pair prints a Hanging Man pattern. This is the first clue for us that the buyers aren’t able to push the market higher. Soon after the crossover happened on the MACD indicator, we can say that this forex pair is in the overbought condition. So now, two forces are aligned, and they are indicating us to go short. Within a few hours, the pair rolls over, and it prints brand new lower low.
Step 3 – Entry, Take Profit & Stop Loss
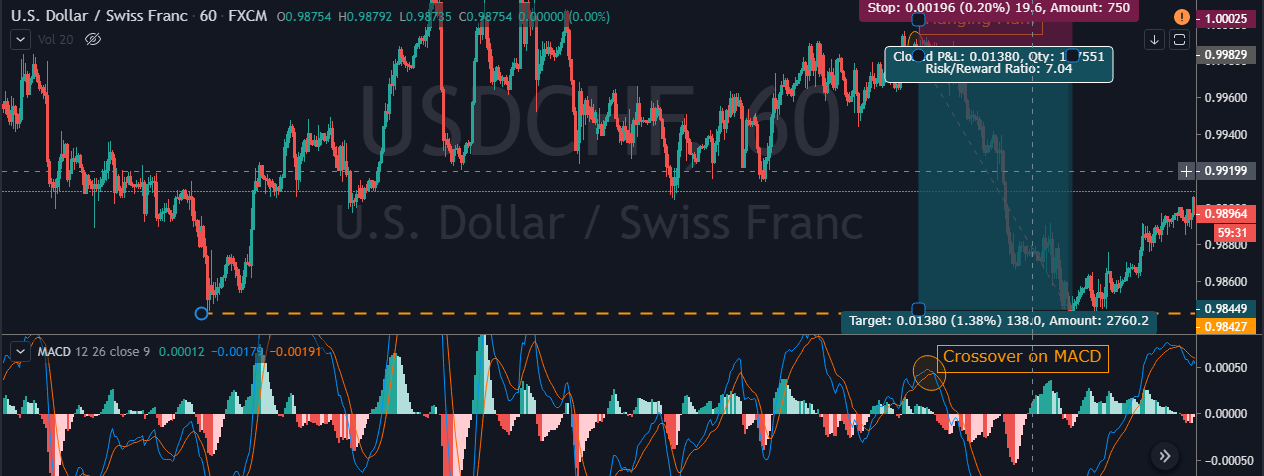
We go short as soon as we see the Hanging Man candlesticks and MACD indicator at the overbought area, we can go short. In this pair, buyers were quite weak, and this is an indication for us to place deeper targets. As we suggest in every strategy, often close your position at significant support/resistance area, or when the market starts to print the opposite pattern. In this pair, we closed our full trade at 0.9844. Overall it was 7R trade, and we made nearly 140+ pips.
Placing the stop loss depends on what kind of trader you are. Some advanced traders use their intuition to close their positions, while some use logical ways such as checking the power of the opposite party. In this trade, we know that the buyers are not strong enough, so there is no need to use the spacious stop loss.
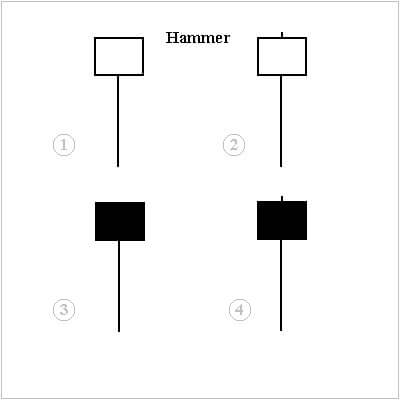
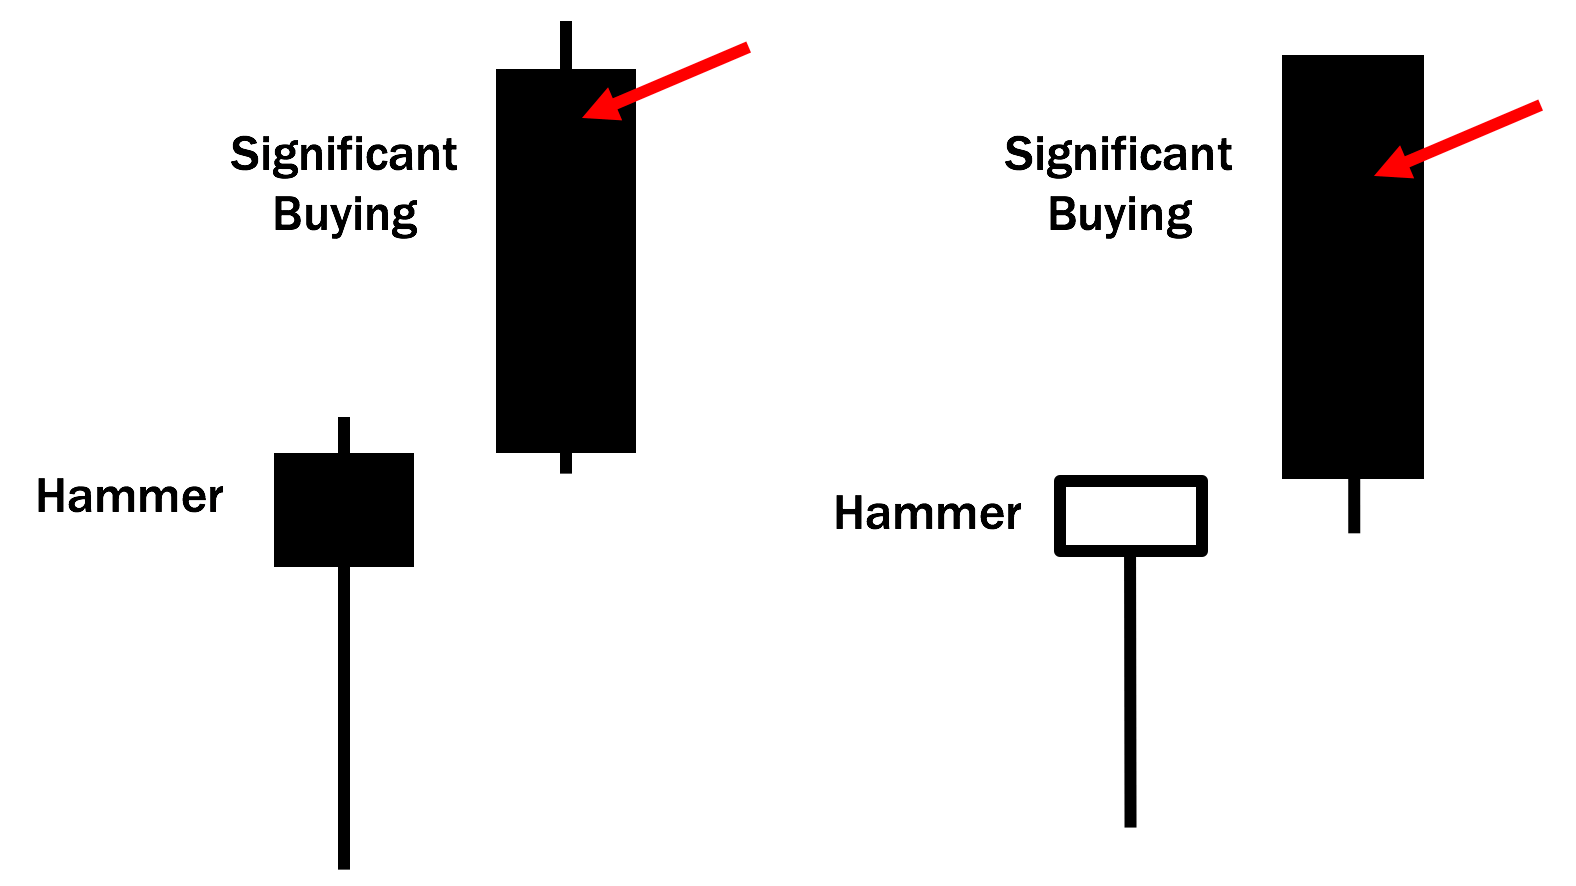
Difference Between Hanging Man and Hammer Patterns
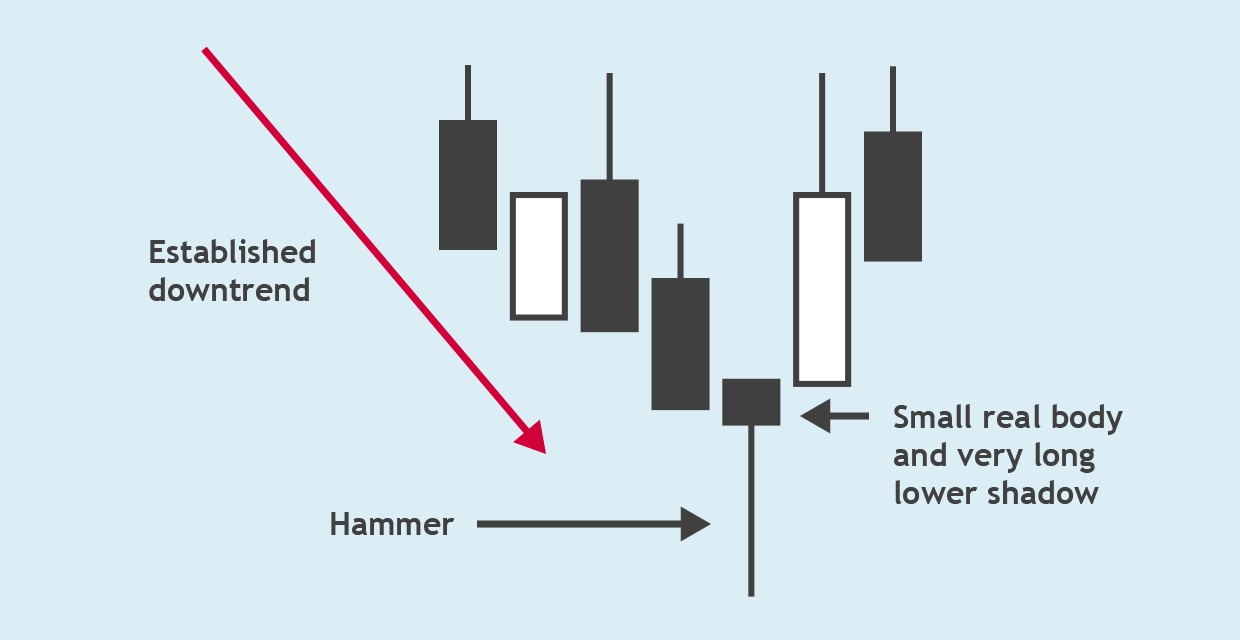
The Hanging Man and Hammer both look the same terms of size and shape. Both of these patterns have long, lower shadows and small bodies. But the Hanging Man forms in an uptrend, and it is a bearish reversal pattern. Whereas the Hammer forms in a downtrend, and it is a bullish reversal pattern. These two patterns appear in both short and long term trends. Do not use these patterns alone to trade the market. Always use them in conjunction with some other reliable indicators or any other trading tool.
Bottom Line
Most of the professional traders never see this pattern alone as a predictor of a potential trend reversal. Because there will be times when the price action continues to move upward even after the appearance of the Hanging Man. Hence technical indicator support is required to confirm the reversal of the trend. Make sure to stick to the rules of the pattern so that you can use it to your advantage. This pattern forms in all the timeframes, but we suggest you master it on a single timeframe first. Cheers!