Traders believe if they need to trade the forex market, they need to keep up with the – news, fundamental analysis, you must check the various reports, read the currency articles, and then finally use the technical analysis where all the type of indicators are available for you to master them then only start the trading. If you want to avoid these things, then there is another way for you. Price action trading is a simple and effective method you can use to trade the markets successfully. Here you don’t need to master the fundamentals or indicators, instead focus purely on what price action is saying.
Price action explains the market movements via the chart patterns, candlesticks, and by using the trend lines. The formations of the trading patterns are the direct result of how the collective traders thinking about particular situations, in short, the perceptions of the collective consciousness forming these patterns on the price chart. Each trading patterns have some meanings and traders who master these patterns use them for trading the market successfully.
PRICE ACTIONS TRADING TOOLS
DEFINING THE SUPPORT AND RESISTANCE LEVELS
The concepts of support and resistance are the highly discussed attributes of the technical analysis. Almost every trader around the globe knew about support and resistance trading. A support level tends to acts as a barrier to price action. It is a level where the price action can be expected to pause due to the demand. Most of the retailers use the support area to buy the asset. Support levels are mainly derived from the memories of the traders. For example, traders always check on the historical price data to find out the significant support levels. These are the levels from where the last time prices respond, and by using that level, they placed the buy orders with the expectations of the price reversals. The more closer the price action is to the support level, the bigger the demand will be. Always look for the significant support levels on the price charts to take trades; major support levels are where the higher timeframes gave reversals in the past.
On the other hand, resistance levels are useful to take the selling trades. The resistance level is also acting as a barrier to the uptrend. It is a level where all the traders take the selling trades in the past. The higher the timeframe is, the stronger the resistance area will be. The sixty-minute or four-hour chart doesn’t hold enough power to reverse the trend; it is the daily weekly resistance levels that can easily change the trend. If you are using the lower timeframe resistance levels, then use them for smaller trades, and if you desired to catch the full trend, then merely a higher timeframe is a good choice for you.
CHART PATTERNS
The price action traders use chart pattern trading. Over time professional traders find out the patterns on the price chart, which reflects the psychology of the buyers and sellers. These patterns become the most popular and leading way in the industry to trade the markets. All you need to do is to interpret these patterns very well to use them. Most traders made mistakes where they jump into the half-formed patterns and end up on the losing side. In the markets confirmations of the pattern is very crucial to make any trading decision.
FLAG PATTERN
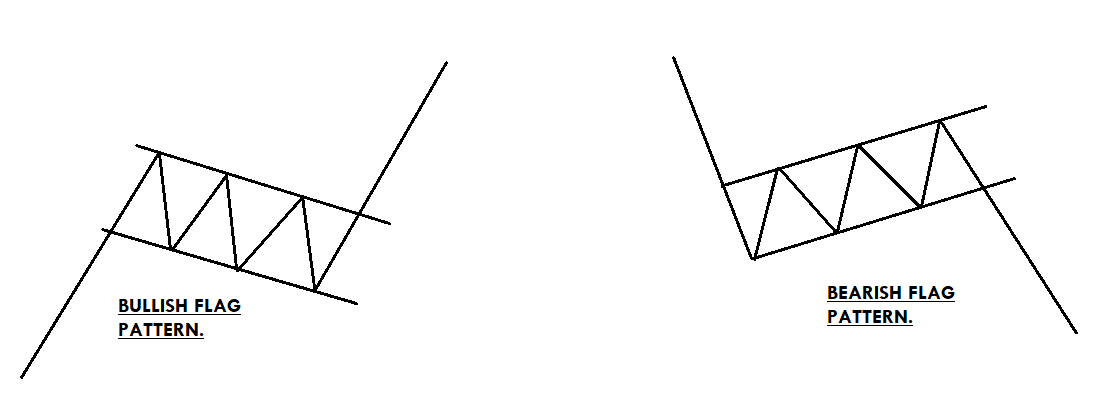
A flag is a technical chart pattern that appears in a strong uptrend. It is a continuation pattern that consists of a long pole and a downside flag. It is named because of the way it reminds the viewer of a flag or a flagpole. The pattern is used to take the trade with the trend, or it is useful to time your trades. In an ongoing trend, wait for the prices to pull back enough, after that draw the two lines above and below the price action to draw the pattern. The bottom of the pattern should not exceed the midpoint of the flagpole and wait for the breakout to take the trade. In buying trade, stops should be below the entry and go for a brand new higher high.
TRIANGLE PATTERN
There are so many different types of triangle patterns in the market. The patterns are formed by crossovers of the support and resistance lines. Below are a few triangle patterns we mentioned.
- Ascending Triangle (It consists of a static resistance and ascending support) – It is a continuation pattern that appears in an uptrend. The entry should be taken at the breakout of the resistance level.
- Descending Triangle (It consists of static support and descending resistance) – This one is also a continuation pattern that appears in a downtrend. The price action moves slowly inside the pattern because both of the parties hold equal power. In contrast, the breakout of the pattern indicates the sellers overtake the show.
- Symmetrical Triangle (The support and resistance of the pattern converge at the one point.) This pattern represents the period of consolidation before the price is forced to move in one direction. The breakout marks the starting of the uptrend, whereas the breakdown of the lower line is an indication to go short. So this pattern is also known as a falling and rising wedge pattern.
- Expanding Triangle (Both the support and resistance lines are moving away from each other) this one is a very tricky pattern because price action makes new high and new low in each wave. It is very hard to know the direction of the market when the prices move inside the pattern, so always wait for the breakout or breakdown to take the trade.
All of the triangle patterns are only useful to trade after the breakdown or breakout. The price inside the patterns gave no signal of which side they are going to break, so it is better to wait for the breakout to make any trading decision.

CANDLESTICK CHART PATTERNS
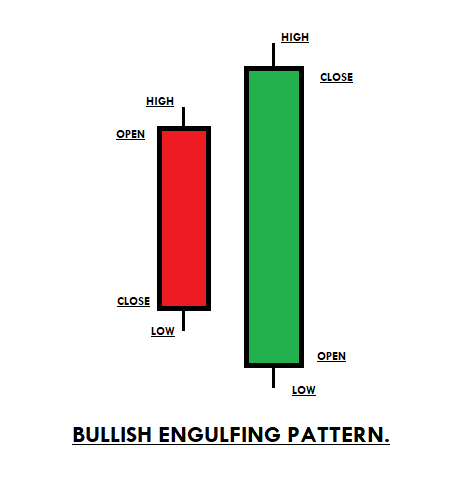
ENGULFING PATTERN
Engulfing is a reversal pattern; there are two types of engulfing patterns. The first is bullish engulfing and the second one is bearish engulfing. Engulfing pattern consists of two candles where the first candle overtakes by the second candle. The bullish engulfing pattern appears at the end of the downtrend; the first candle is red, which completely overtakes the second candle, which is green in colour. The bearish engulfing pattern appears in an uptrend; the first candle is green in colour followed by the red candle, which engulfs the first one. The bearish engulfing signals the bears take over the bulls and expect the new downtrend, whereas the bullish engulfing pattern indicates the bulls take over the bears and expect the beginning of the brand new higher highs. The stop-loss order must be below the pattern in an uptrend formation, and the stops for the downtrend formation must be above the pattern, for booking profits choose the higher timeframe major levels.
SHOOTING STAR AND MORNING STAR
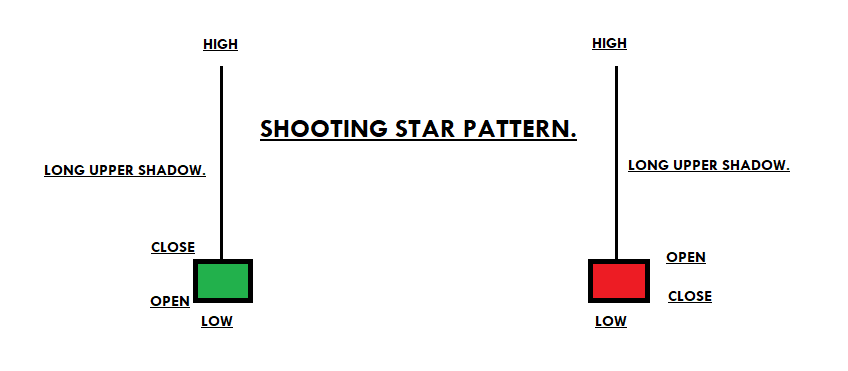
SHOOTING STAR
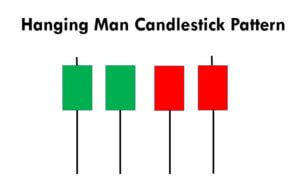
A shooting star is a bearish candlestick pattern that opens, advances throughout the day, and then closes near the open of the day. In short, it is a long upper shadow, the small body which indicates the selling trades. The pattern opens in an uptrend indicates the buyers are strong, goes higher but closes back at the opening price shows the sellers pressure.
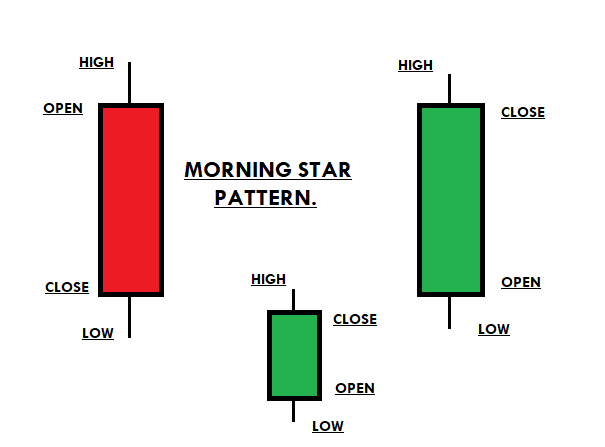
MORNING STAR
A morning star is a three candlestick pattern that appears at the end of the downtrend. It is a reversal pattern that shows the buyers were first in control and the second candle was the fight between both parties and the third candle was green in colour which indicates the buyers won the battle and they are ready for the brand new higher high. Entry should be at the closing of the pattern and ride the uptrend until there are indications of another reversal.
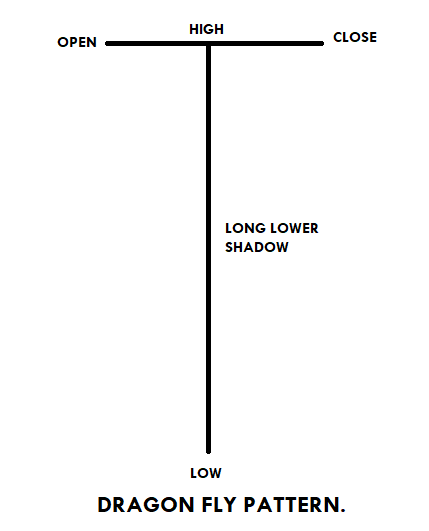
DRAGONFLY PATTERN
Dragonfly is a bullish reversal pattern that indicates the beginning of an uptrend. The pattern consists of a long lower shadow, which means sellers tried to take the prices down, but the buyers came back and closed the prices the same as the opening price. The unique name “Dragon Fly” means the buyers are very aggressive, and now they are all set to print the brand new higher high. Traders should wait for the next candle to close above the lowest price of the previous candle to confirm the Dragonfly pattern. The stop loss should be below the candle, and for taking profit go for a brand new higher high. The pattern doesn’t occur frequently, but when it happens, it often ends up giving more significant buying trades.
FAKE BREAKOUT
A fake breakout happens when the price action breaks the major level and comes back again. When the fake breakout occurred, if you witness any candlestick pattern, then that’s a good sign for you to take the trade in the direction of the established trend.
CONCLUSION
Traders believe it’s not possible to trade the markets without the indicators. But it’s just another myth. There are so many different ways to trade the market, and using candlesticks, chart patterns, fake-outs are just another way. Every trader has its style of trading; some like to trade the indicators, some chart patterns, and another candlestick pattern. Choose whatever the way you want and trade the market. The above-explained ways are the leading technical tools; you can even pair the candlestick patterns with the chart formations to improve the odds in your favour. If you find the fake-out, the candlestick pattern then followed by chart pattern, then the trade even has a higher odds to perform. When the markets prints the guaranteed trades go big and always use the stop-loss orders.