Introduction
In the previous article, you were made familiar with different single candlesticks patterns that gave both continuous and reversal signals. In this article, we shall acquaint ourselves with the rest of the most popular double and triple candlestick patterns. In the following sections of the article, we will talk about the continuous double candlestick patterns – Tweezer Tops and Bottoms & Harami. Both of these candlestick patterns involve two candles, and they indicate signs of trend continuation in the market.
Tweezer Tops and Bottoms Candlestick Pattern
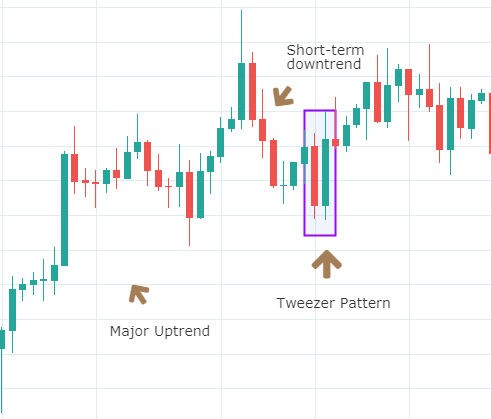
Tweezer patterns are double candlestick patterns that indicate a continuation of the current trend. But a broader context is needed to confirm the signal since Tweezers can occur frequently. A topping pattern occurs when the highs of two candlesticks occur at almost exactly the same level following a bullish candle. A bottoming pattern occurs when the lows of two candlesticks occur at almost exactly the same level following a decline in price.
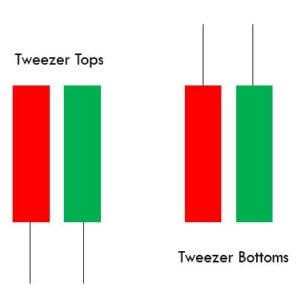
The idea behind the topping and the bottoming pattern is that the first candle shows a strong move in the direction of the short term trend. While the second candle may be a pause or even a candle that completely reverses the previous day’s action. It means a short-term shift in momentum has occurred, and the price moved in the direction of the long term trend.
The image below shows how the pattern looks and explains the concept clearly.
Charts are taken from Tradingview
Pattern Confirmation Criteria
- The first candle needs to have a large real body, i.e., the difference between open and close should be preferably big.
- The second candle can be of any size. But if it is larger than the previous candle, the price can accelerate soon in the same direction.
Traders view this pattern as a potential sign of trend continuation and enter into a new position depending on the broader trend, with a minimum stop loss.
Harami Candlestick Pattern
Harami is a candlestick pattern that is formed by two candlesticks and indicates a continuation in the trend. Let’s discuss the Bullish Harami pattern to understand this concept better. A Bullish Harami Pattern essentially shows that the short term downtrend in an asset is coming to an end, and the market may continue its uptrend.
The pattern is formed by a long candlestick followed by a relatively smaller body. The second candle is completely contained within the vertical range of the previous body.
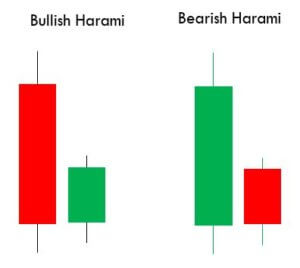
The chart below shows a Bullish Harami pattern. The few candles before the pattern indicate a short term downtrend in the currency, and the Green candle represents a slightly upward trend, which is wholly contained within the previous candle.
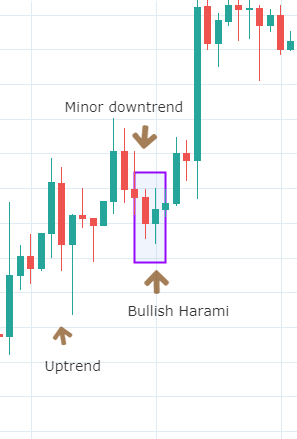
Charts are taken from Tradingview
Pattern Confirmation Criteria
- It is necessary to have initial candles that indicate a clear short-term downtrend and that a bearish market is pushing the price lower.
- The second candle needs to close near the middle of the previous candle, signaling a higher likelihood that a reversal of this downtrend will occur, and the price will move in the direction of the major uptrend.
Traders look at the appearance of the Bullish Harami pattern as a good sign of entering into a long position on an asset. This pattern is also combined with single candlestick patterns for confirmation signals. The opposite is the case for Bearish Candlestick Patterns.
While Tweezer Tops patterns are more flexible and easy to identify, Harami has a mandatory requirement of a ‘Doji’ (Candles with tiny body and long shadows) as the second candle. Both of these are trend continuation patterns with a high degree of accuracy. There are many more dual candlestick trend continuation patterns which you should be researching on your own. In the next lesson, we will be discussing double candlestick trend reversal patterns. Cheers!
[wp_quiz id=”60881″]