Categories
Forex Service Review

Stochastic with AMA Filtering Indicator Review

Stochastic with AMA filter is an indicator that offers a simultaneous stochastic indicator (oscillator) with signal line filtration by means of the adaptive moving mean (АМА). The developers of this indicator have also added a multicolored signal line display feature. In addition, signal line values below the specified minimum level or above the specified maximum level can be highlighted.

The parameters of this indicator are as follows:

  • Period K – period K of the stochastic oscillator
  • Deceleration – the period of deceleration of the stochastic oscillator
  • Price field – Stochastic Oscillator Used Price Mode
  • Maximum level – maximum level value
  • Minimum level – minimum level value
  • Showcoloredama – enable/disable color signal line display
  • Showarrowsupdn – enable/disable the display of color signal line in dot form
  • iPeriodAMA – Period of smoothing
  • Fastestama – fasting period АМА
  • Slowstama – slow period АМА
  • dSMT – power for calculation of АМА
  • Methodama – АМА smoothing period
  • Arrow up – signal line growth symbol code
  • Arrow down – signal line drop symbol code
  • Arrowext – code to highlight signal line values outside the minimum and maximum levels
  • Add digits – increasing the number of decimals in indicator values
  • Activate alert message at line crossing
  • Activate alert notification at line crossing
  • Activate alert sound at line crossing
  • Alert sound file name

Yellow circles are the indicator values above and below the oversold and overbought levels. To enable the display of arrows (colored dots), change the parameter ShowArrowsUpDn.

The price of this indicator, available on the MLQ5 market is only 30 USD. As affordable as it is to purchase the indicator outright, there is a cheaper option which is to rent it for the price of 10 USD for a period of one year. 

At the time of this review, only one user review was provided by user Chao Tang:

“Good trading indicator. Thank you, inventor!”

Although the indicator was created in February 2015, it has hardly any user comments or reviews on third-party websites, so we cannot make an assessment that takes into account users’ views. Fortunately, it is available at a very affordable price which allows for use without much financial risk.

Categories
Forex Basic Strategies

An Exclusive Strategy To Trade The Fiber (EUR/USD) Currency Pair

Introduction 

In the previous article, we discussed a trading strategy that was a combination of EMA and RSI. Presuming that all the readers easily understood it, we will now discuss a trading strategy that is a combination of three technical indicators. Today’s article will acquit us with another useful and reliable trading system that is based on the combination of Simple Moving Average, Stochastic Oscillator, and Relative Strength Index (RSI).

Time Frame

This strategy is only applicable on the 1-hour time frame. This is because all the indicators tend to sync in this time frame. Therefore, the strategy may not be suitable for day traders.

Indicators

The strategy consists of three indicators – a 150-period Simple Moving Average (SMA), Relative Strength Index (RSI) with period 3, and a Full Stochastic Oscillator with standard settings. The overbought and oversold levels for the indicators stand at 70-80 and 30-20, respectively.

Currency Pairs

As the name suggests, this strategy is exclusively meant for ‘EUR/USD.’ The liquidity and volatility of EUR/USD are extremely supportive of this strategy.

Strategy Concept

We first identify the direction of the market using the 150-period SMA and then establish a channel in the same direction. This is the first condition that has to be met before we can initiate a ‘trade.’ One could also this is a ‘channel’ based strategy as it involves going ‘long’ at the bottom of the channel and ‘short’ at the top once the indicators generate signals.

For a ‘long’ entry, we need to see if the Relative Strength Index drops in the oversold area. Once it drops, we look for a bullish crossover of the Stochastic lines, while they are also within their oversold zone. In simple words, we need a channel in a bull trend with both the indicators indicating that the market is oversold and with the Stochastic displaying a bull reversal.

Conversely, a ‘short’ trade is generated when the price starts moving in a downward channel in a bearish trend. The RSI and Stochastic should be in the overbought area that will later display a bearish reversal. As soon as the Stochastic fast and slow lines make a bearish crossover, we enter for a ‘sell’ on the next price bar. All of the above price action must happen below the 150-period SMA.

The strategy offers a high degree of capital protection as we place our stop-loss at the most recent ‘swing low’ or ‘swing high.’ As far as the ‘take-profit’ is concerned, we can use a fixed profit target, or we could scale out as the market approaches our target and protecting it with a trailing stop. An exit signal is also generated by the Stochastic indicator, which we will be discussing in the upcoming section of the article.

Trade Setup                     

In order to explain the strategy, we have considered the 1-hour chart of EUR/USD, where we will be applying the rules of the strategy to execute a ‘long’ trade.

Step 1: First of all, open the 1-hour chart of EUR/USD and establish the trend of the market. Plot Simple Moving Average (SMA) with a period of 150, Stochastic and Relative Strength Index with their default settings on the chart. If the price is above the 150-period SMA, we say that the market is in an uptrend. Whereas if the price is below the 150-period SMA, we say that it is in a downtrend. Next, draw a channel within the trend. It is better to have an upward channel in an uptrend and a downward channel in a downtrend.

Step 2: This is the crucial step of the strategy, where we align the three indicators together to generate a signal. After the identification of the trend and channel, we need to wait for the price to come at the extreme of the channel. In an upward channel, the price should be at the bottom of the channel, while in a downward channel, the price should be at the top.

Once the price reaches these extremes, we should watch the Stochastic and RSI. We enter ‘long’ when we notice a bullish crossover in Stochastic and an oversold circumstance of RSI (below 40). This means that the price might be putting up a ‘low’ that will result in a reversal. Similarly, we will go ‘short’ in the currency pair when we notice a bearish crossover in Stochastic along with an overbought condition of RSI (above 60).

The below image shows an example where the above step is being accomplished.

Step 3: In this step, we shall determine the Stop-Loss and Take-Profit for the trade where both these levels are derived mechanically. We place the stop-loss just below the ‘swing low’ from where the reversal took place. It will be above the recent ‘swing high’ in a ‘short’ trade. When speaking of the take-profit level, there is no fixed point for it. We take our profits when Stochastic reaches the opposite overbought/oversold level. At this point, we can either exit the trade, scale-out, or use a trailing stop. This can help in increasing the risk-to-reward (RR).

In our case, the risk-to-reward (RR) ratio of the trade was 1.5, which is above average.

Strategy Roundup

The RSI+Stochastic+SMA strategy is a reliable trend trading system that accurately pinpoints the bottom of a channel in a trend. More importantly, the strategy can provide the best-with-trend entry points that are necessary to increase the probability of winning. Since we are applying this strategy on a higher time frame, it will limit the effects of whipsaws that are encountered more often these days.

Categories
Forex Basic Strategies

Have You Tried This ‘Power Ranger’ Forex Trading Strategy?

Introduction

The forex market either trends or moves in a range. The last strategy was dedicated to trading the range. The strategy we will be discussing today is also based on trading the range. Range strategies are either pure price action based or a combination of both. Oscillators are one of those indicators that are commonly used in range strategies. This is because oscillators indicate a possible range that the price swings back and forth from.

Some common oscillators are the stochastic and relative strength index (RSI). It has been observed that identifying and trading ranges poses more challenges to traders than identifying trends. After all, ranges become evident only after it is formed.

To make things worse, when a range is formed, and one starts applying the range strategy, price action causes the market to break out or break down of a range again. The power range strategy tries to fill this gap. Let us look at how this can be done through the use of a powerful oscillator.

Time Frame

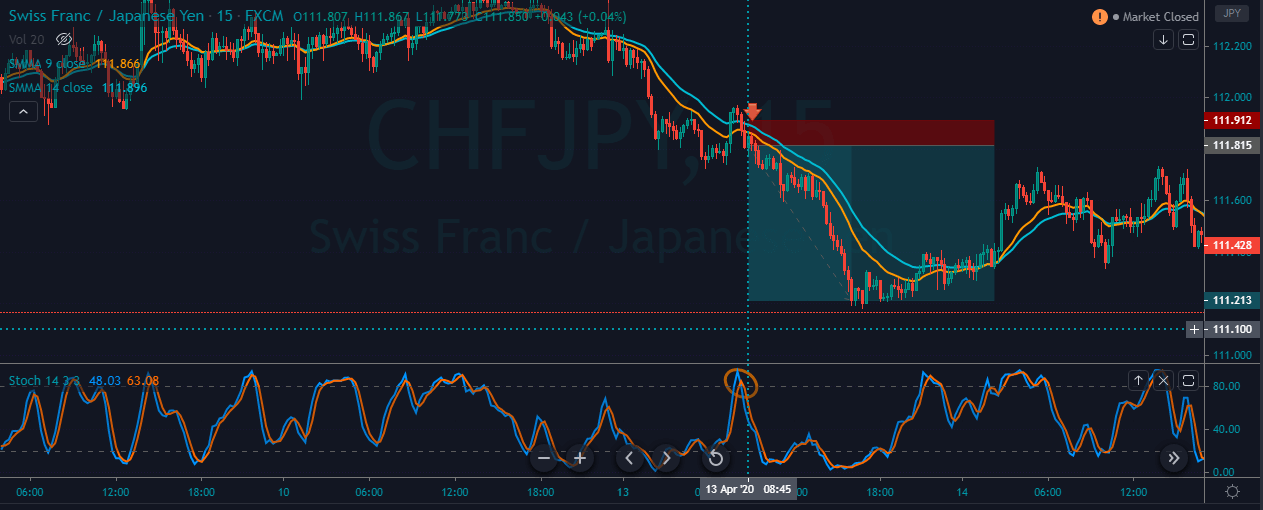
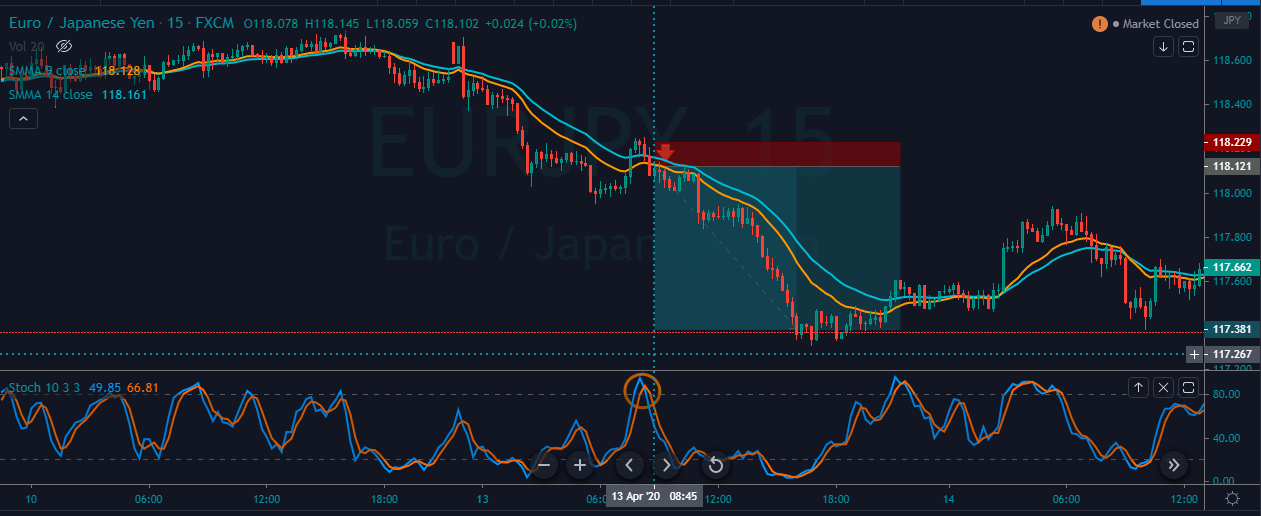
The power ranger strategy works well with the hourly (H1) or 4-hourly (H4) chart. This means each candle on the chart represents 1 hour or 4 hours of price movement. However, using the strategy on the 15 minutes time frame requires a lot of experience and practice. Hence, all new traders should use the strategy on the recommended time frame only.

Indicators 

We use the Stochastic indicator for this strategy with the following specifications.

%K period = 10 | %D period = 3 | Smooth = 3 | Levels = 20 and 80

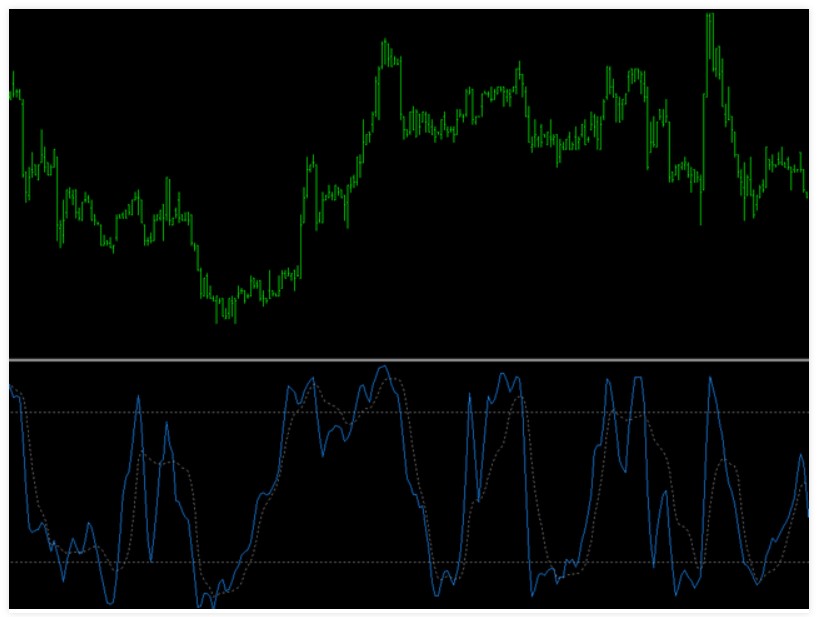
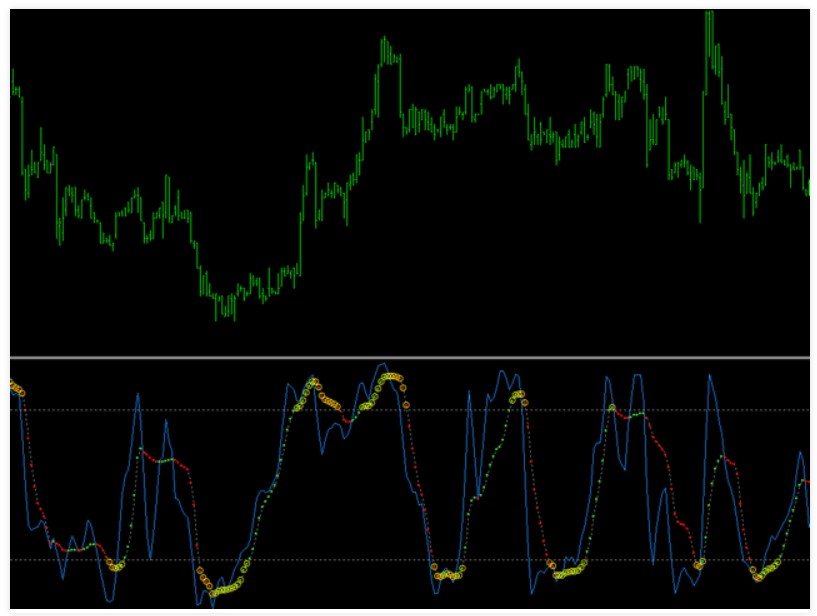
The stochastic indicator is an oscillator that measures overbought and oversold conditions in the market.

Currency Pairs

The strategy is suitable for all currency pairs listed on the broker’s platform. However, it is advised to deploy the strategy on major currency pairs as patterns clearly show in these currency pairs. One should avoid trading in exotic or illiquid pairs as apart from unclear patterns, there are other problems associated with trading such pairs.

Strategy Concept

The strategy is based on the concept that the market will form a range after a trend. We use the stochastic indicator to give us an indication of a possible range formation. The current market momentum will tell us if we will go ‘long’ or ‘short’ in the market. If the market moves in an uptrend, we look for buy opportunities in the range where the entry will be determined by the stochastic indicator’s oversold region.

If the market is moving in a downtrend, we look to go short in the range. In this case, the entry is determined by the overbought region of the stochastic. We use the most recent high and low to determine the possible resistance and support of the range. Two of the ‘take-profit’ levels are located within the range, and the third one is located beyond the range in anticipation of a breakout.

Trade Setup

To illustrate the strategy, we shall consider the USD/CAD currency pair and find an appropriate trade using the strategy. Here are the steps to follow to execute the power ranger strategy.

Step-1

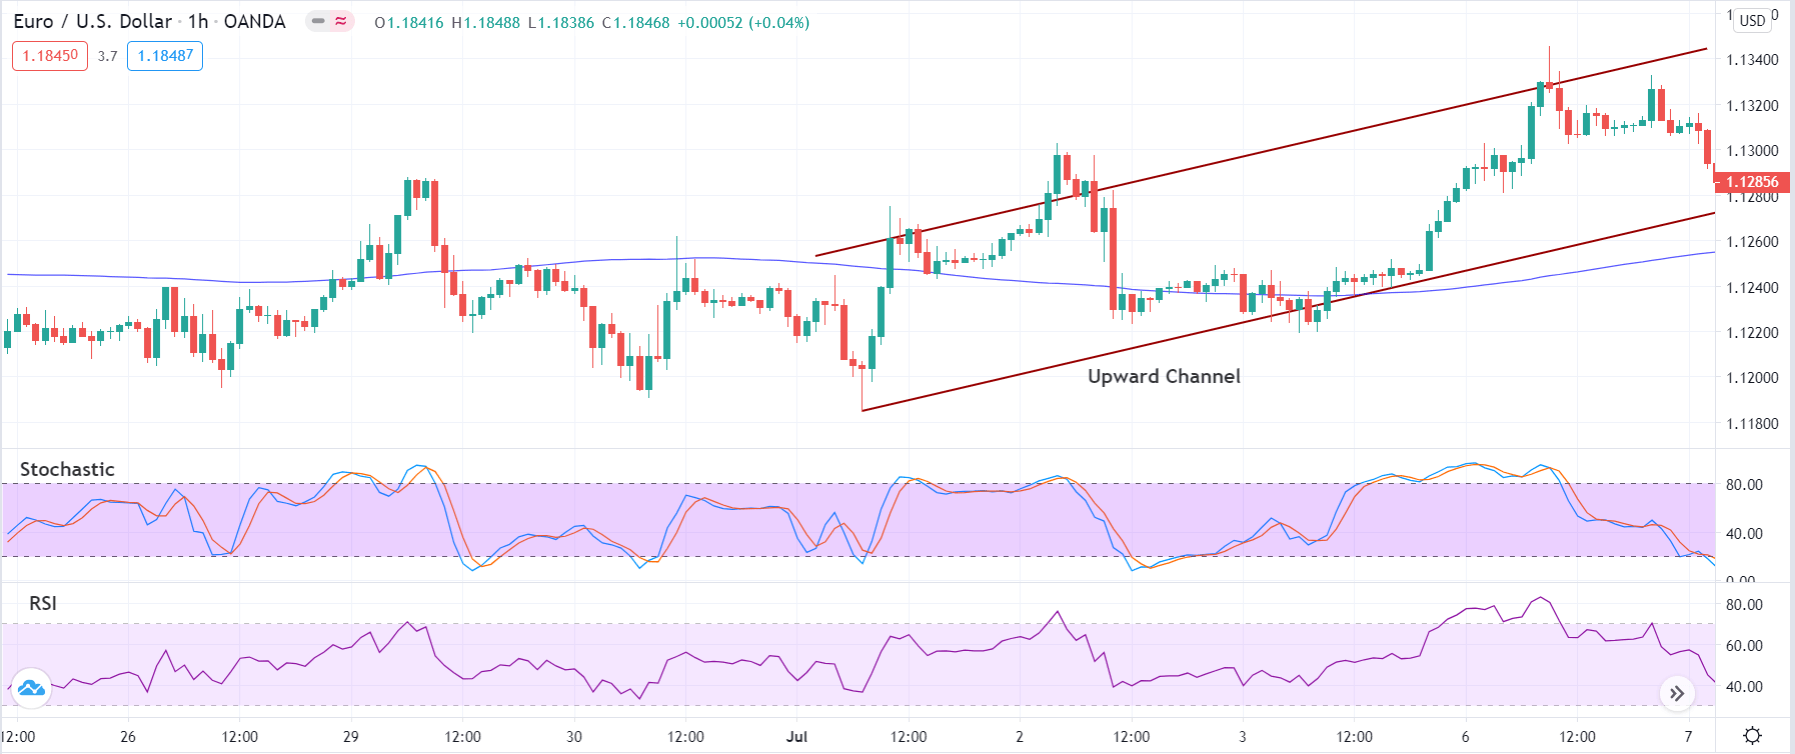
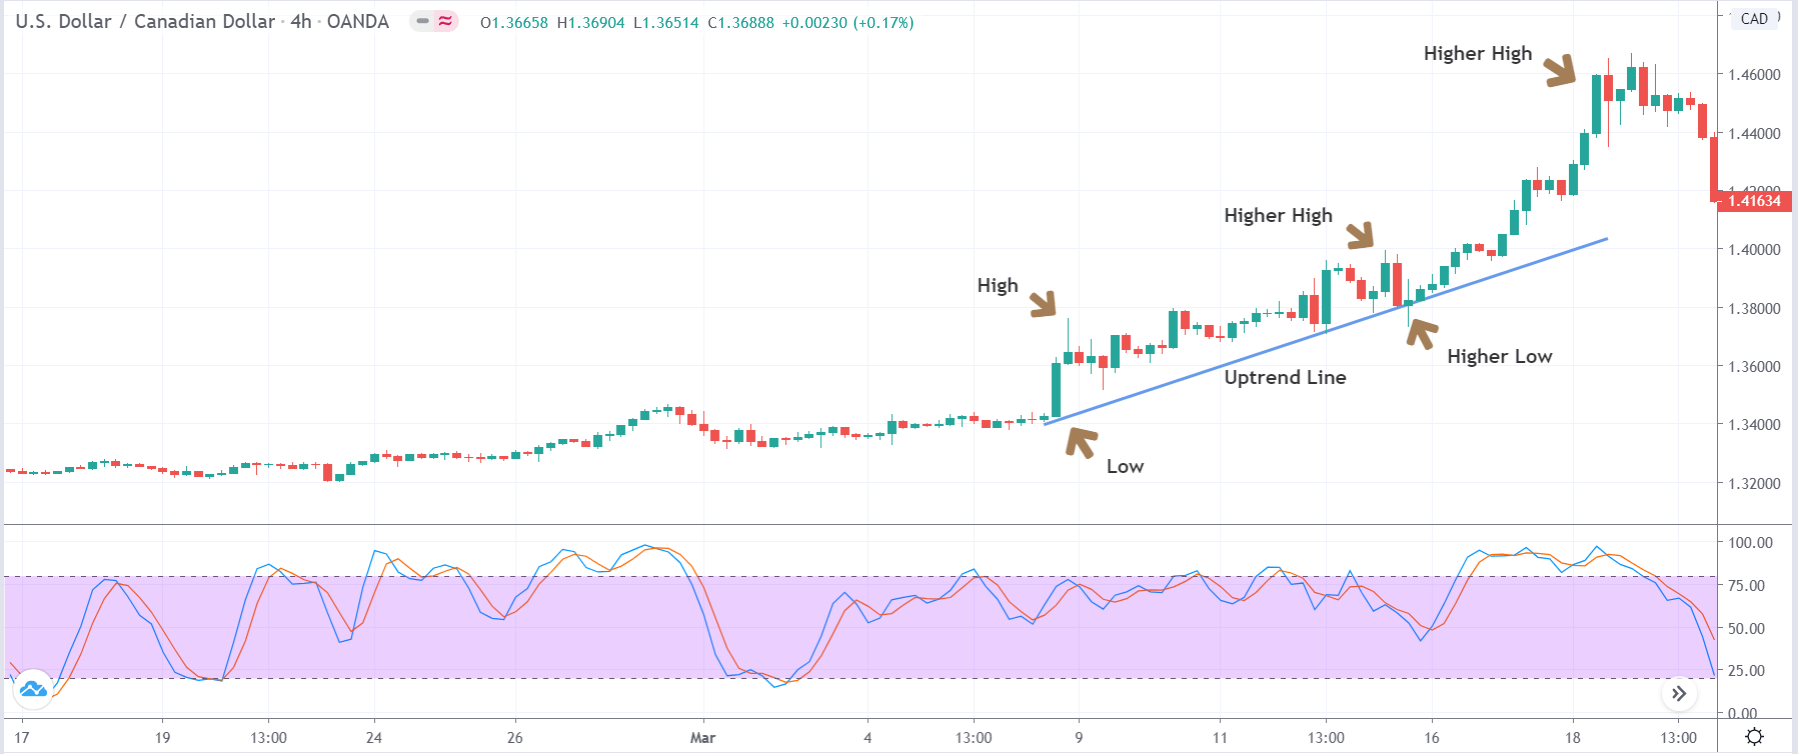
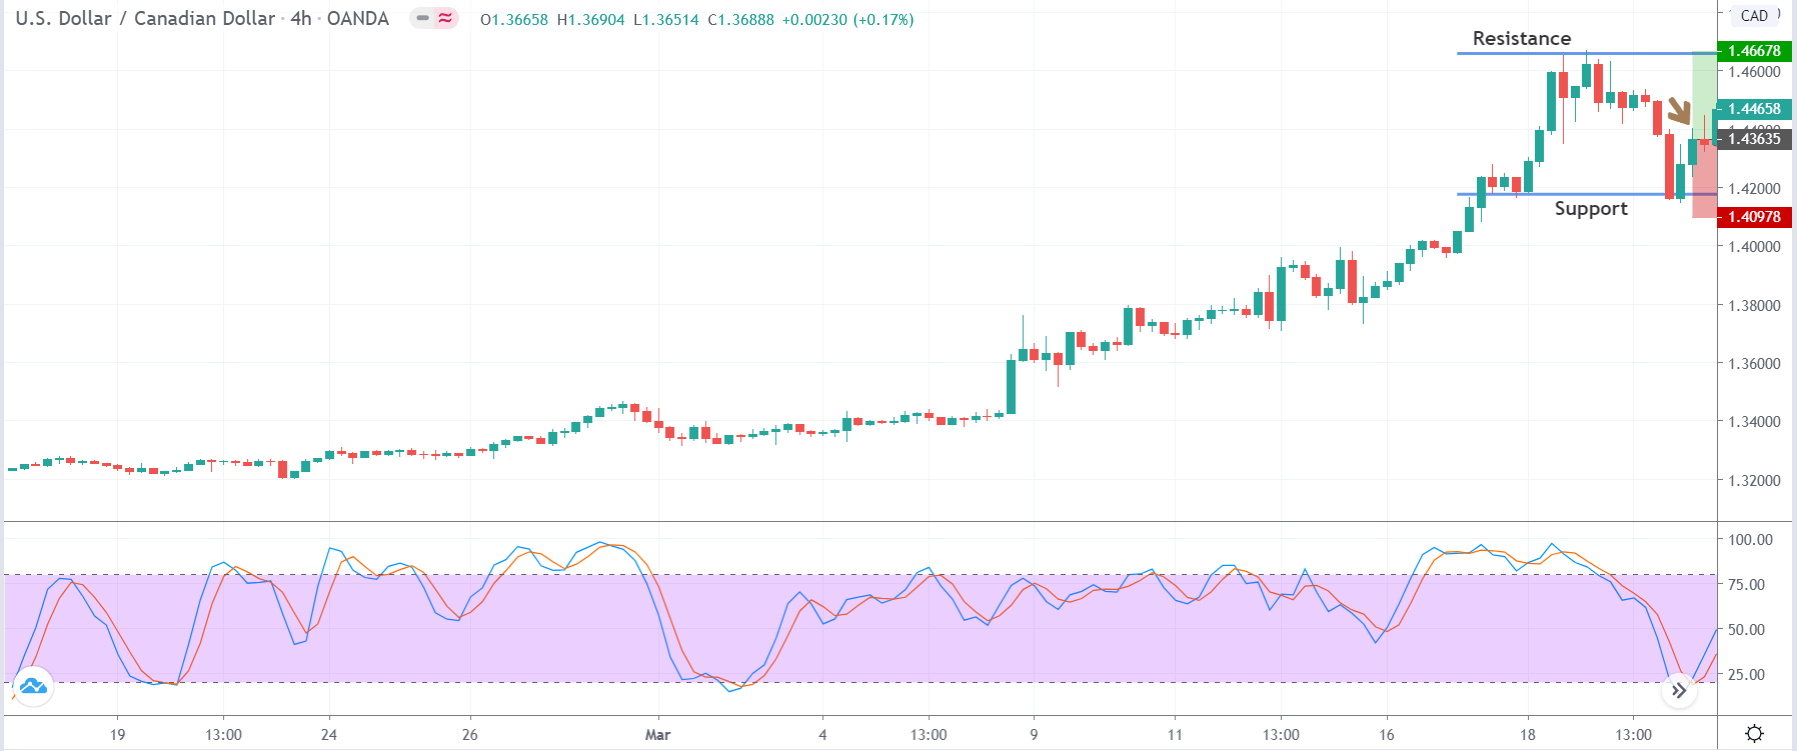
The first step is to find a trending market. By trending market, we mean, to look for higher highs and higher lows in case of an uptrend and lower lows and lower highs in a downtrend. Plot a trend line that connects these lows and highs, so that the trend looks eminent. This is the simplest step of the strategy. The below image shows an uptrend visible on the 4-hour time frame chart of the currency pair. Let us understand the further steps of the strategy.

Step-2

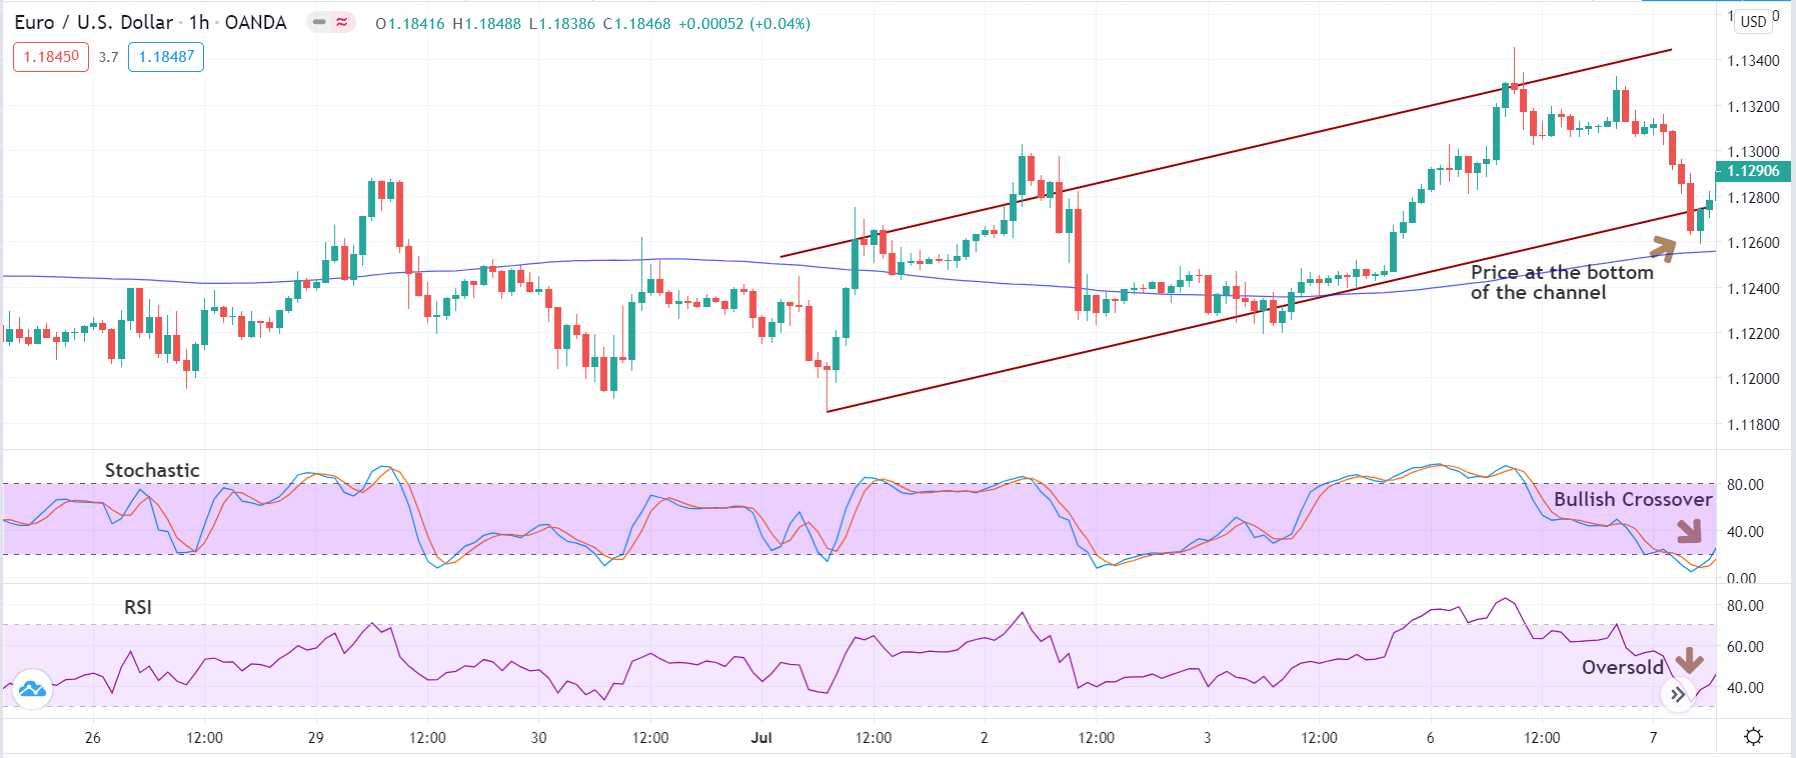
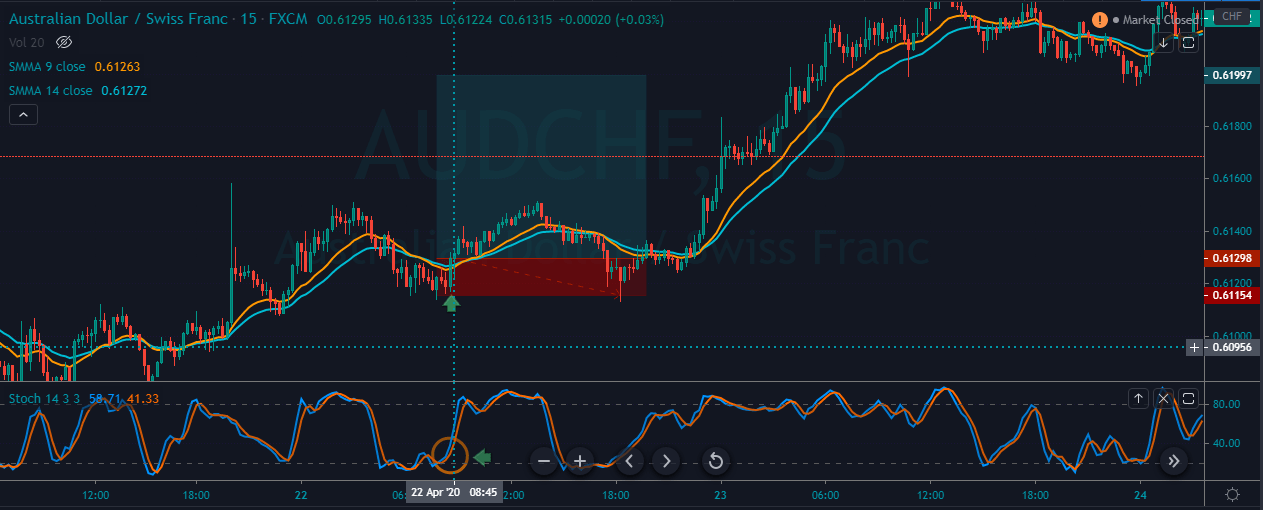
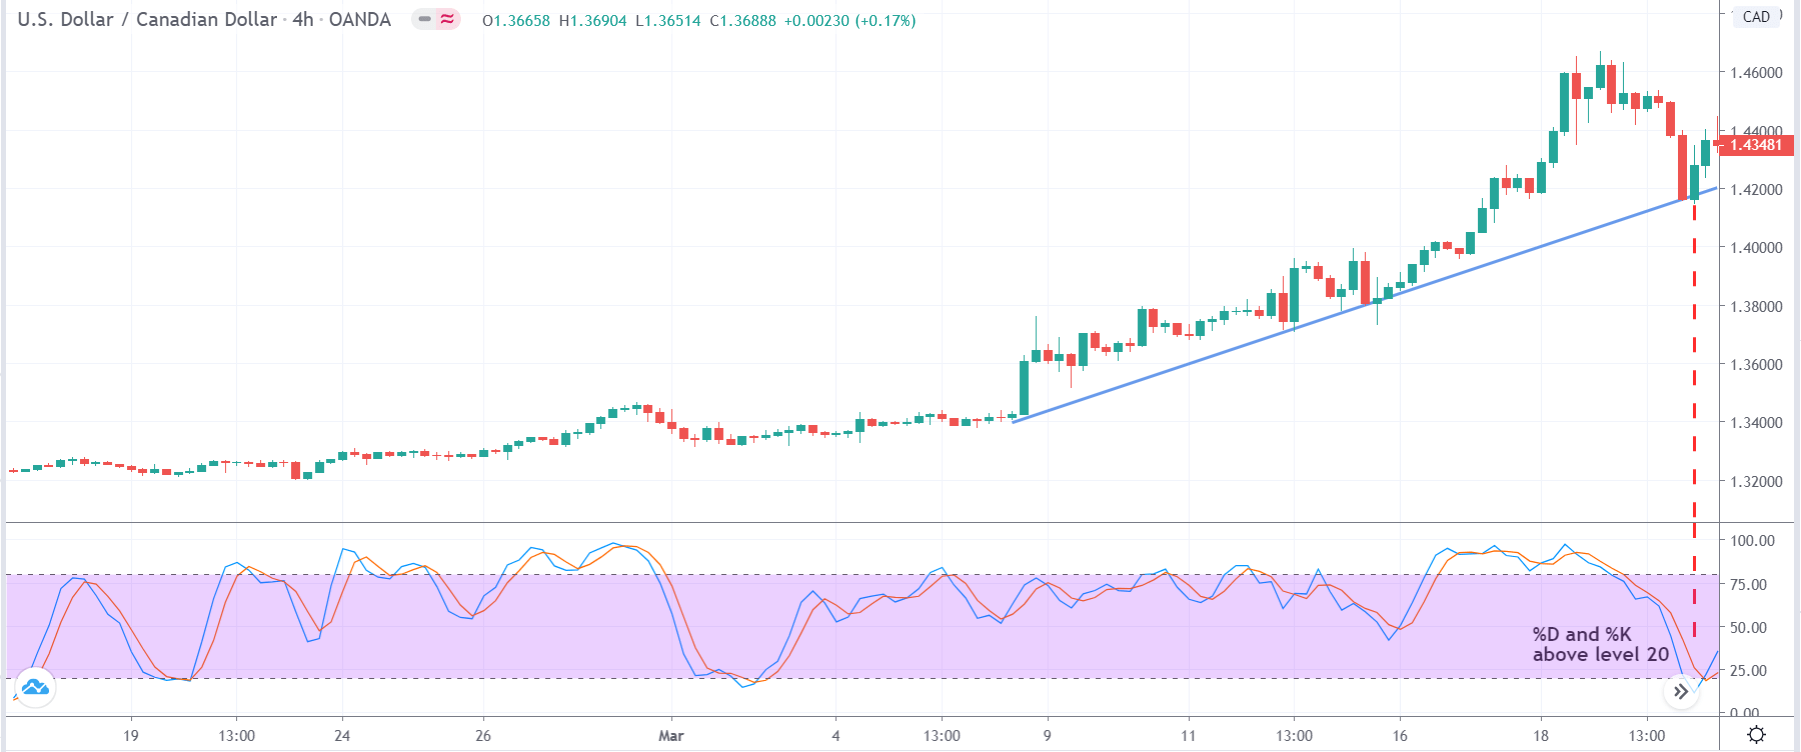
The next step is to look for a price retracement to a support area or an area close to the trendline. By doing so, we ensure that we are not chasing the market, which is crucial. Once we find such a retracement, observe the stochastic indicator’s position, and determine %K and %D level of the indicator.

We should look for price retracements where the %K and %D lines cross above the 20 levels indicating the market’s oversold condition. In a downtrend, the lines should cross below the 80 levels, indicating the market’s overbought condition.  The below image shows the crossing of both the lines above the 20 level exactly near the support, indicated by the red dotted line.

Step-3

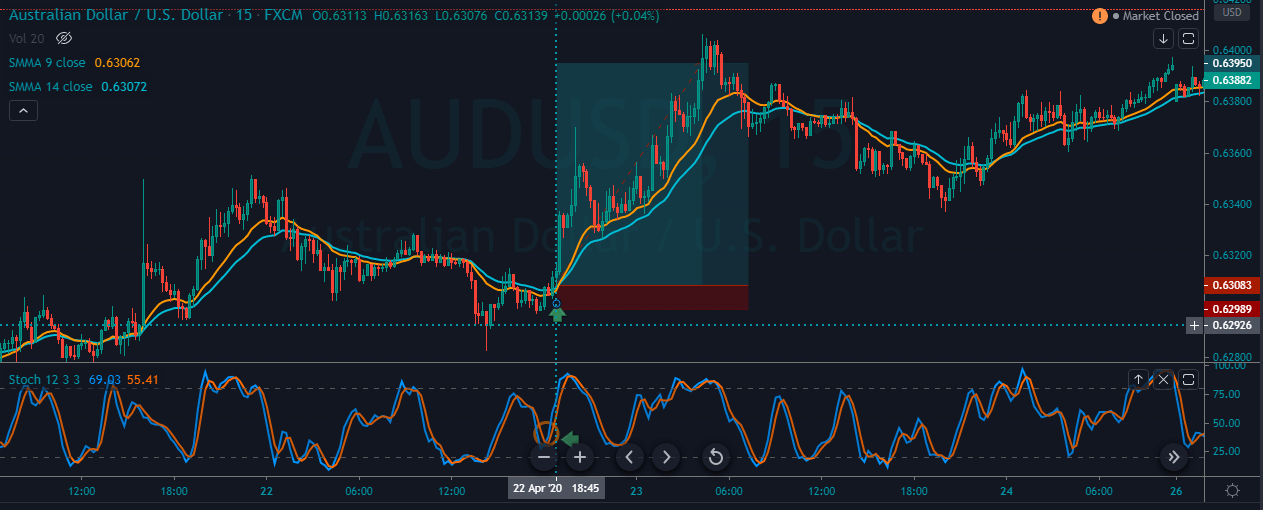
As the price starts moving higher after reacting from the support line and a rise in the oscillator, we take our entry expecting a higher high in the market. One can notice here that, we enter the market only after we get a confirmation and just based on indicator signal and price level. We can see below that we are executing our ‘long’ trade after confirmation from the market in the form of two green candles, indicated by the brown arrow mark.
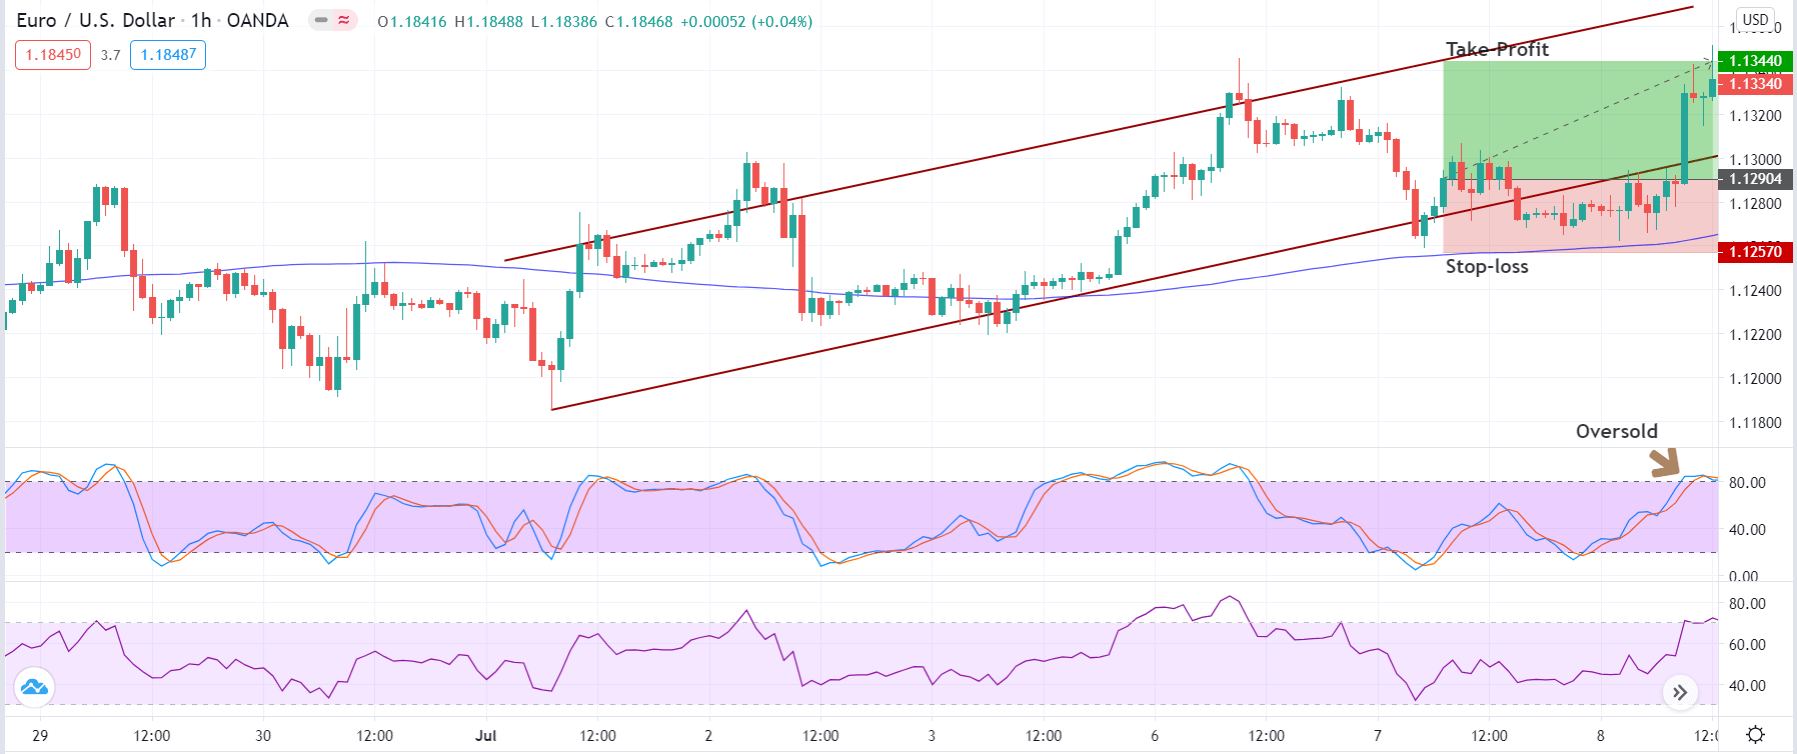
Step-4

In this step of the strategy, we determine our take-profit and stop loss. Basically, this strategy has three profit points and a single stop loss. We shall take 50% of our profits at the 50% mark of the range, 40% of the profit at 90% mark of the range and remaining profits at the new ‘high.’ The stop loss for this strategy is placed below the support, which would result in a 1:1 risk to reward ratio.

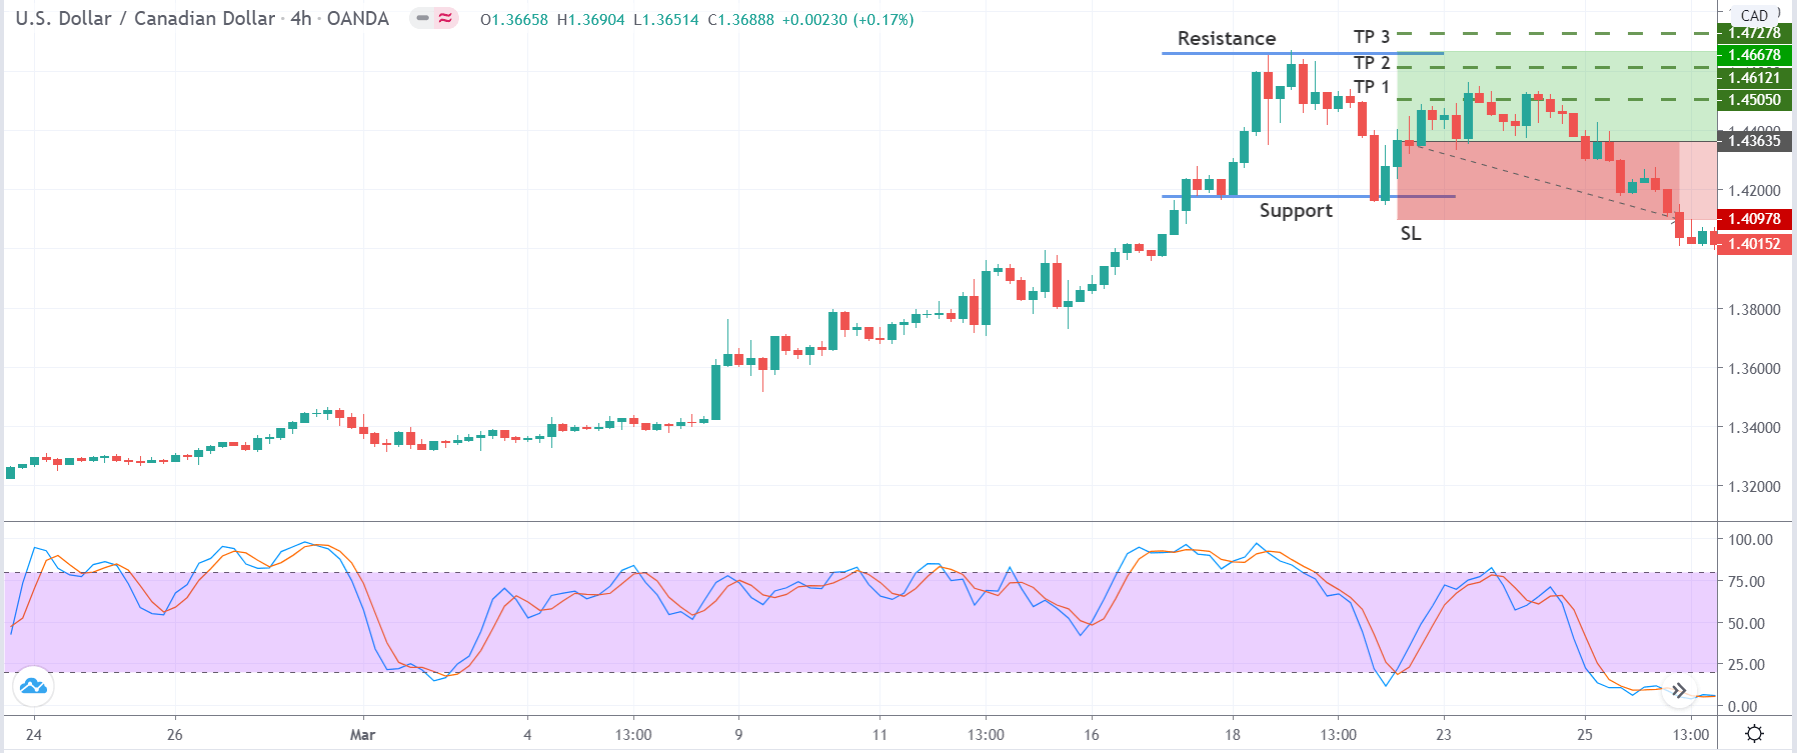
After looking at the below image, one might think that the trade does not hit our final ‘take-profit,’ but this is just one of many trades that does not result in a breakout. However, in most cases, the market makes a higher high and results in a fully profitable trade. The risk management part of the strategy ensures that even though the price does not hit reach our final target, we can still come out of the trade with no or minimum loss.

Strategy Roundup

This is an amazing strategy that allows us to take a range of trade in the early stages of its formation. Always determine the momentum of the market before looking for support and resistance levels. Giving importance to momentum will put ourselves in an advantageous position and prevents us from blindly trading just based on the signal given by stochastic indicator. Cheers!

Categories
Forex Basic Strategies

Restrict Your Losses To Only 10-Pips a Day With This Strategy

Introduction

Every trader loves the idea of winning on each trade they take. After all, winning is the sole purpose of trading. Various strategies in the market promise to offer profits every day, but none of them are good enough to make you win every single trade you take. In the end, almost all of the traders wish for a method that could reap them good profit every day. But as we all know, trading is less about making money and more about saving your capital. For this same purpose, we have created the 10 Pip Loss Strategy.

The strategy suggests that we must take two to three trades a day by placing only ten pips stop-loss and go for bigger targets. For instance, let’s consider that we took three trades in a single day. If we lose two trades and end up winning one, we will be losing only 20 pips, but the gains that are earned on the third trade can be more. By following this strategy, our primary focus should be on taking three potential trades in a day.

The Strategy – Pairing Double Moving Average & Stochastic Indicator

It is highly advisable to use this strategy in a strong trending market.

To Go Long (Buy Trades)

  • Firstly, identify an uptrend in any currency pair.
  • Apply the double moving average indicator to the price chart. Go with 9 and 14 periods.
  • Wait for the pullback to happen, and the price action must hold below the double moving average.
  • Look if the Stochastic is reversing at the oversold area.
  • Go long if all the above rules are met.
  • Place the stop-loss just ten pips below the entry. Take profit placement depends on the market state. If the buyer movement is strong, expect a brand new higher high; if the momentum is a slow, exit at the most recent higher high.

The image below represents our losing trade in the AUD/CHF forex pair. As you can see, both the indicators gave us a trading signal at around 08:45 AM. We activated our trade when the price of the asset is 0.6129. It went a bit up and suddenly dropped down to hit our stop loss. As a result, we ended up losing the trade.

The best thing is that we lost only ten pips. Hence, these smaller losses won’t influence our decision-making abilities.

The image below represents our winning trade in the AUD/NZD Forex pair. We took this trade on 22nd April at around 08:45 AM. When the moving average went below the price, the Stochastic gave a reversal at the oversold area, indicating us to go long in this pair. Right after we went long, the price action blasted to the north and printed a brand new higher high. We end up making 90 pips in this trade.

Overall, we lost ten pips till now, and hence we stand at 80 pips profit.

The below price chart represents our third trade on 22nd April. We took this trade at around 6:45 PM. Following our strategy, we made entry, and the price action has printed a brand new higher high. This trade gave us a profit of 80 pips.

To sum it up, we took three trades out of which we made 170+ pips profit and a loss of only ten pips. By following this strategy, we can make profits on every single trading day. Note: Use this strategy only when you see the potential of having at least three trades in a single day. Otherwise, there is no point in using this strategy.

To Go Short (Sell Trades)

  1. Firstly, identify a downtrend in any currency pair.
  2. Apply the double moving average indicator to the price chart. Go with 9 and 14 periods.
  3. Wait for the pullback to happen, and the price action must hold above the double moving average.
  4. Look if the Stochastic is reversing at the overbought area.
  5. Go short if all the above rules are met.
  6. Place the stop-loss just ten pips above the entry. Take profit placement depends on the market state. If the seller movement is strong, expect a brand new lower low; if the momentum is a slow, exit at the most recent lower low.

The image below represents a sell signal in the CHF/JPY Forex pair. This is the first trade we activated on 13th April at around 08:45 AM. Overall, the market was in a strong downtrend, and when it pulled back, both the indicators gave us a sell signal. After we went short, the price sharply goes down and prints a brand new lower low. This trade gave us 60+ pip profit.

We took the second trade relatively at the same time in the USD/JPY Forex pair. Overall, this pair was also in a strong downtrend, and we activated the trade when both the indicators gave us a sell signal. In this pair, the seller momentum was strong enough, and we ended up making 82+ pips. 

This is the third trade we took in the EUR/JPY Forex pair. When price action pulled back to the moving average, the Stochastic also gave us a reversal at the overbought area, indicating us to go short. By the time we have exited, we booked 64+ pips of profit.

In total, we took three trades, and all of them hit our take-profit. If you observe, even if we would have lost two trades and won only one, we would still have ended up on the winning side. In a strong trending market, it is easy to win all the trades we take. All you need to do is to follow the rules of the strategy very well. To sum it up, with minimum risk, we gained a profit of 206 pips from the market.

We hope you understood the strategy well. Please try and trade this strategy in a demo account before applying it to the live market. Cheers!