Categories
Forex Basic Strategies

How To Trade A Ranging Market

One of the toughest things to do in forex is to remain profitable, the thing that is even tougher than this is to remain profitable within a ranging market, some people absolutely love a ranging market while other people hate it, it can all come down to the strategy that you are using and also the type of trader that you are.

A ranging market is basically when the markets are going sideways, there are little movements up and down but it stays between a high and low price range, the unfortunate thing is that it is very easy to make mistakes during this type of market and a lot of traders do a lot damage to their accounts when the markets are in this sort of situation. This is far more preventable in traders who have learned to trade during a trend, either a bull or bear trend when the markets continue in an upwards or downwards direction.

Having said that it is a dangerous time to trade, there are certainly ways to trade within it, and it is still possible to make a profit within these ranging markets. In fact, some people are able to profit more from a ranging market than they can from a trending one, so we are going to e looking at different ways in which people can and do profit from a ranging market, trading in this sort of environment can be quite exciting, so let’s take a look at the ways that you can do it.

Support and Resistance

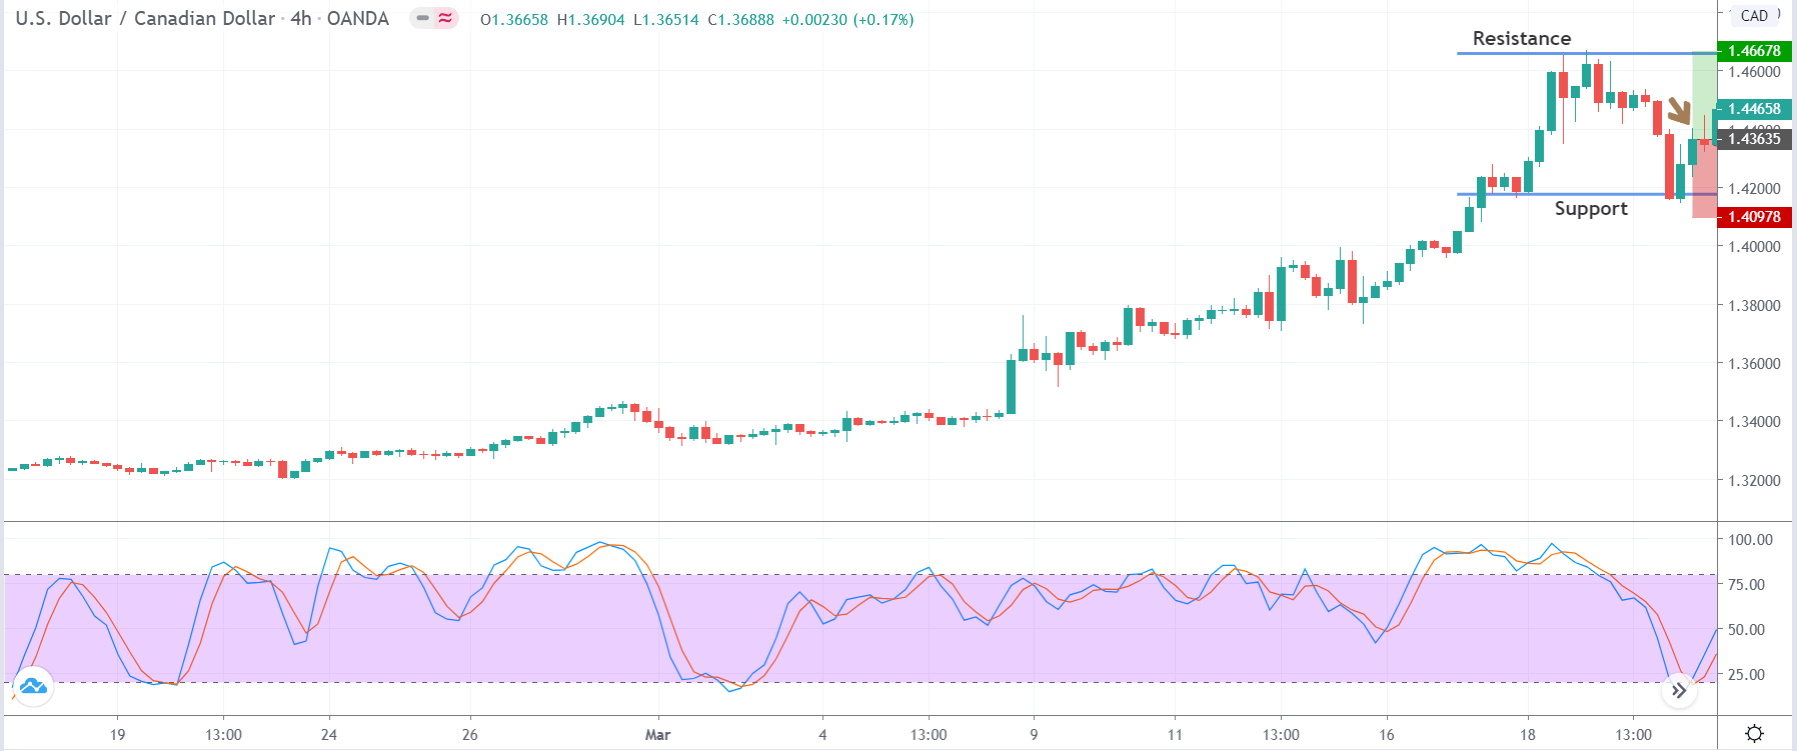
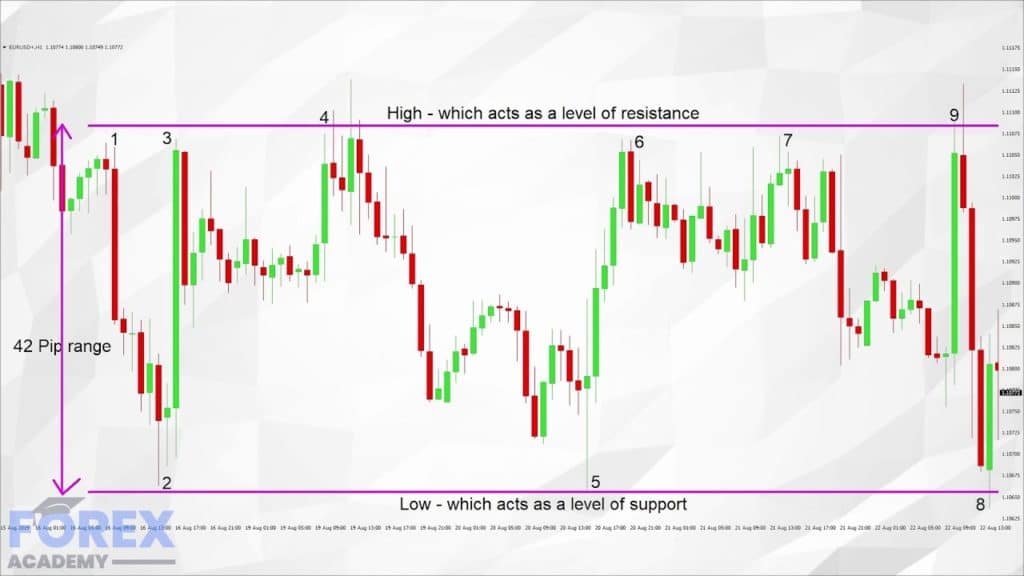
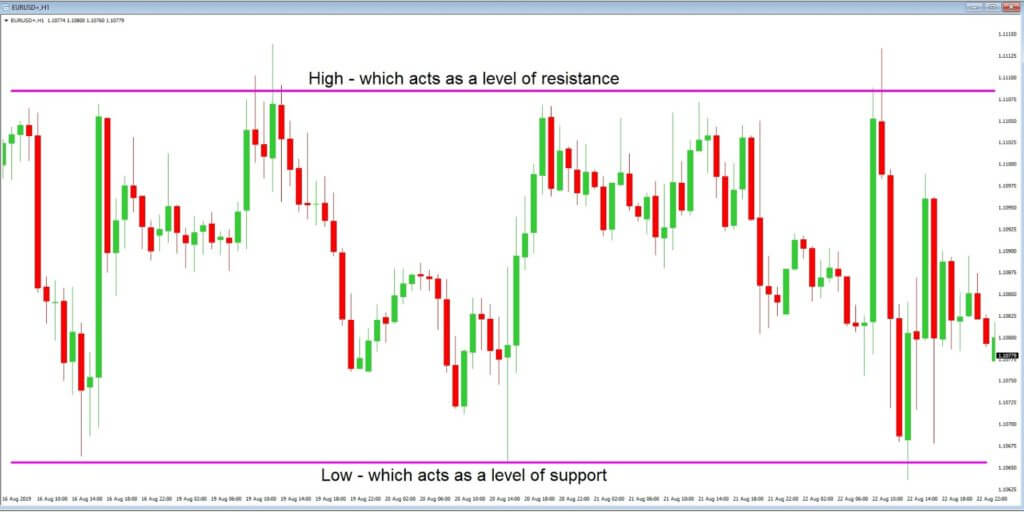
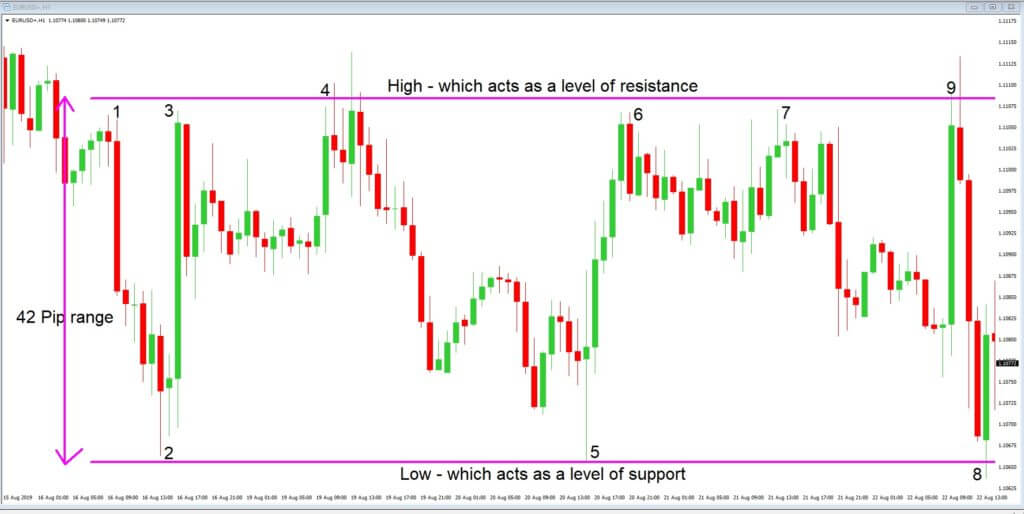
When you are thinking of trading in a ranging market. The first thing that you should be considering are the support and resistance levels that the market is currently adhering to, you may not actually be trading these levels but knowing where they are will give you a good idea of the current market conditions and how it is performing, it will also show you the potential levels that the markets could reach if the current ranging of the markets were to break.

The first thing that you need to do however is to identify that the markets are actually ranging, one of the main things to look for is that the sideways markets have quite a distance between the support and resistance levels. If the support and resistance levels are actually quite close together then this would be considered as a choppy market and they hold a lot more risk and so it may not actually be worth trading in this condition, so ensure that the support and resistance levels are a little further apart. Trading a choppy market has a form of gambling within it and will not have a very good risk to reward ratio level making it a dangerous time to trade.

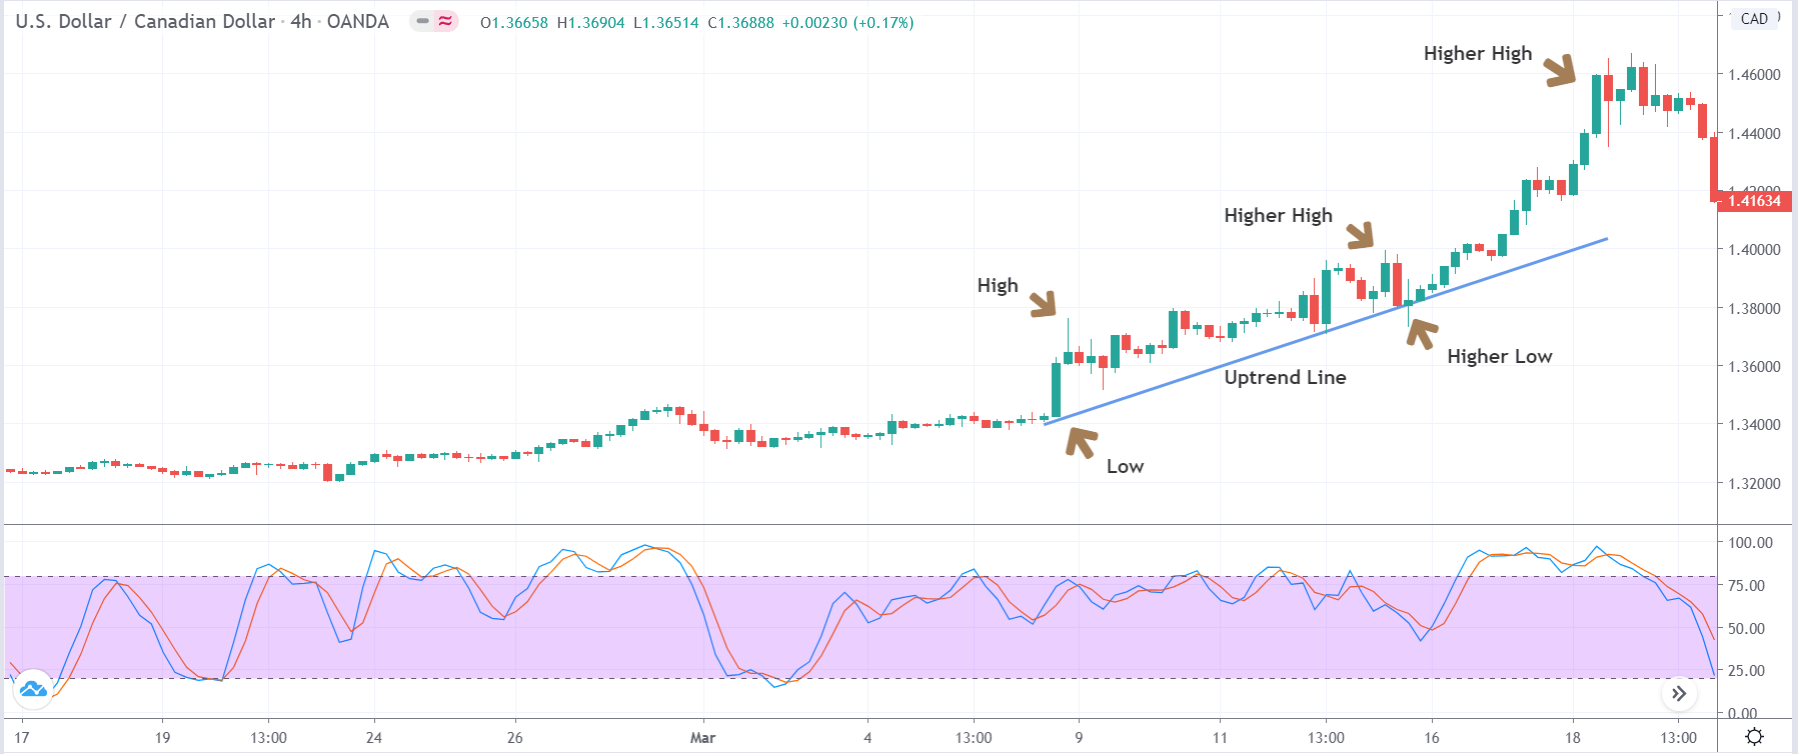
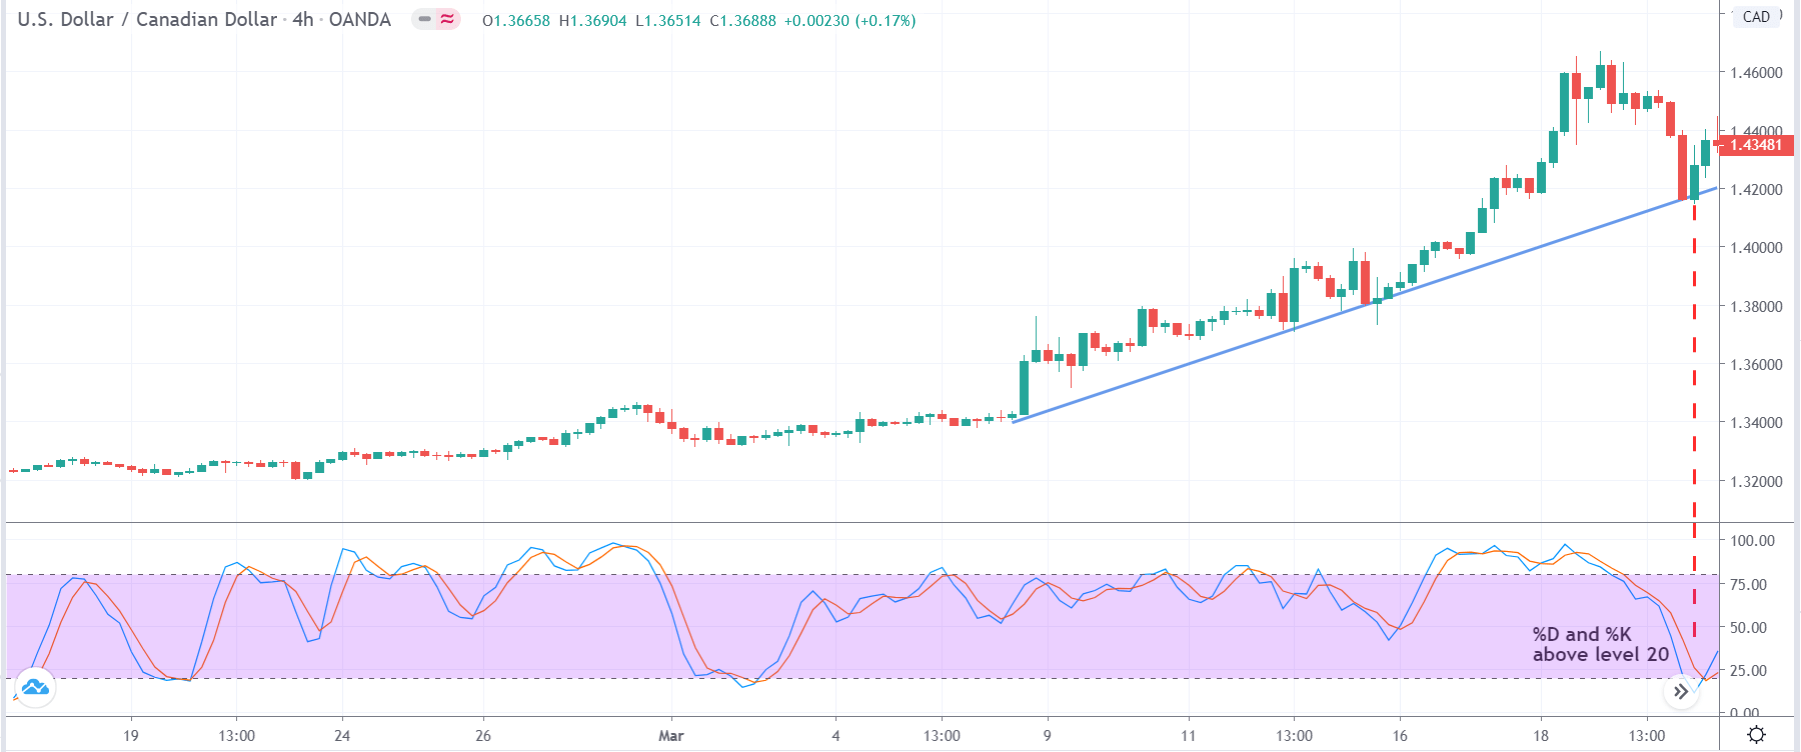
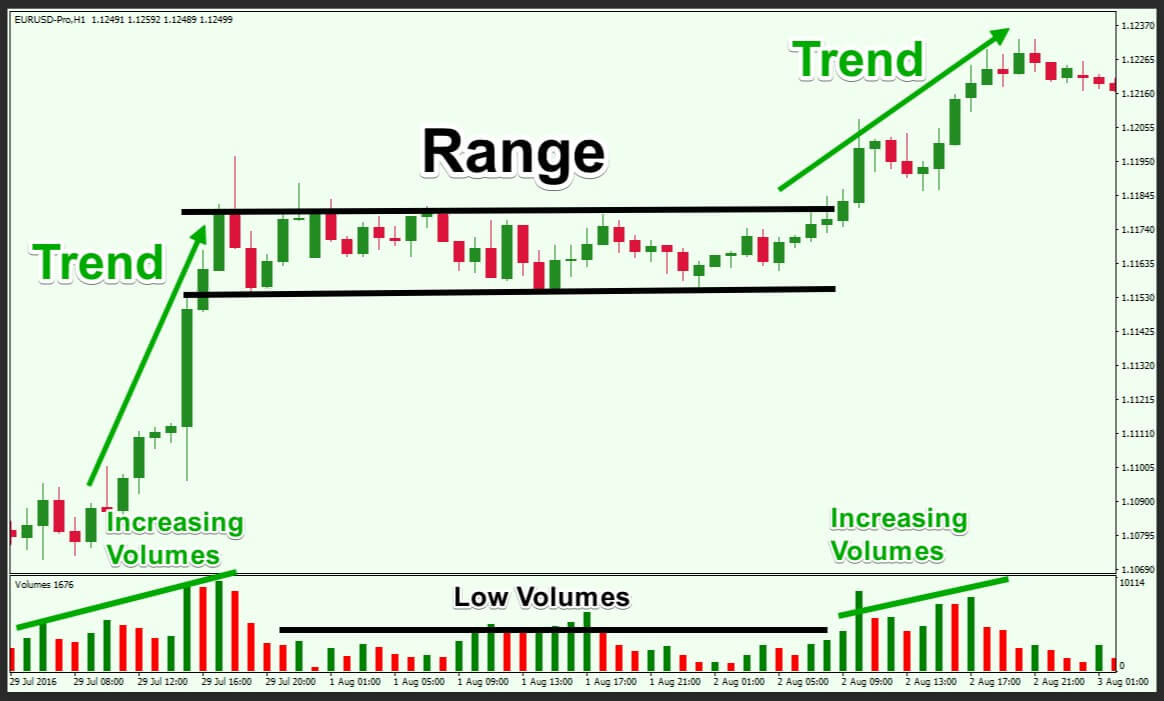
There are of course a few different types of ranging markets, these include a perfect range which is when the range reaches the support and resistance levels a number of times, the price will be going up and down in a very predictable pattern, when drawing out the support and resistance levels it should create a very clear rectangle. The next type of range is a ranging market with a pattern, this kind of range often appears to have some kind of direction, there may be a number of lower highs and lower lows which could be suggesting that an onward trend is forming, or the opposite for an upward trend emerging. The thirst type of the ranging market is a range without a pattern, this sort of ranging market is a little less predictable with the prices going up and down with no clear pattern or reason.

By being able to identify the type of ranging market that is occurring will allow you to make a much more informed decision when it comes to the sort of trades that you are going to put on. It would be far better and easier to make predictions in a market where there are patterns forming than it would in a completely random one. When ranging with a pattern can also indicate that the markets are going to potentially move into a trend and can give you an idea of the possible direction of that trend, you will want to avoid trading in choppy markets or a ranging market without a trend as this can be a much more dangerous market to be active in. A ranging market can also occur in the middle of a trend, so it is important that you manage to identify the overall trend direction too.

Trading Support and Resistance

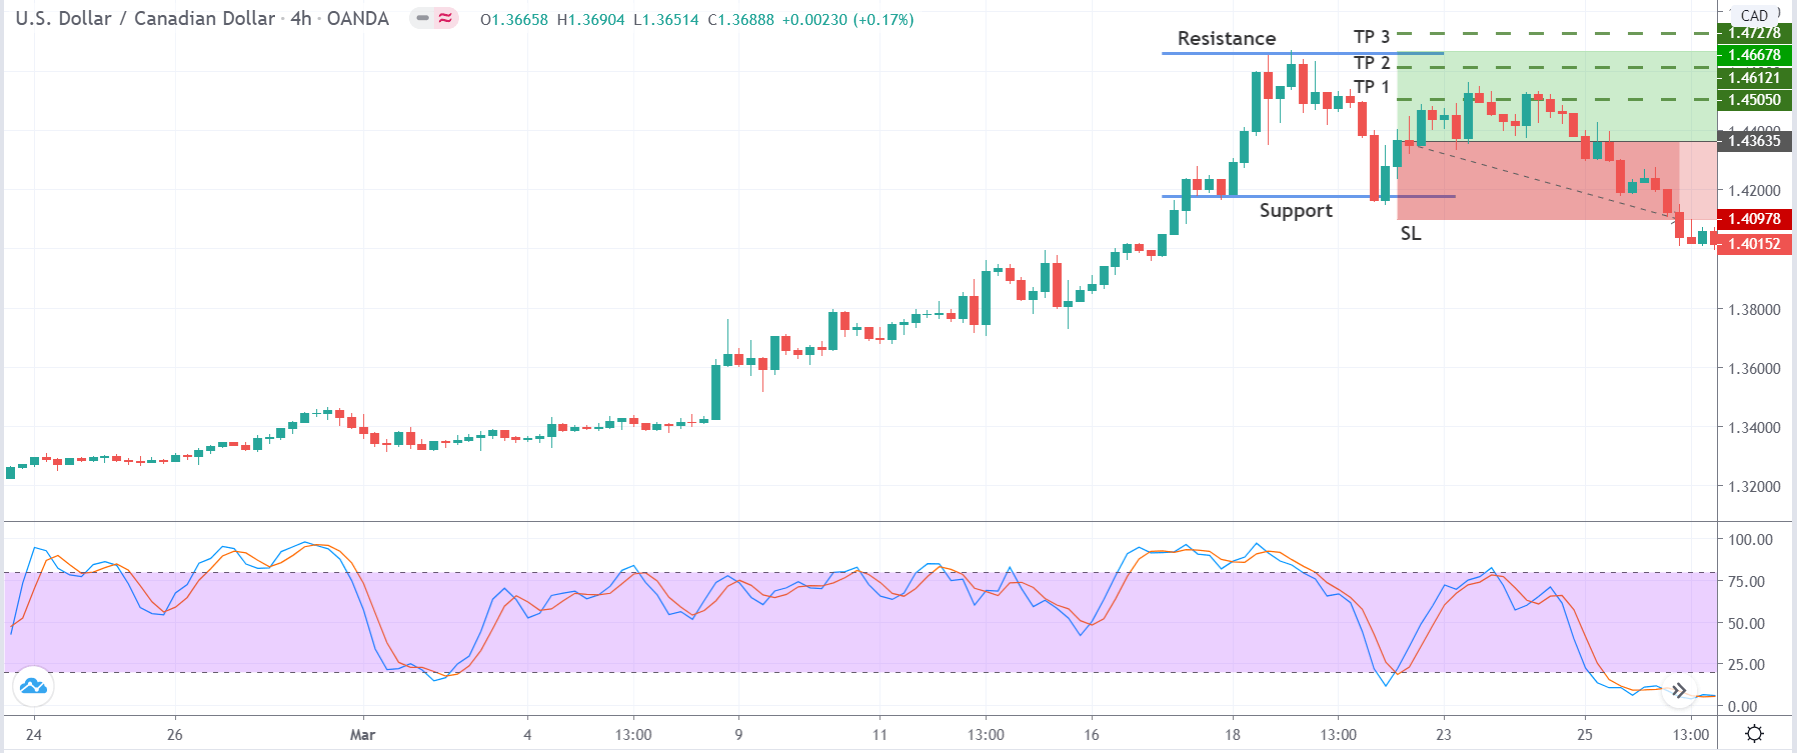
So let’s assume that you are going to be trading in these ranging markets, one of the most simple trading methods is simply to trade the support and resistance levels. So we have marked out our support and resistance levels, we then wait for the price to hit either the support or resistance level, when it hits the resistance level when we want to sell and when it hits the support level we want to buy. Some people suggest that you should only buy or sell once the levels have been breached rather than just hit, trading this method is very simple and is a safer option as there are fewer things that can go wrong. It is important to remember to put on your stop losses a little below or above the levels in order to help protect your account from a potential breakout.
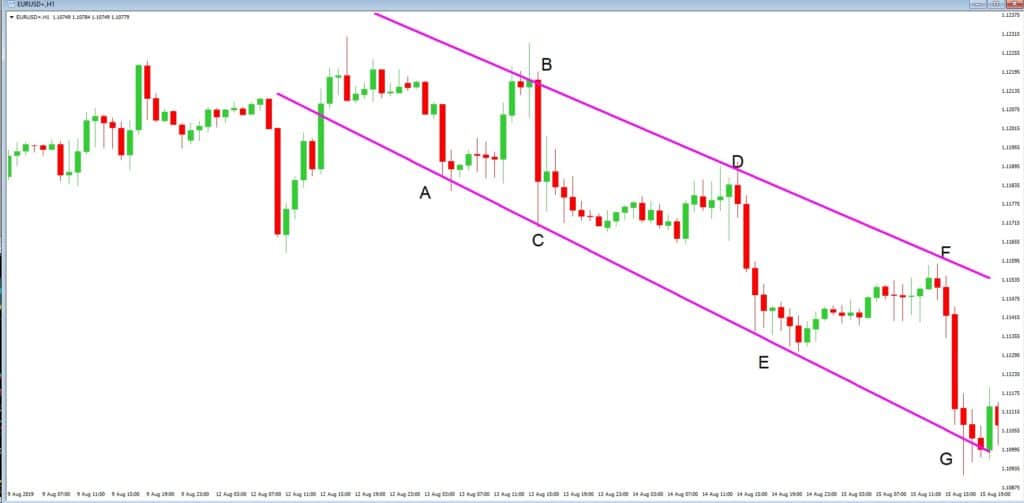
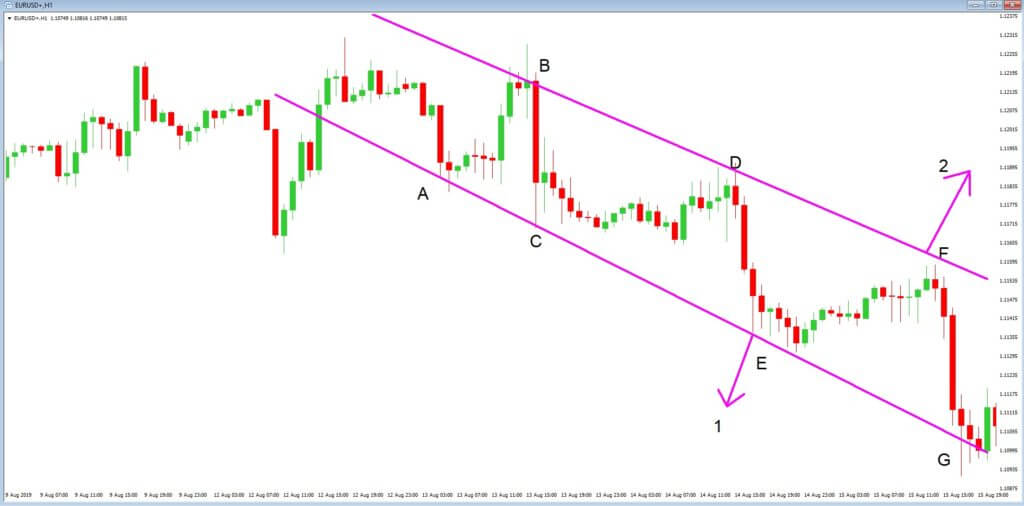
Channel Patterns

You can also trade with channel patterns, these are somewhat similar to trading with support and resistance levels in the way that it is a similar type of trading, we will just be setting our levels a little differently. Channel patterns are something that are offered and available on most charting software tools and packages, you can use them to make the highs and the lows of the markets. You will then work the same way, selling on the highs and buying on the lows, these sorts of patterns can also be used with a trending market and not just a ranging one.

Trading False Breakouts

False Breakouts, otherwise known as fakeouts, are another way of trading these ranging markets. The way that these are normally observed is by a pin bar candlestick that sticks out of the support or resistance levels. It is known as a false breakout due to the fact that instead of then breaking out the market will then continue back into its range. For those that trade breakouts this is a form of trap that can get them stung but for ranging markets they are pretty nice as they can present you with a great opportunity for a buy or a sell.

Bollinger Bands

Bollinger bands are often used to try and work out just how volatile the market share is, the top band will tell you how high the price has reached which the lower band will tell you how low it has been. If the bands are too close together then again this will indicate that the markets are choppy and so it may not be worth trading in this condition. If the bands are quite far apart this can also mean that you should not trade, due to the markets being a little too volatile. You can probably work out how to trade these bands, when the price reaches the lowest band you should buy and sell when it reaches the higher one. It is often a good idea to use Bollinger Bands in a pairing with another indicator such as support and resistance levels.

So those are some of the available trading patterns and systems that you can use in order to trade during ranging markets, it should be pointed out that this is not for everyone. If the markets that you are currently trading in are suddenly ranging, then try looking into new markets, just don’t go crazy and start trading exotic pairs that you have absolutely no idea about, they could be a little more volatile than what you are used to.

Of course, if you are a trend trader or a longer-term trader then it may be the best idea to simply not trade at all, the risk to reward ratio in this sort of trading is often a lot lower than you may be used to, you will be risking more for less, so if this is not the sort of trading you are used to or interested in then the best things for you to do may be to simply not trade at all. There is of course no harm in taking a little break from trading when there is nothing available for you to trade, do not try to force it in order to simply have something to do.

So to sum things up, when thinking about trading in a ranging market you should be looking for the support and resistance levels, you should be looking for patterns and you should be considering how volatile the markets are at the time of your trading. If things fall into place and you want to try it, start small and then build your trading up. It is a difficult time to trade but if you manage to get good at it, it will be another weapon in our trading arsenal and will allow you to trade and be profitable no matter what the trading conditions are like.

Categories
Forex Basic Strategies

Have You Tried This ‘Power Ranger’ Forex Trading Strategy?

Introduction

The forex market either trends or moves in a range. The last strategy was dedicated to trading the range. The strategy we will be discussing today is also based on trading the range. Range strategies are either pure price action based or a combination of both. Oscillators are one of those indicators that are commonly used in range strategies. This is because oscillators indicate a possible range that the price swings back and forth from.

Some common oscillators are the stochastic and relative strength index (RSI). It has been observed that identifying and trading ranges poses more challenges to traders than identifying trends. After all, ranges become evident only after it is formed.

To make things worse, when a range is formed, and one starts applying the range strategy, price action causes the market to break out or break down of a range again. The power range strategy tries to fill this gap. Let us look at how this can be done through the use of a powerful oscillator.

Time Frame

The power ranger strategy works well with the hourly (H1) or 4-hourly (H4) chart. This means each candle on the chart represents 1 hour or 4 hours of price movement. However, using the strategy on the 15 minutes time frame requires a lot of experience and practice. Hence, all new traders should use the strategy on the recommended time frame only.

Indicators 

We use the Stochastic indicator for this strategy with the following specifications.

%K period = 10 | %D period = 3 | Smooth = 3 | Levels = 20 and 80

The stochastic indicator is an oscillator that measures overbought and oversold conditions in the market.

Currency Pairs

The strategy is suitable for all currency pairs listed on the broker’s platform. However, it is advised to deploy the strategy on major currency pairs as patterns clearly show in these currency pairs. One should avoid trading in exotic or illiquid pairs as apart from unclear patterns, there are other problems associated with trading such pairs.

Strategy Concept

The strategy is based on the concept that the market will form a range after a trend. We use the stochastic indicator to give us an indication of a possible range formation. The current market momentum will tell us if we will go ‘long’ or ‘short’ in the market. If the market moves in an uptrend, we look for buy opportunities in the range where the entry will be determined by the stochastic indicator’s oversold region.

If the market is moving in a downtrend, we look to go short in the range. In this case, the entry is determined by the overbought region of the stochastic. We use the most recent high and low to determine the possible resistance and support of the range. Two of the ‘take-profit’ levels are located within the range, and the third one is located beyond the range in anticipation of a breakout.

Trade Setup

To illustrate the strategy, we shall consider the USD/CAD currency pair and find an appropriate trade using the strategy. Here are the steps to follow to execute the power ranger strategy.

Step-1

The first step is to find a trending market. By trending market, we mean, to look for higher highs and higher lows in case of an uptrend and lower lows and lower highs in a downtrend. Plot a trend line that connects these lows and highs, so that the trend looks eminent. This is the simplest step of the strategy. The below image shows an uptrend visible on the 4-hour time frame chart of the currency pair. Let us understand the further steps of the strategy.

Step-2

The next step is to look for a price retracement to a support area or an area close to the trendline. By doing so, we ensure that we are not chasing the market, which is crucial. Once we find such a retracement, observe the stochastic indicator’s position, and determine %K and %D level of the indicator.

We should look for price retracements where the %K and %D lines cross above the 20 levels indicating the market’s oversold condition. In a downtrend, the lines should cross below the 80 levels, indicating the market’s overbought condition.  The below image shows the crossing of both the lines above the 20 level exactly near the support, indicated by the red dotted line.

Step-3

As the price starts moving higher after reacting from the support line and a rise in the oscillator, we take our entry expecting a higher high in the market. One can notice here that, we enter the market only after we get a confirmation and just based on indicator signal and price level. We can see below that we are executing our ‘long’ trade after confirmation from the market in the form of two green candles, indicated by the brown arrow mark.

Step-4

In this step of the strategy, we determine our take-profit and stop loss. Basically, this strategy has three profit points and a single stop loss. We shall take 50% of our profits at the 50% mark of the range, 40% of the profit at 90% mark of the range and remaining profits at the new ‘high.’ The stop loss for this strategy is placed below the support, which would result in a 1:1 risk to reward ratio.

After looking at the below image, one might think that the trade does not hit our final ‘take-profit,’ but this is just one of many trades that does not result in a breakout. However, in most cases, the market makes a higher high and results in a fully profitable trade. The risk management part of the strategy ensures that even though the price does not hit reach our final target, we can still come out of the trade with no or minimum loss.

Strategy Roundup

This is an amazing strategy that allows us to take a range of trade in the early stages of its formation. Always determine the momentum of the market before looking for support and resistance levels. Giving importance to momentum will put ourselves in an advantageous position and prevents us from blindly trading just based on the signal given by stochastic indicator. Cheers!

Categories
Forex Videos

How To Trade Ranging Markets – Maximise Your Forex Profits


Trading Ranging Markets

A range-bound market is one in which price action bounces between a specific high and a specific low on a technical chart. The high acts as a major resistance level and which is defined by at least two attempts to breach a certain exchange rate, and where this has failed and then price action goes on to fail during subsequent attempts.

The opposite applies to a specific low, which acts as a level of support, and whereby at least two attempts have been made to breach this level and where both attempts have failed, and where subsequent attempts have also failed. Price action then continues to range between such highs and lows.

Example A


Example A is a 1-hour chart of the EURUSD pair between 16th to the 22 August 2019 and where price action, as denoted by our red and green candlesticks, bounces between the two levels of support and resistance.

Example B

In example B, we have added eight positions of interest to traders and where price action came very close to our support and resistance levels on five occasions and where the levels were temporarily breached on three occasions at positions 4, 8, and 9, only to be reversed shortly after.

The price action range is approximately 42 pips from the high to the low. The consecutive amount of pips that could have been gained by selling and buying between the high and low equals 245 pips. This is a considerable amount.
This is a classic example of a range-bound – or sideways trading – market during this 6-day trading period. Traders are always looking to reduce risks from their trade setups, and therefore it makes sense to try and establish range-bound markets, because these offer an extra layer of security due to the support and resistance lines which, when established, act as an extra visual layer of comfort.

These levels of support and resistance usually occur after a large price action move and where the price is effectively consolidating because traders have no real ideas as to the future direction of the exchange rate of a particular currency pair. This can also happen between periods of economic data releases, or, while traders wait for events such as interest rate decisions, or forward guidance on monetary policy to be announced by the respective governments.
Another thing to consider is that the Forex market never trades in a linear fashion, that is to say, that it does not move in straight lines. Market performance usually coincides with current daily news events and where this causes volatility and change in price action, which leads to short price action shocks. And where these moves typically spend a lot of time retracing, and this is usually due to traders considering price action to be overbought or oversold within the various timeframes.
Markets do not necessarily range in a horizontal fashion; they can also range in upwards or downwards trends as well.

Example C

Example C is a one hour time frame of the EURUSD pair, and after a difficult to decipher price action movement to the left of the image, at position A and B we have the beginnings of a downward range, or trend, that would have offered up to 200 pips to traders who spotted the opportunity.

Example D

In example D, a range-bound price action is confirmed, and levels of support and resistance are identified at position A, B, C, and D, and therefore should price action continues below the support line at position 1 – where we might have bought the pair, or higher than our resistance line at position 2, where we might have gone short, we would then have confirmation that the trend had finished. However, because we have placed our trend lines on the chart, we can place tight stop losses a few pips above or below our lines in order to reduce risk.
And so, if you are looking to trade range bound markets, make sure that your time frame has established at least two attempts of support and resistance and then pick your moment carefully to buy from support levels and sell from areas of resistance.

Always be mindful that range-bound price action does not go on forever, traders will be sitting on the sidelines waiting for the price to breach support and resistance areas and where extra volatility can creep into the market while traders trade away from them.