Introduction
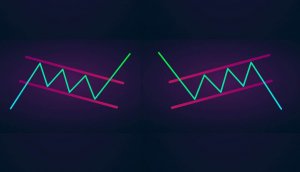
The forex market either trends or moves in a range. The last strategy was dedicated to trading the range. The strategy we will be discussing today is also based on trading the range. Range strategies are either pure price action based or a combination of both. Oscillators are one of those indicators that are commonly used in range strategies. This is because oscillators indicate a possible range that the price swings back and forth from.
Some common oscillators are the stochastic and relative strength index (RSI). It has been observed that identifying and trading ranges poses more challenges to traders than identifying trends. After all, ranges become evident only after it is formed.
To make things worse, when a range is formed, and one starts applying the range strategy, price action causes the market to break out or break down of a range again. The power range strategy tries to fill this gap. Let us look at how this can be done through the use of a powerful oscillator.
Time Frame
The power ranger strategy works well with the hourly (H1) or 4-hourly (H4) chart. This means each candle on the chart represents 1 hour or 4 hours of price movement. However, using the strategy on the 15 minutes time frame requires a lot of experience and practice. Hence, all new traders should use the strategy on the recommended time frame only.
Indicators
We use the Stochastic indicator for this strategy with the following specifications.
%K period = 10 | %D period = 3 | Smooth = 3 | Levels = 20 and 80
The stochastic indicator is an oscillator that measures overbought and oversold conditions in the market.
Currency Pairs
The strategy is suitable for all currency pairs listed on the broker’s platform. However, it is advised to deploy the strategy on major currency pairs as patterns clearly show in these currency pairs. One should avoid trading in exotic or illiquid pairs as apart from unclear patterns, there are other problems associated with trading such pairs.
Strategy Concept
The strategy is based on the concept that the market will form a range after a trend. We use the stochastic indicator to give us an indication of a possible range formation. The current market momentum will tell us if we will go ‘long’ or ‘short’ in the market. If the market moves in an uptrend, we look for buy opportunities in the range where the entry will be determined by the stochastic indicator’s oversold region.
If the market is moving in a downtrend, we look to go short in the range. In this case, the entry is determined by the overbought region of the stochastic. We use the most recent high and low to determine the possible resistance and support of the range. Two of the ‘take-profit’ levels are located within the range, and the third one is located beyond the range in anticipation of a breakout.
Trade Setup
To illustrate the strategy, we shall consider the USD/CAD currency pair and find an appropriate trade using the strategy. Here are the steps to follow to execute the power ranger strategy.
Step-1
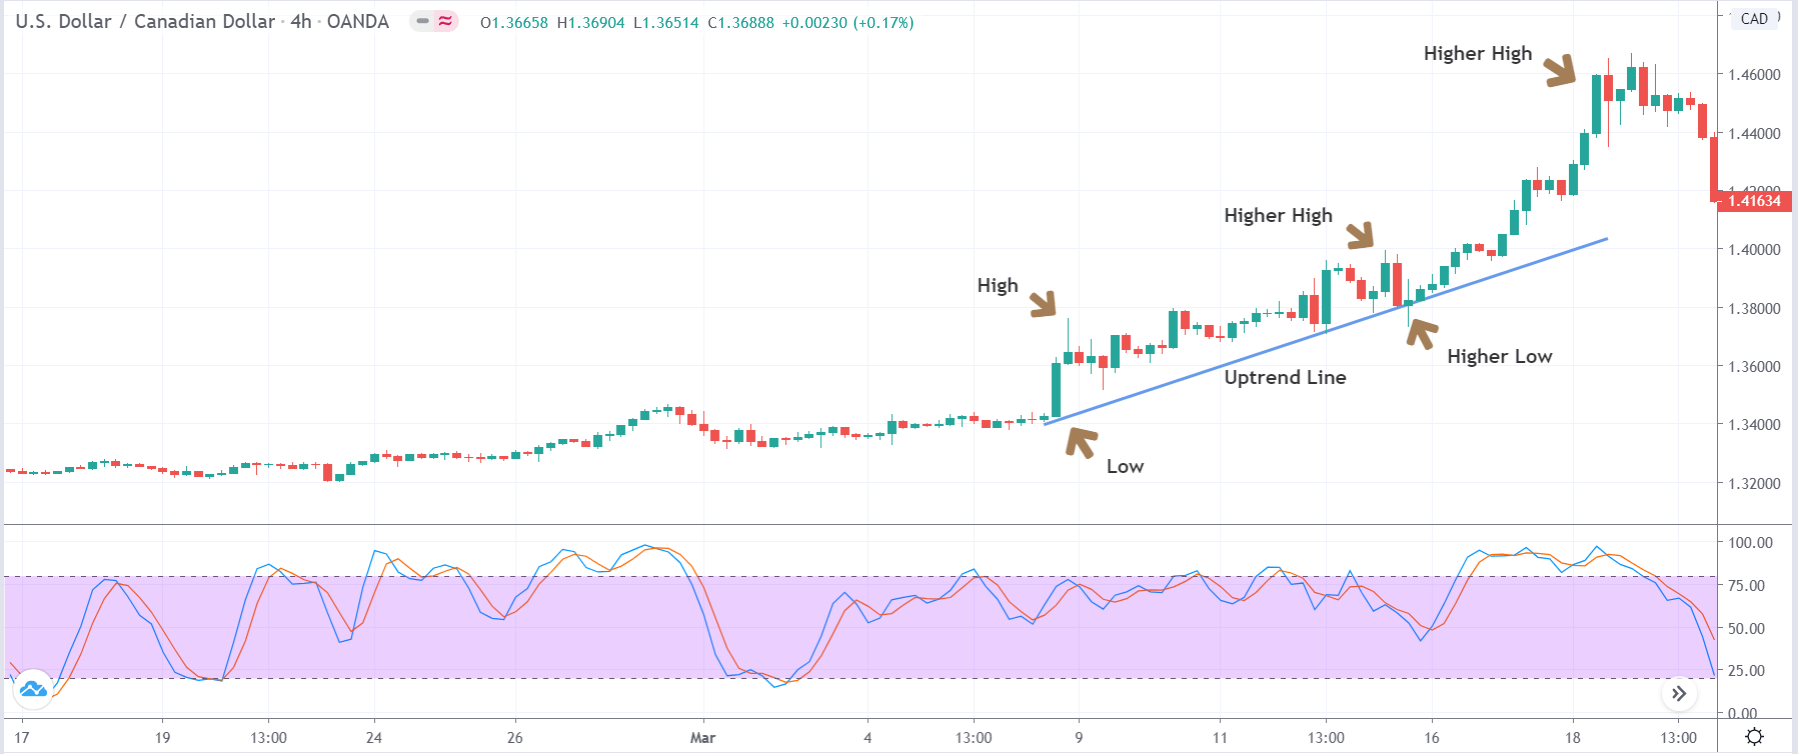
The first step is to find a trending market. By trending market, we mean, to look for higher highs and higher lows in case of an uptrend and lower lows and lower highs in a downtrend. Plot a trend line that connects these lows and highs, so that the trend looks eminent. This is the simplest step of the strategy. The below image shows an uptrend visible on the 4-hour time frame chart of the currency pair. Let us understand the further steps of the strategy.
Step-2
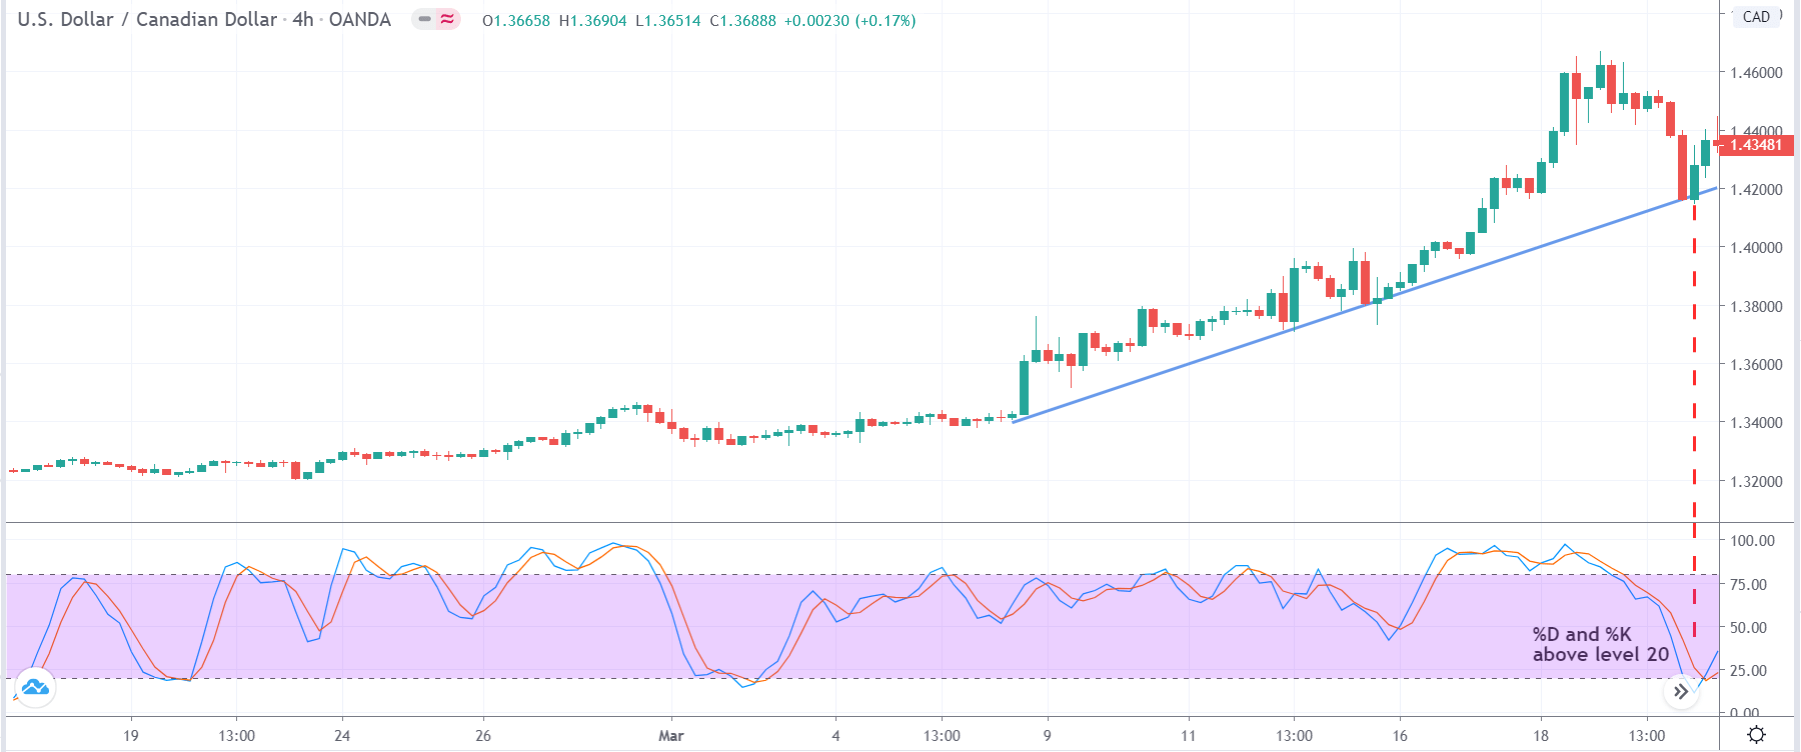
The next step is to look for a price retracement to a support area or an area close to the trendline. By doing so, we ensure that we are not chasing the market, which is crucial. Once we find such a retracement, observe the stochastic indicator’s position, and determine %K and %D level of the indicator.
We should look for price retracements where the %K and %D lines cross above the 20 levels indicating the market’s oversold condition. In a downtrend, the lines should cross below the 80 levels, indicating the market’s overbought condition. The below image shows the crossing of both the lines above the 20 level exactly near the support, indicated by the red dotted line.
Step-3
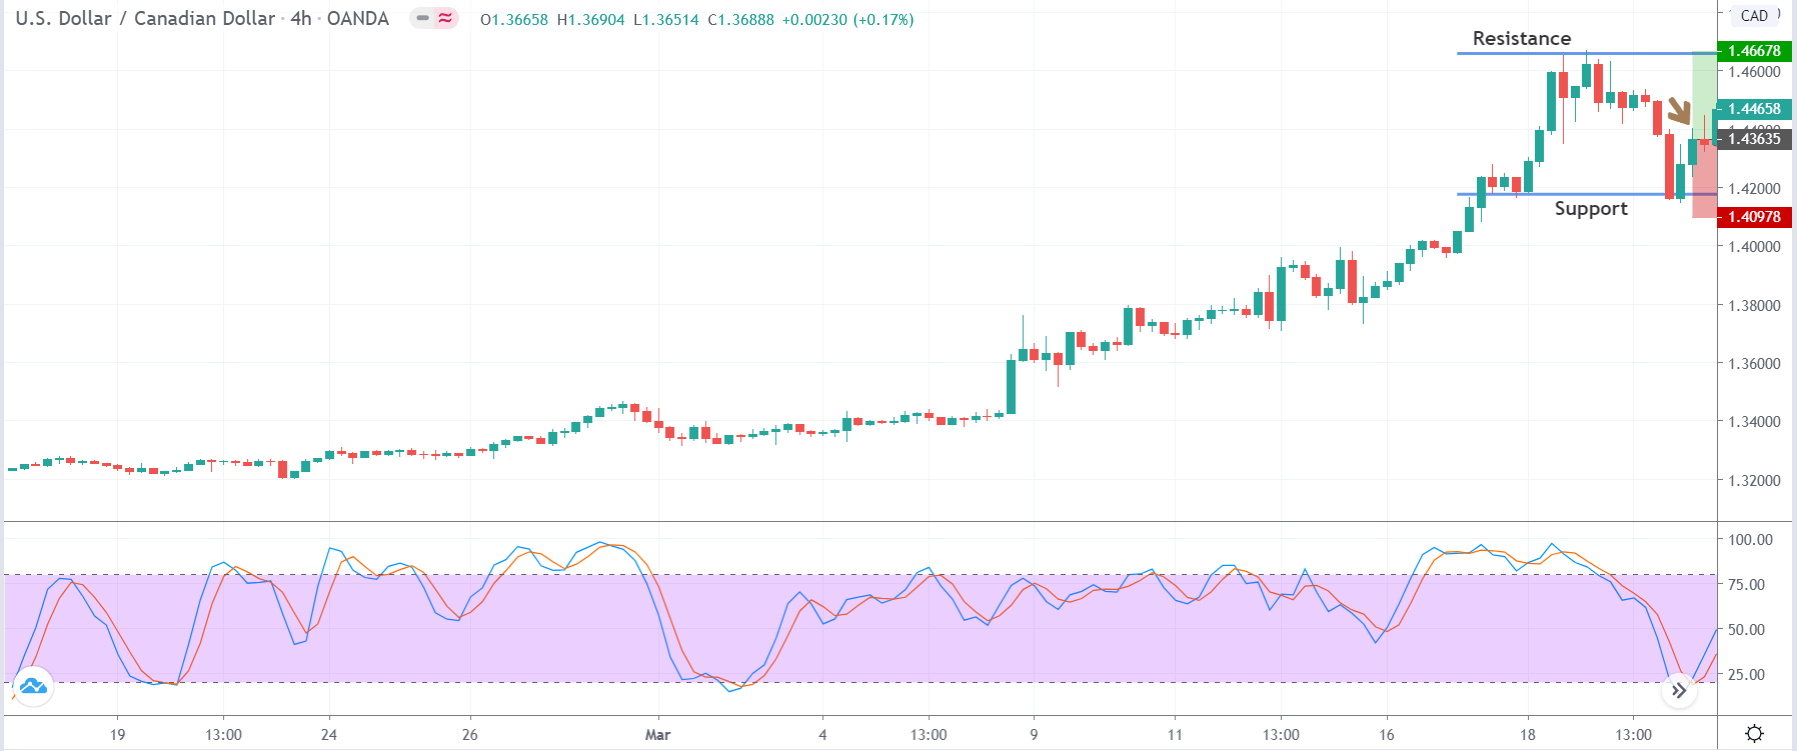
As the price starts moving higher after reacting from the support line and a rise in the oscillator, we take our entry expecting a higher high in the market. One can notice here that, we enter the market only after we get a confirmation and just based on indicator signal and price level. We can see below that we are executing our ‘long’ trade after confirmation from the market in the form of two green candles, indicated by the brown arrow mark.
Step-4
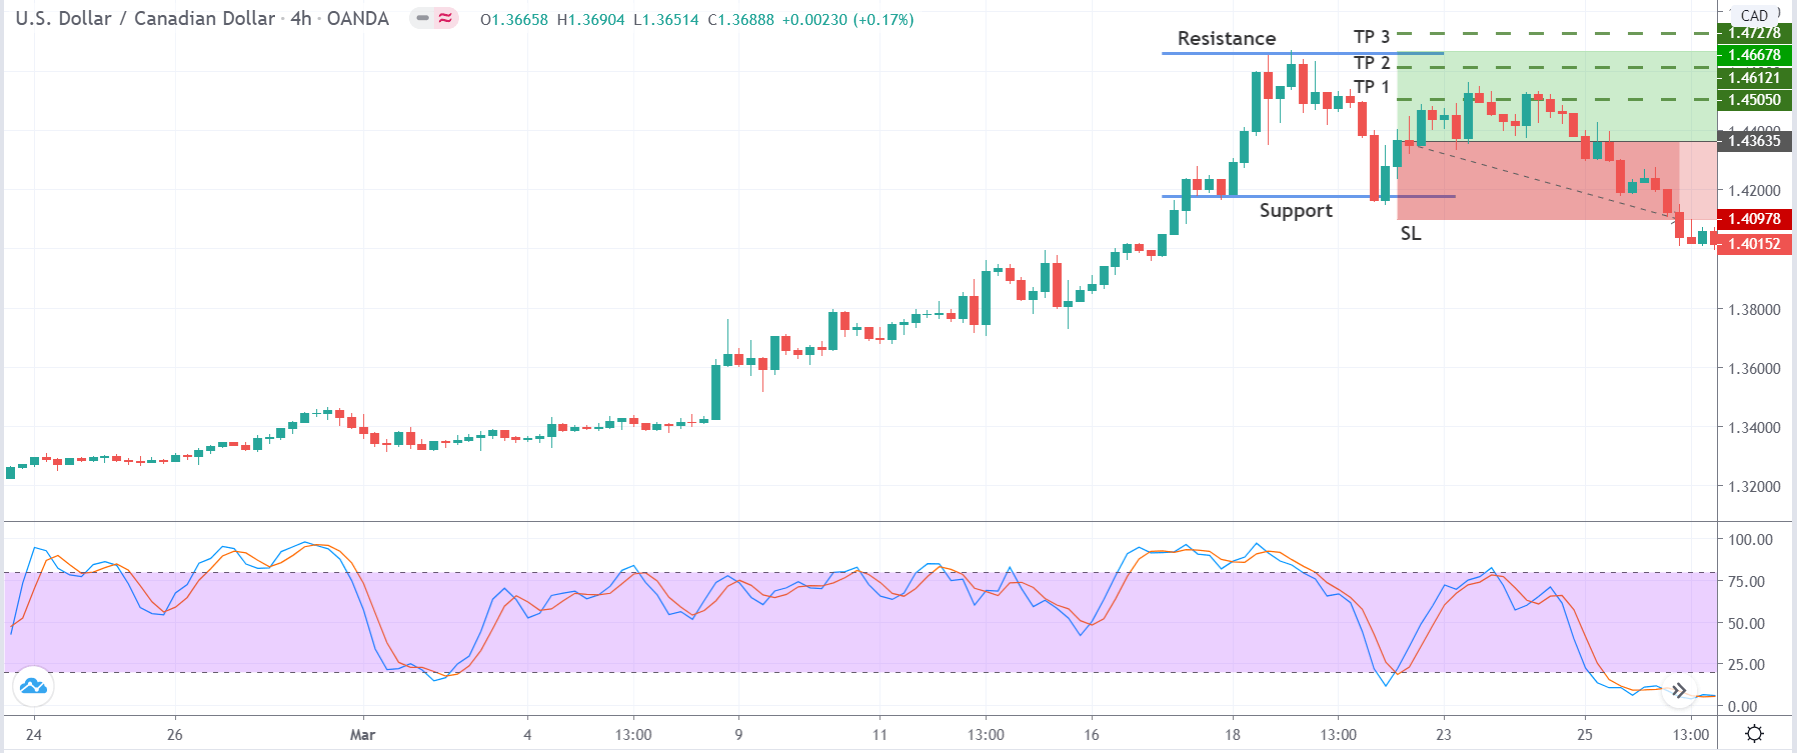
In this step of the strategy, we determine our take-profit and stop loss. Basically, this strategy has three profit points and a single stop loss. We shall take 50% of our profits at the 50% mark of the range, 40% of the profit at 90% mark of the range and remaining profits at the new ‘high.’ The stop loss for this strategy is placed below the support, which would result in a 1:1 risk to reward ratio.
After looking at the below image, one might think that the trade does not hit our final ‘take-profit,’ but this is just one of many trades that does not result in a breakout. However, in most cases, the market makes a higher high and results in a fully profitable trade. The risk management part of the strategy ensures that even though the price does not hit reach our final target, we can still come out of the trade with no or minimum loss.
Strategy Roundup
This is an amazing strategy that allows us to take a range of trade in the early stages of its formation. Always determine the momentum of the market before looking for support and resistance levels. Giving importance to momentum will put ourselves in an advantageous position and prevents us from blindly trading just based on the signal given by stochastic indicator. Cheers!


