Trading Ranging Markets
A range-bound market is one in which price action bounces between a specific high and a specific low on a technical chart. The high acts as a major resistance level and which is defined by at least two attempts to breach a certain exchange rate, and where this has failed and then price action goes on to fail during subsequent attempts.
The opposite applies to a specific low, which acts as a level of support, and whereby at least two attempts have been made to breach this level and where both attempts have failed, and where subsequent attempts have also failed. Price action then continues to range between such highs and lows.
Example A
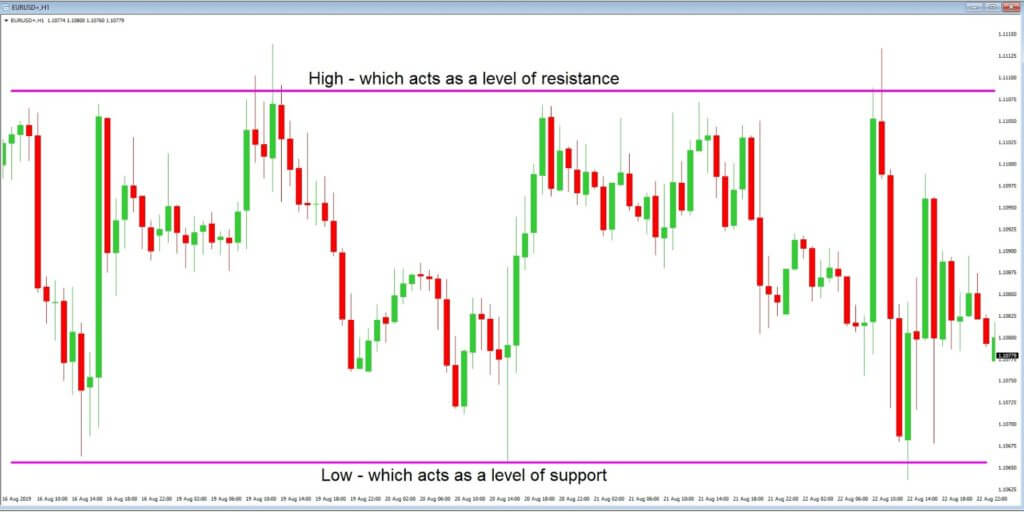
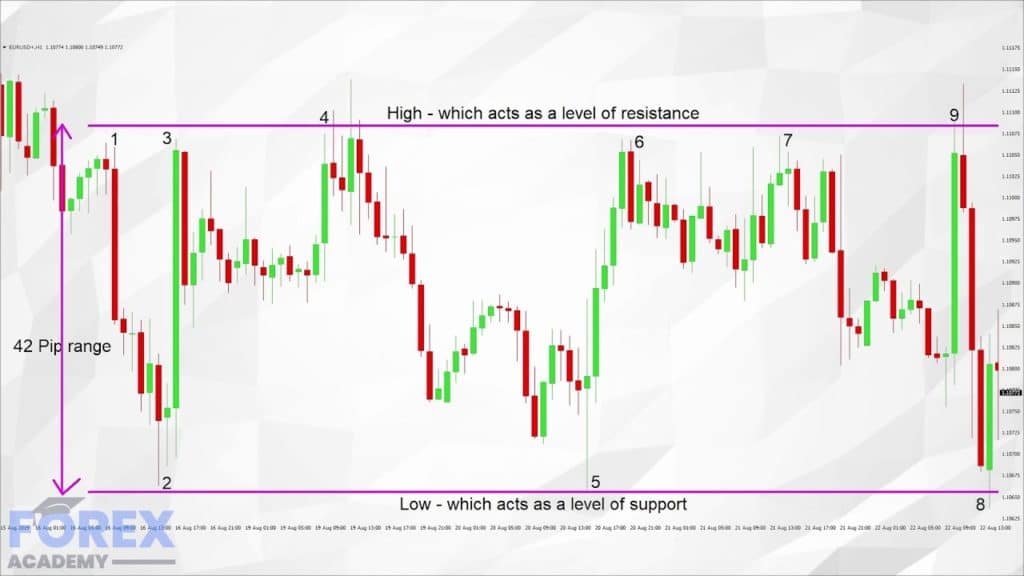
Example A is a 1-hour chart of the EURUSD pair between 16th to the 22 August 2019 and where price action, as denoted by our red and green candlesticks, bounces between the two levels of support and resistance.
Example B
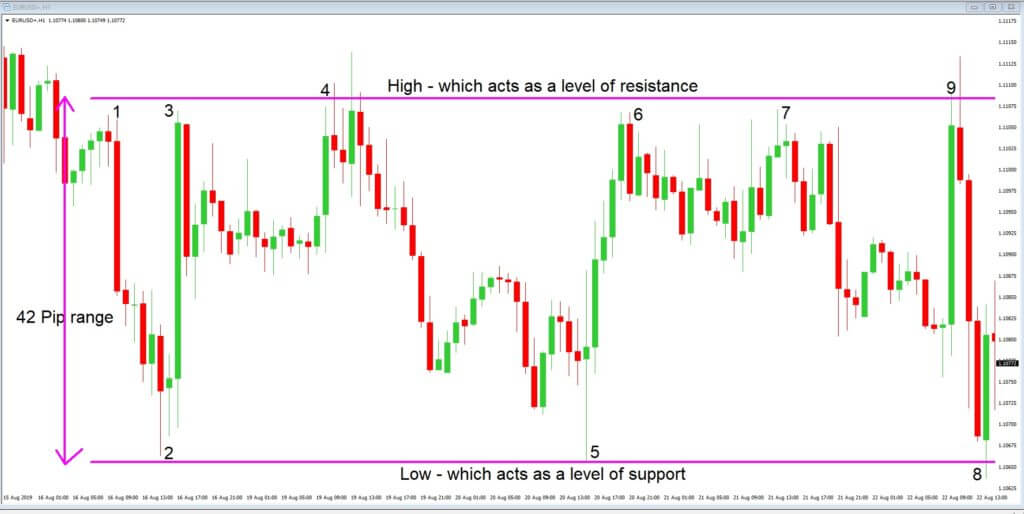
In example B, we have added eight positions of interest to traders and where price action came very close to our support and resistance levels on five occasions and where the levels were temporarily breached on three occasions at positions 4, 8, and 9, only to be reversed shortly after.
The price action range is approximately 42 pips from the high to the low. The consecutive amount of pips that could have been gained by selling and buying between the high and low equals 245 pips. This is a considerable amount.
This is a classic example of a range-bound – or sideways trading – market during this 6-day trading period. Traders are always looking to reduce risks from their trade setups, and therefore it makes sense to try and establish range-bound markets, because these offer an extra layer of security due to the support and resistance lines which, when established, act as an extra visual layer of comfort.
These levels of support and resistance usually occur after a large price action move and where the price is effectively consolidating because traders have no real ideas as to the future direction of the exchange rate of a particular currency pair. This can also happen between periods of economic data releases, or, while traders wait for events such as interest rate decisions, or forward guidance on monetary policy to be announced by the respective governments.
Another thing to consider is that the Forex market never trades in a linear fashion, that is to say, that it does not move in straight lines. Market performance usually coincides with current daily news events and where this causes volatility and change in price action, which leads to short price action shocks. And where these moves typically spend a lot of time retracing, and this is usually due to traders considering price action to be overbought or oversold within the various timeframes.
Markets do not necessarily range in a horizontal fashion; they can also range in upwards or downwards trends as well.
Example C
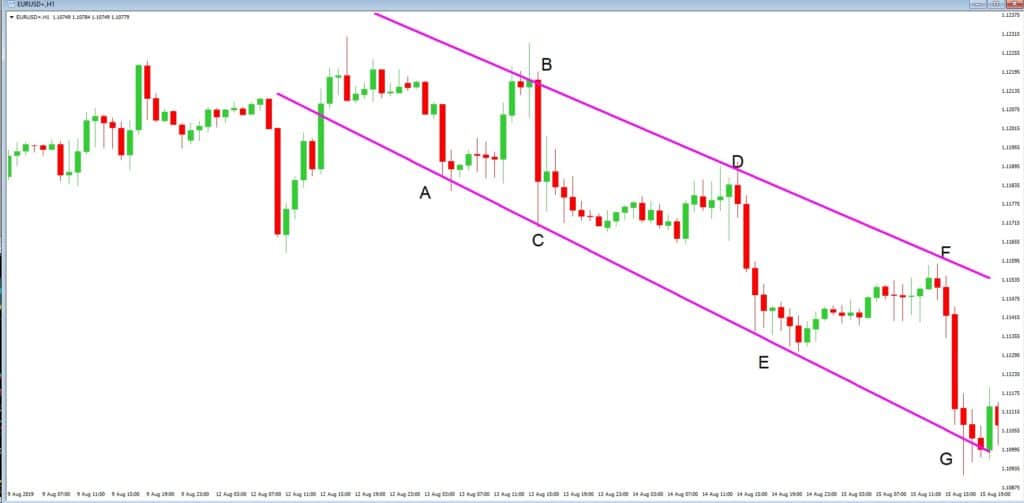
Example C is a one hour time frame of the EURUSD pair, and after a difficult to decipher price action movement to the left of the image, at position A and B we have the beginnings of a downward range, or trend, that would have offered up to 200 pips to traders who spotted the opportunity.
Example D
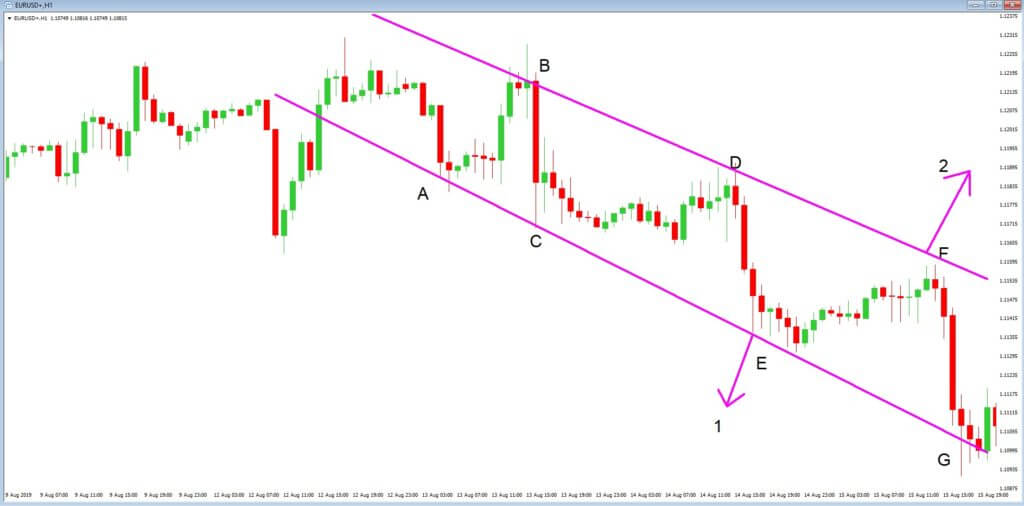
In example D, a range-bound price action is confirmed, and levels of support and resistance are identified at position A, B, C, and D, and therefore should price action continues below the support line at position 1 – where we might have bought the pair, or higher than our resistance line at position 2, where we might have gone short, we would then have confirmation that the trend had finished. However, because we have placed our trend lines on the chart, we can place tight stop losses a few pips above or below our lines in order to reduce risk.
And so, if you are looking to trade range bound markets, make sure that your time frame has established at least two attempts of support and resistance and then pick your moment carefully to buy from support levels and sell from areas of resistance.
Always be mindful that range-bound price action does not go on forever, traders will be sitting on the sidelines waiting for the price to breach support and resistance areas and where extra volatility can creep into the market while traders trade away from them.

