
Introduction
In the previous article, we discussed a trading strategy that was a combination of EMA and RSI. Presuming that all the readers easily understood it, we will now discuss a trading strategy that is a combination of three technical indicators. Today’s article will acquit us with another useful and reliable trading system that is based on the combination of Simple Moving Average, Stochastic Oscillator, and Relative Strength Index (RSI).

Time Frame
This strategy is only applicable on the 1-hour time frame. This is because all the indicators tend to sync in this time frame. Therefore, the strategy may not be suitable for day traders.
Indicators
The strategy consists of three indicators – a 150-period Simple Moving Average (SMA), Relative Strength Index (RSI) with period 3, and a Full Stochastic Oscillator with standard settings. The overbought and oversold levels for the indicators stand at 70-80 and 30-20, respectively.
Currency Pairs
As the name suggests, this strategy is exclusively meant for ‘EUR/USD.’ The liquidity and volatility of EUR/USD are extremely supportive of this strategy.
Strategy Concept
We first identify the direction of the market using the 150-period SMA and then establish a channel in the same direction. This is the first condition that has to be met before we can initiate a ‘trade.’ One could also this is a ‘channel’ based strategy as it involves going ‘long’ at the bottom of the channel and ‘short’ at the top once the indicators generate signals.
For a ‘long’ entry, we need to see if the Relative Strength Index drops in the oversold area. Once it drops, we look for a bullish crossover of the Stochastic lines, while they are also within their oversold zone. In simple words, we need a channel in a bull trend with both the indicators indicating that the market is oversold and with the Stochastic displaying a bull reversal.
Conversely, a ‘short’ trade is generated when the price starts moving in a downward channel in a bearish trend. The RSI and Stochastic should be in the overbought area that will later display a bearish reversal. As soon as the Stochastic fast and slow lines make a bearish crossover, we enter for a ‘sell’ on the next price bar. All of the above price action must happen below the 150-period SMA.
The strategy offers a high degree of capital protection as we place our stop-loss at the most recent ‘swing low’ or ‘swing high.’ As far as the ‘take-profit’ is concerned, we can use a fixed profit target, or we could scale out as the market approaches our target and protecting it with a trailing stop. An exit signal is also generated by the Stochastic indicator, which we will be discussing in the upcoming section of the article.
Trade Setup
In order to explain the strategy, we have considered the 1-hour chart of EUR/USD, where we will be applying the rules of the strategy to execute a ‘long’ trade.
Step 1: First of all, open the 1-hour chart of EUR/USD and establish the trend of the market. Plot Simple Moving Average (SMA) with a period of 150, Stochastic and Relative Strength Index with their default settings on the chart. If the price is above the 150-period SMA, we say that the market is in an uptrend. Whereas if the price is below the 150-period SMA, we say that it is in a downtrend. Next, draw a channel within the trend. It is better to have an upward channel in an uptrend and a downward channel in a downtrend.
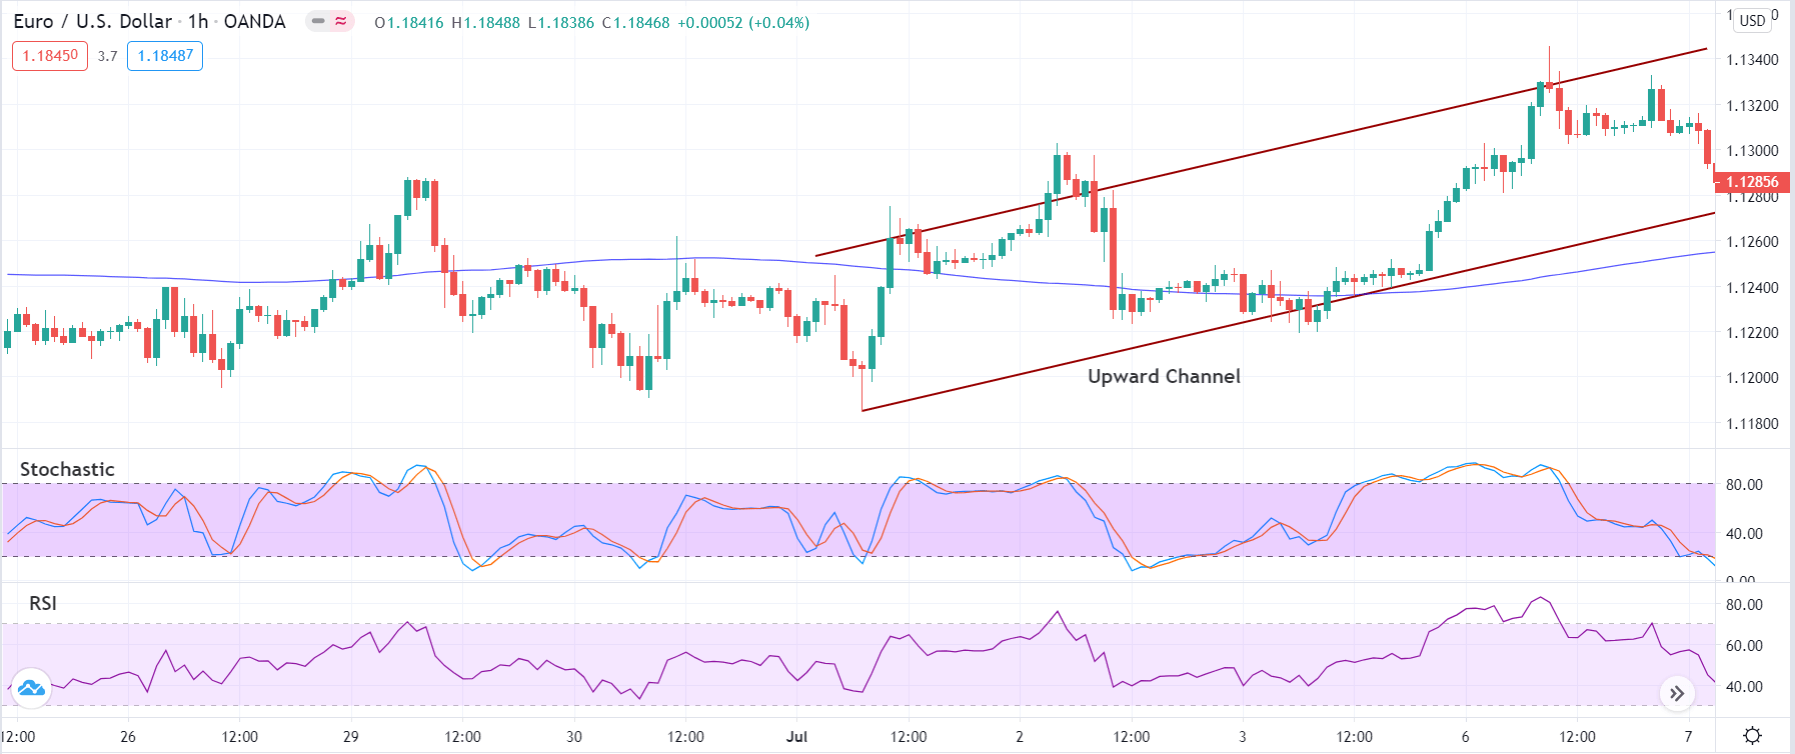
Step 2: This is the crucial step of the strategy, where we align the three indicators together to generate a signal. After the identification of the trend and channel, we need to wait for the price to come at the extreme of the channel. In an upward channel, the price should be at the bottom of the channel, while in a downward channel, the price should be at the top.
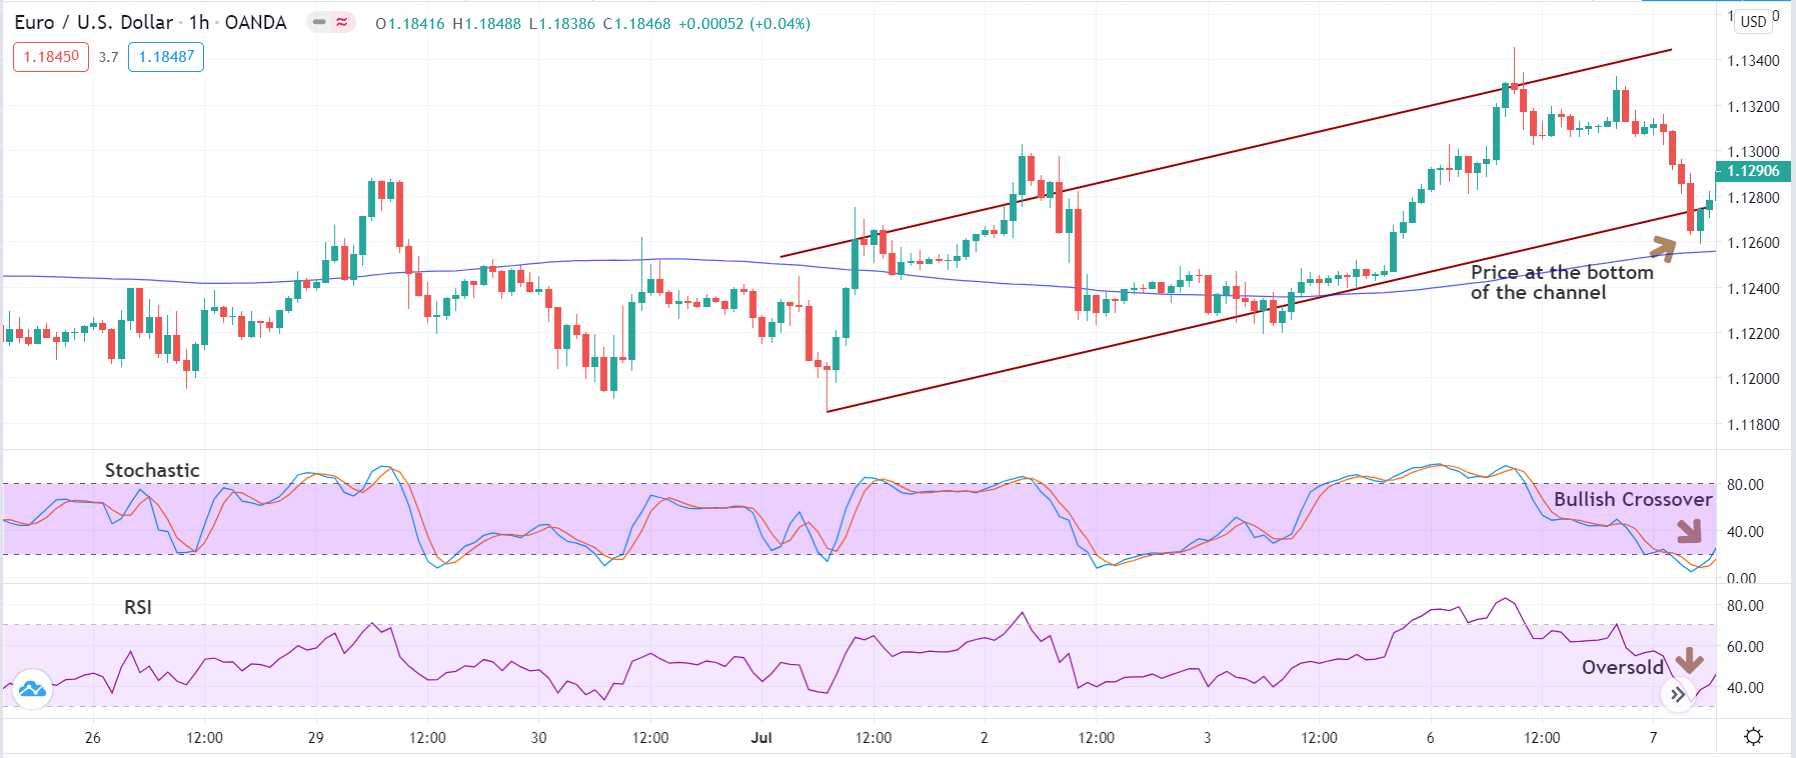
Once the price reaches these extremes, we should watch the Stochastic and RSI. We enter ‘long’ when we notice a bullish crossover in Stochastic and an oversold circumstance of RSI (below 40). This means that the price might be putting up a ‘low’ that will result in a reversal. Similarly, we will go ‘short’ in the currency pair when we notice a bearish crossover in Stochastic along with an overbought condition of RSI (above 60).
The below image shows an example where the above step is being accomplished.
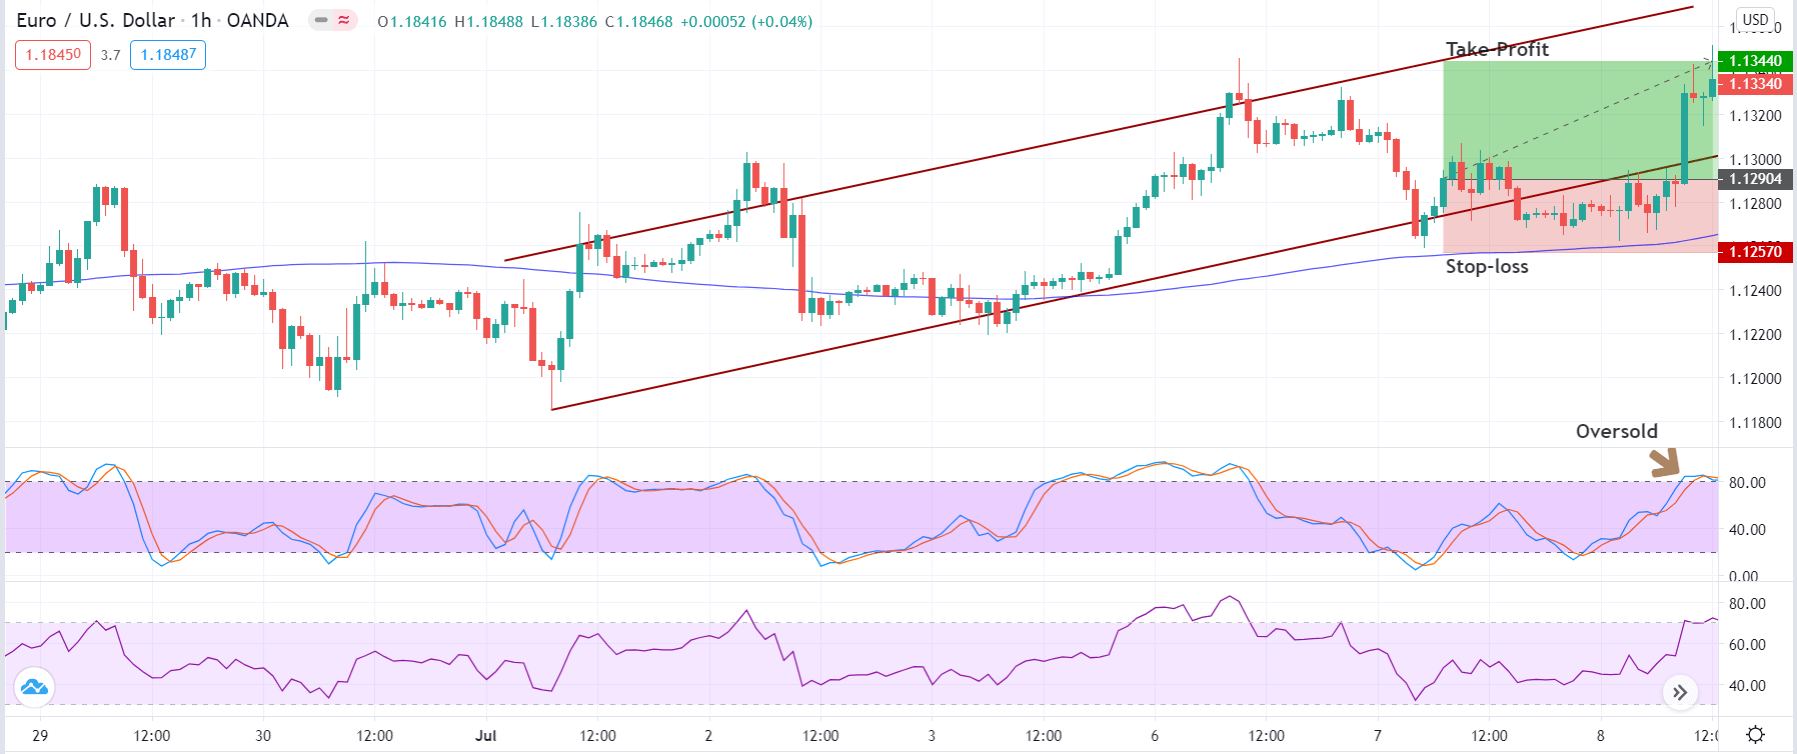
Step 3: In this step, we shall determine the Stop-Loss and Take-Profit for the trade where both these levels are derived mechanically. We place the stop-loss just below the ‘swing low’ from where the reversal took place. It will be above the recent ‘swing high’ in a ‘short’ trade. When speaking of the take-profit level, there is no fixed point for it. We take our profits when Stochastic reaches the opposite overbought/oversold level. At this point, we can either exit the trade, scale-out, or use a trailing stop. This can help in increasing the risk-to-reward (RR).
In our case, the risk-to-reward (RR) ratio of the trade was 1.5, which is above average.
Strategy Roundup
The RSI+Stochastic+SMA strategy is a reliable trend trading system that accurately pinpoints the bottom of a channel in a trend. More importantly, the strategy can provide the best-with-trend entry points that are necessary to increase the probability of winning. Since we are applying this strategy on a higher time frame, it will limit the effects of whipsaws that are encountered more often these days.