Trend line breakouts are a price action way to trade the markets. Trend line comes in a different variety of forms, and they can vary in length and significance. Trend lines are used to get a quick idea of the underlying security direction; also, the traders use them to find out the ascending/descending support and resistance areas on the chart. From lower to higher timeframe trend lines are being used for trading with the trend, countering trend moves and even scalpers used it to scalp the markets.
TEMA INDICATOR
TEMA stands for Triple Exponential Moving Average, and it was developed by Patrick Mulloy, first published in 1994. Mulloy developed a unique composite of the single, double and triple exponential moving average to reduce the lag between the indicator and price action. The indicator is used to identify the trend direction, pullbacks, and short-term price direction. If the price action breaks the triple moving average, it means the trend is down now, and going short is a good idea and close all the long trades. Conversely, if the price action goes above the indicator, it means the trend is up, and going long is a better idea and closed all the short trades.
TRADING STRATEGIES
WITH TREND BREAKOUTS
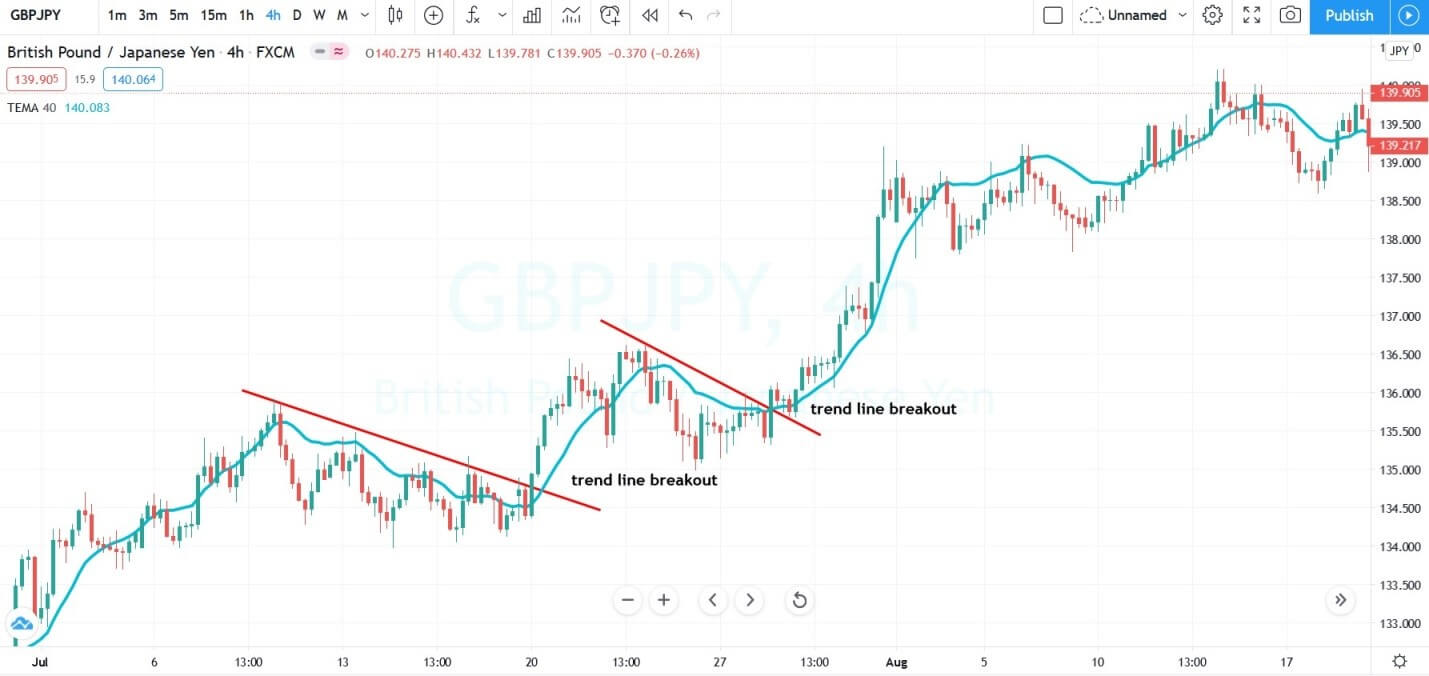
The image below represents the Uptrend in the GBPJPY forex pair.
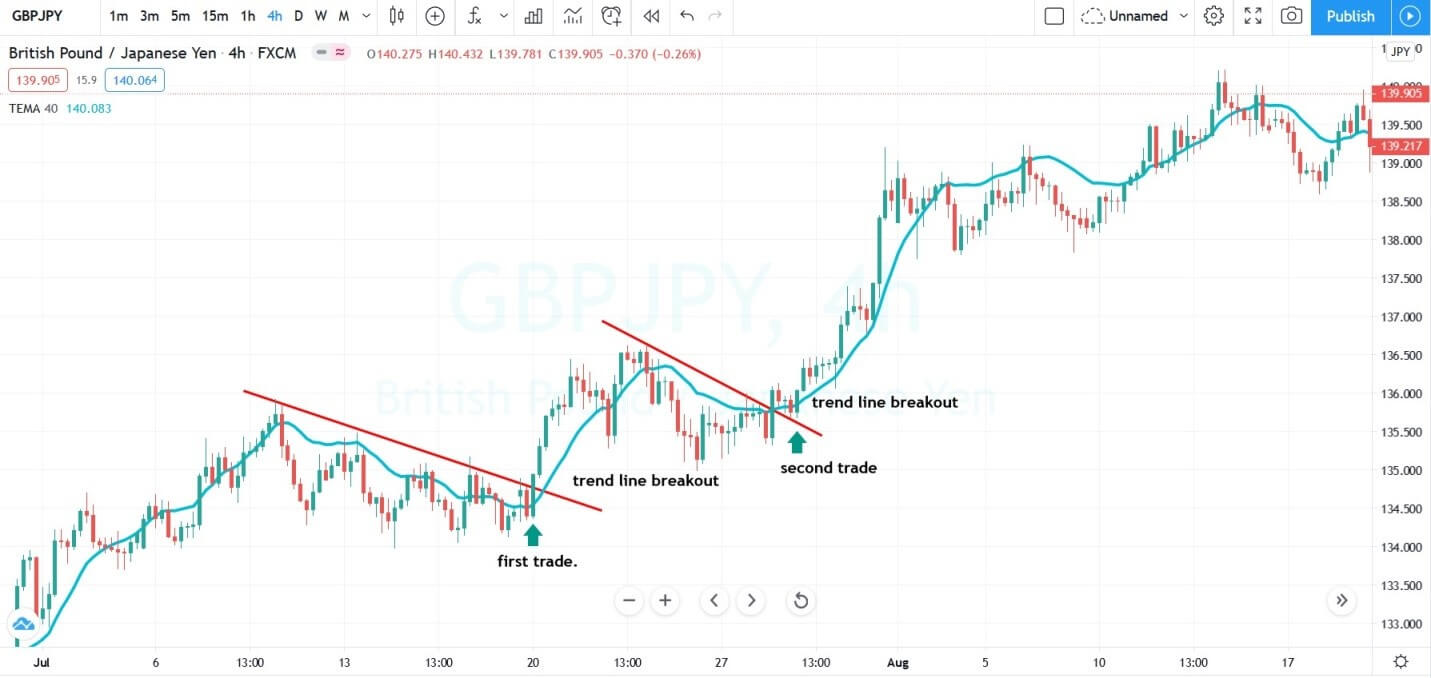
The image below represents the two buying trades in the GBPJPY forex pair. The GPYJPY was in an overall trend, and during the pullback phase, the price action breaks the trend line, and we witnessed the brand new higher high. In the first trade, the trend was strong, and when we witnessed enough pull back, the TEMA goes below the price action and the breakout of the trend line was a sign of the first trade. The second trade happened very next week of the first one, in that trade, the process was the same again where the pullback of the prices was a sign of sellers stepping in, and the breakout of the pullback and TEMA goes below the prices was a sign to go long. In both of the trades, we put the stops just below the closing of the most recent candle to ride the ongoing Uptrend. This one is one of the simplistic yet most effective trading approaches to trade the markets.
SELLING ENTRY
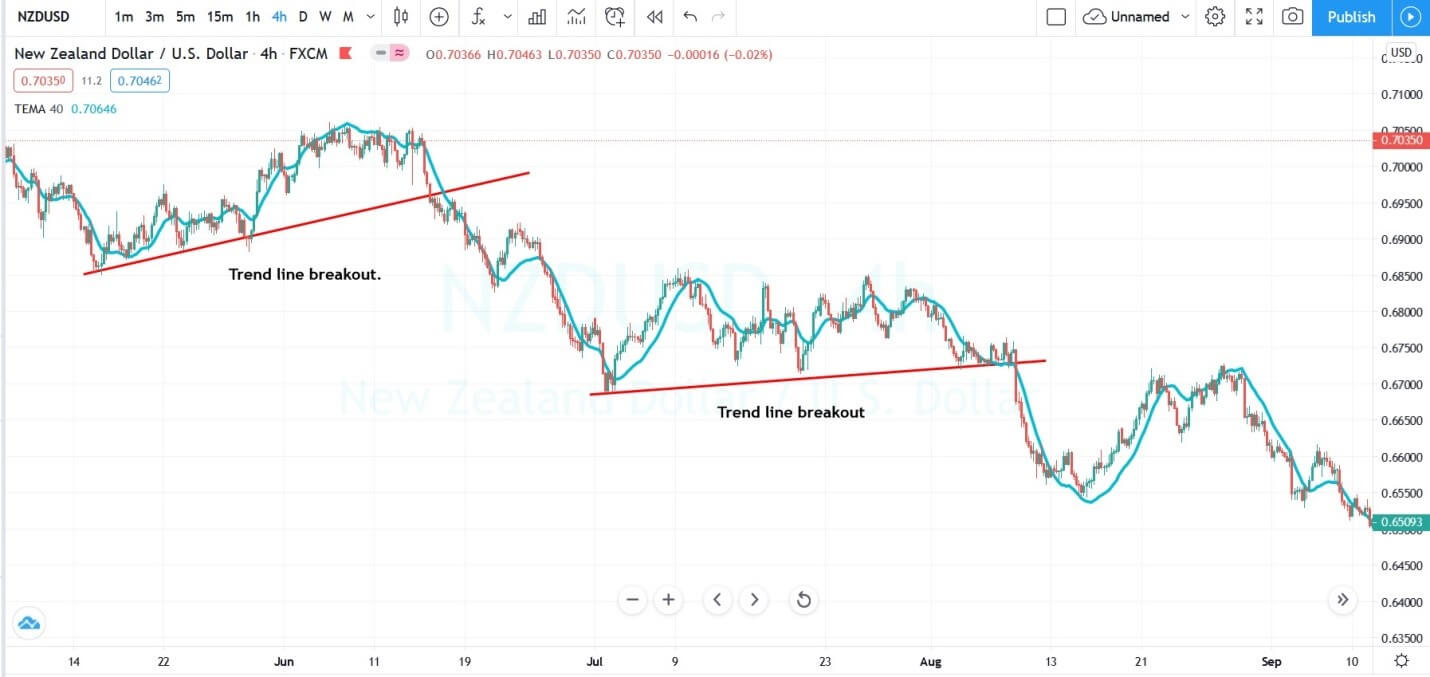
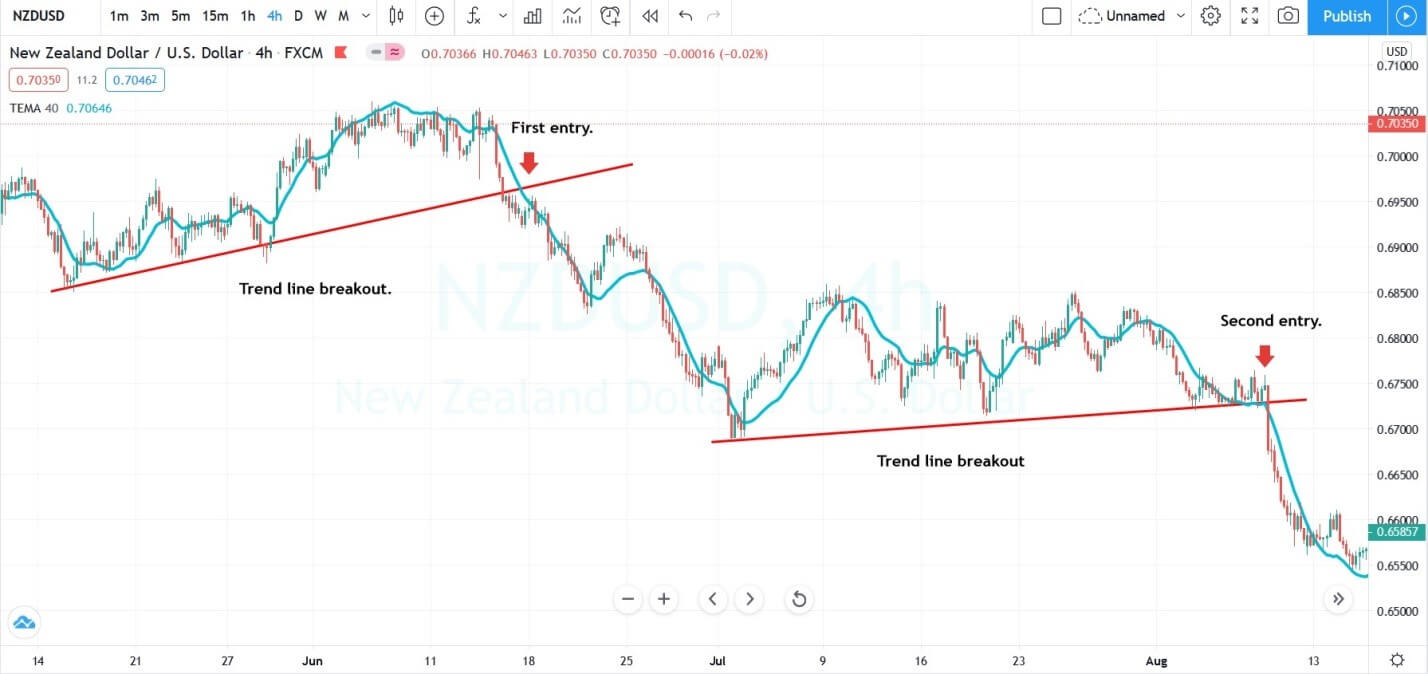
The image below represents the selling trend in the NZDUSD forex pair.
The image below represents the two selling trades in the NZDUSD forex pair. The currency was in an overall downtrend, and it was giving strong pullbacks. When the TEMA goes above the prices and the trend line breakout was a sign to go short. In the second trade, the pullback was also very strong, and the breakout candle gave the signal to take the sell trade. In the market you will witness all the types of pullbacks, some are long, some are short, some pullbacks take a lot of time, and some are intraday. The time of the pullback is depended on the trading timeframes, the lower timeframe moves faster, and the higher timeframes move slower. So patience is the key, and let the prices break the trend line then only activate your trade.
TRADING COUNTER-TRENDS
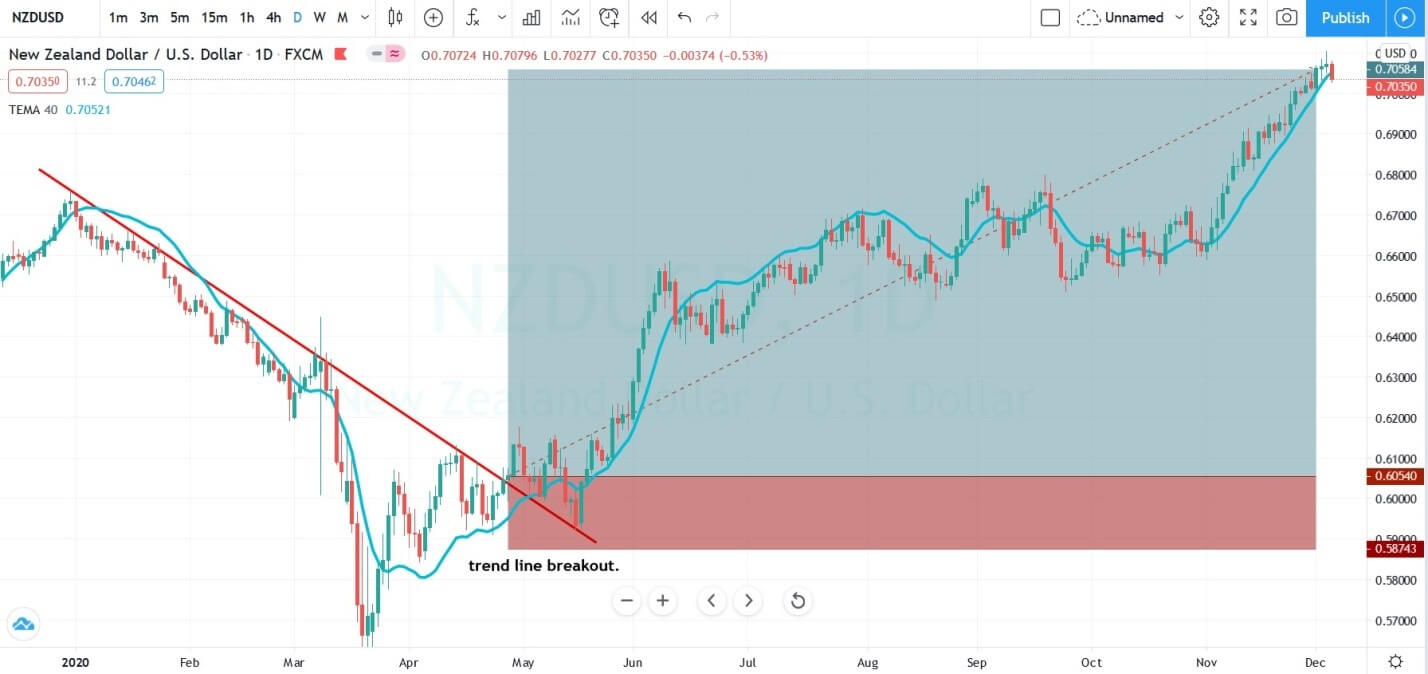
The image below represents the trend line breakout in the NZDUSD forex pair.
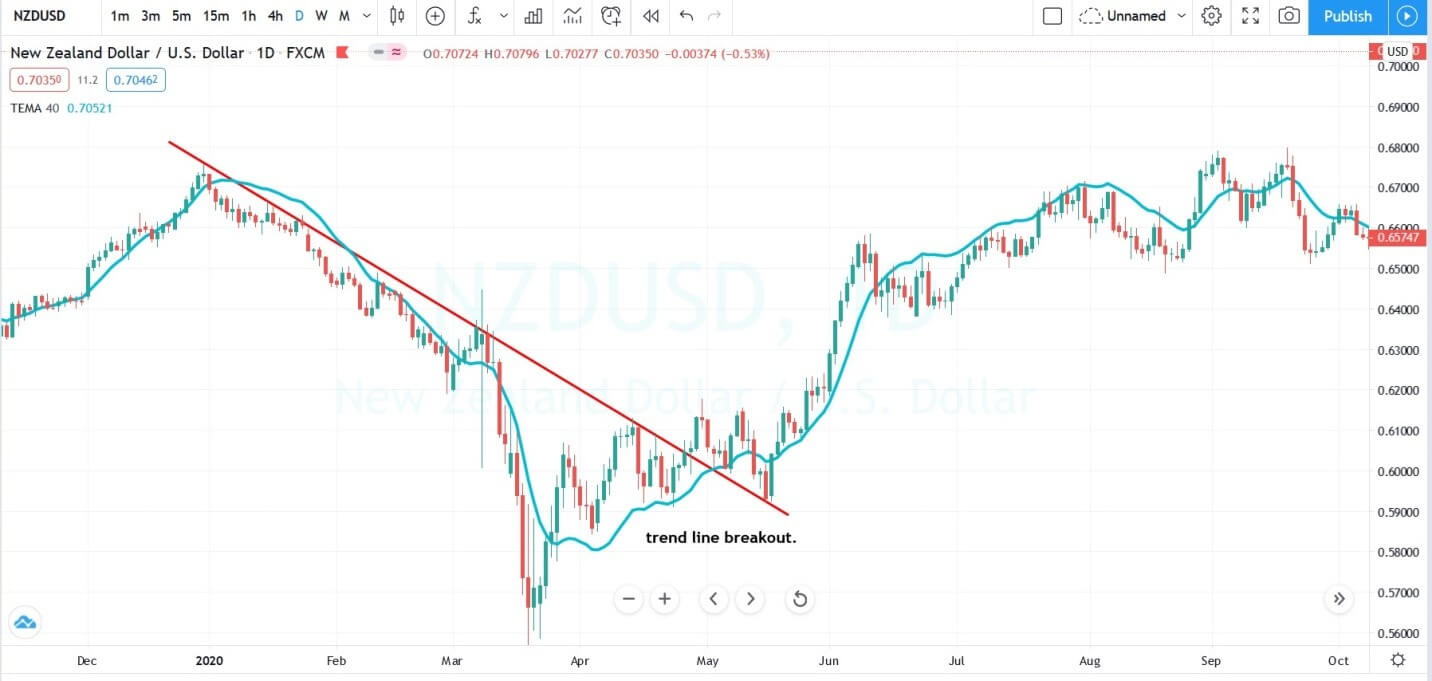
The image below represents the downtrend first, and then the breakout of the downtrend is an indication of a trend reversal. At first, the TEMA goes below the prices, and the buyers struggle a little bit below the trend line support, but the breakout was a signal for us to go long. We took the entry on this daily chart, and after a couple of days the prices tried to go down, but the very next day, strong buyers came back and printed the brand new higher high. When the markets go against your trades, try not to exit your trade, instead have faith in your analysis and let the market to tell you what to do next. This trade is currently running, and it is the biggest winner for us. The buyers are losing the momentum a bit, but overall the currency is still healthy, and we are expecting the higher prices to book the profits.
SELLING TRADES
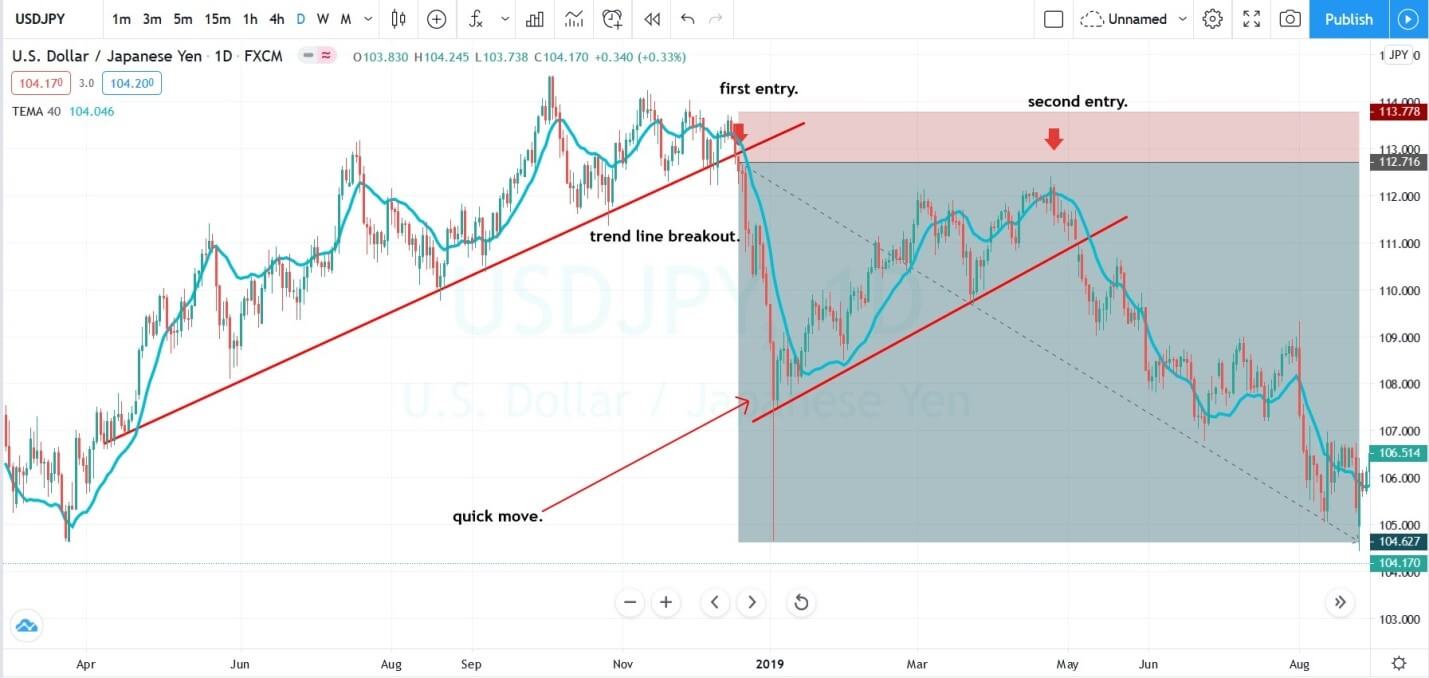
The image below represents the counter-trend breakout in the USDJPY daily chart.
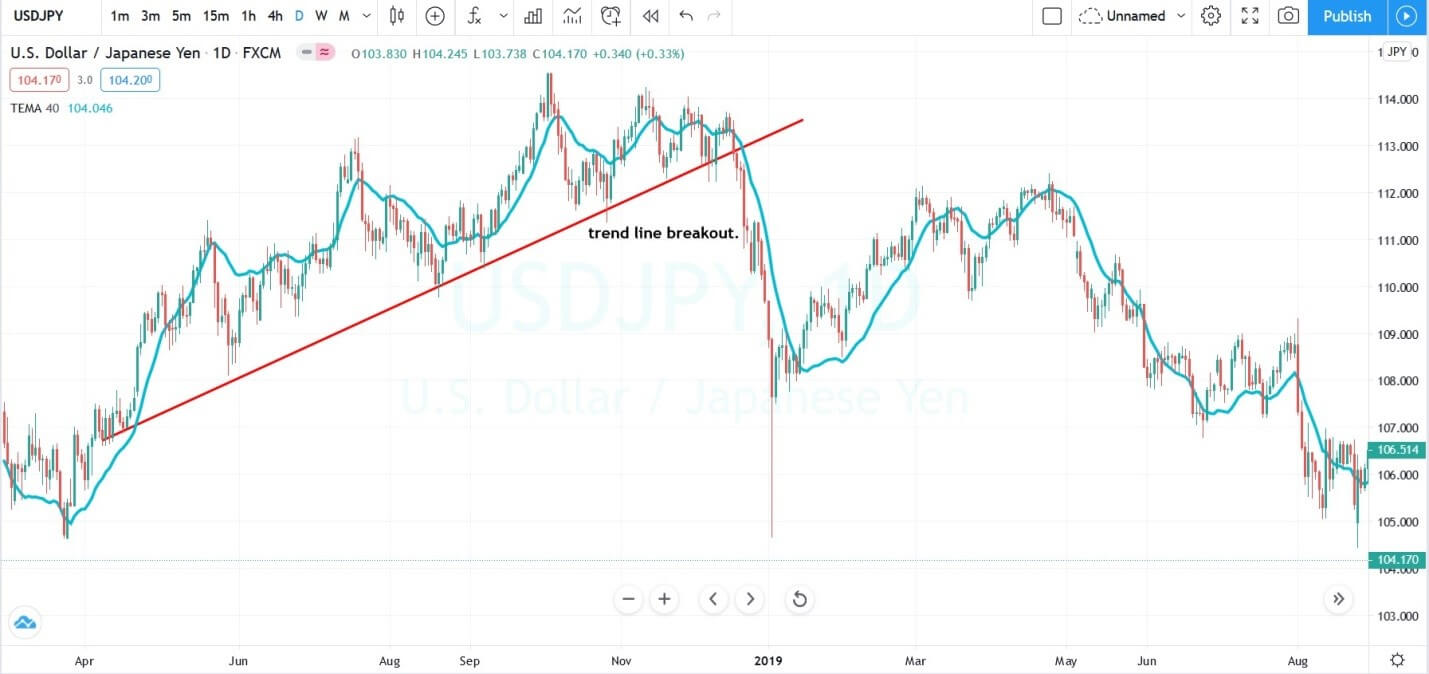
The image below represents the entry, exit, and stop-loss in the USDJPY forex pair. As you can see the currency was in an uptrend on the daily chart and when the TEMA indicator goes above the price action, it was the sign of buyers losing the momentum and the breakout of the trend line was a sign of the buyers are no more in the game. The breakout confirms the selling entry, and on 3rd January the quick move based on the news affects the markets strongly. The profit booking at the most recent lower low wasn’t possible, so we choose to give it another try by holding our trade. Within a few months, we witnessed the TEMA again go above the prices, which means sooner we can expect the trend line breakout and the very next month breakout happened, and we took another selling trade. Within a few months, price action approached the most recent lower low, where we close both of our trades.
CONCLUSION
TEMA is a triple exponential moving average, and everyone knew the trend lines are the leading trading tools, both of these tools work effectively, and using the trend line with the TEMA indicator is a simple approach to trade the markets. Some traders even believe, to make money they need to apply some complex trading techniques, but this is no true. In reality, most of the professionals use simple trading approaches to win consistently. Simple strategies are even easier to master and use, so don’t assume the simple strategies didn’t work. Give it a try; you will be amazed at the results.