Categories
Forex Indicators

Using Parabolic SAR With Dynamic Stops Losses

One of the best-known indicators in the Forex market is the Parabolic SAR indicator. This is because it tells us when the momentum is changing, arriving early when the momentum changes can give you a winning advantage. SAR means to “stop and reverse” by definition. However, there is another way to use the Parabolic SAR, apart from trying to identify trend changes, either in the short or long term, and it is intended to use the indicator as a form of use of dynamic stops loss, either for a partial or total output.

What is the Parabolic SAR?

The Parabolic SAR formula was developed during the boom days of technical analysis in the 70s by Welles Wilder, who is the person who also designed the Relative Force Index (RSI). The relative strength index is pretty much the only Forex indicator that can produce a winning advantage on its own, so it’s worth taking a look at anything written by Welles Wilder.

The algebraic mathematical formula used to calculate the value of the indicator in each candle is complex, so I’m going to explain it in very simple conceptual terms, using for this a long example. When a candle makes a new maximum, the indicator sets a value below that candle. If the candles keep making new maxima, the value of the indicator rises along with the price but is increased proportionally by a factor selected by the user (0.02 is the most common).

The idea is that “time is our enemy” and that the best of any directional movement where we can be is in the part where the momentum keeps increasing. Thus, it is better to use this indicator in commercial trends or in strong directional movements. In fact, Wilder recommends using the Parabolic SAR indicator along with its ADX (Average Directional Index), which is also recognized as probably the best and most useful Forex indicator.

Parabolic SAR and Technical Analysis

Parabolic SAR is an extremely simple “binary” indicator and is often used in forecasting and trading strategies in the following ways:

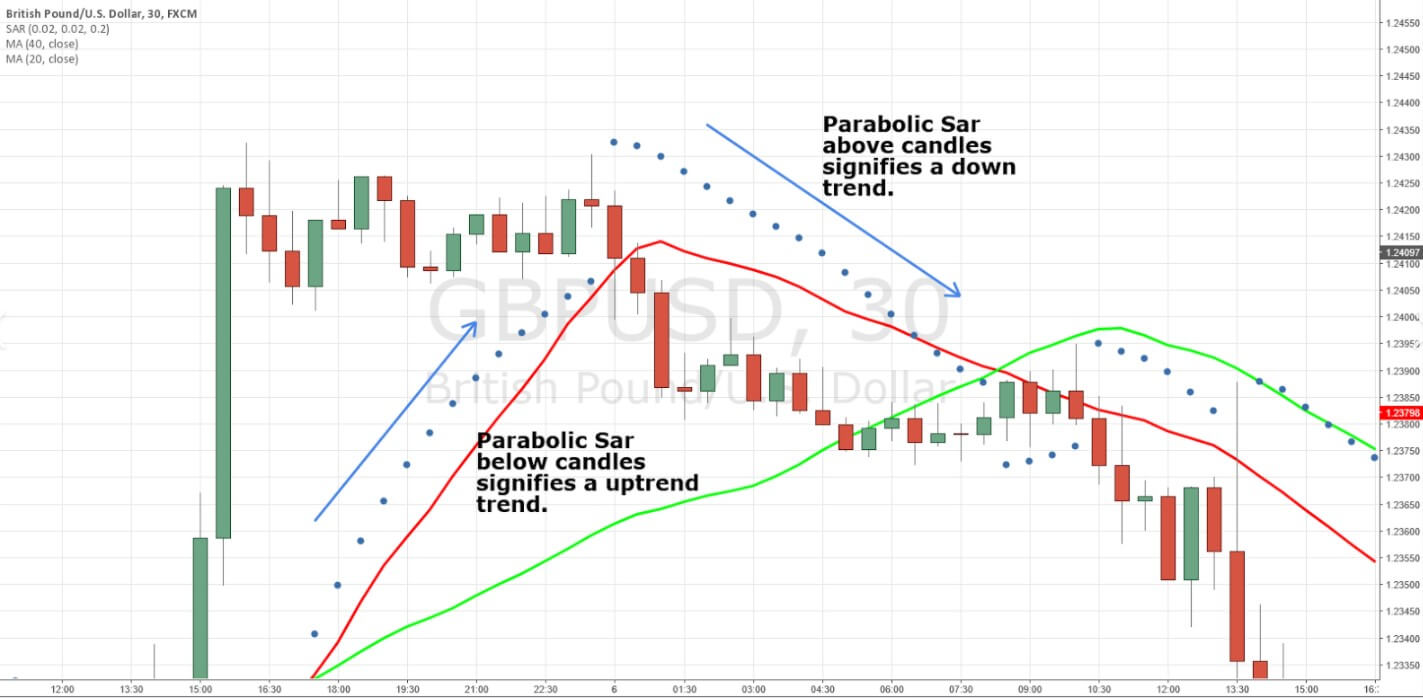
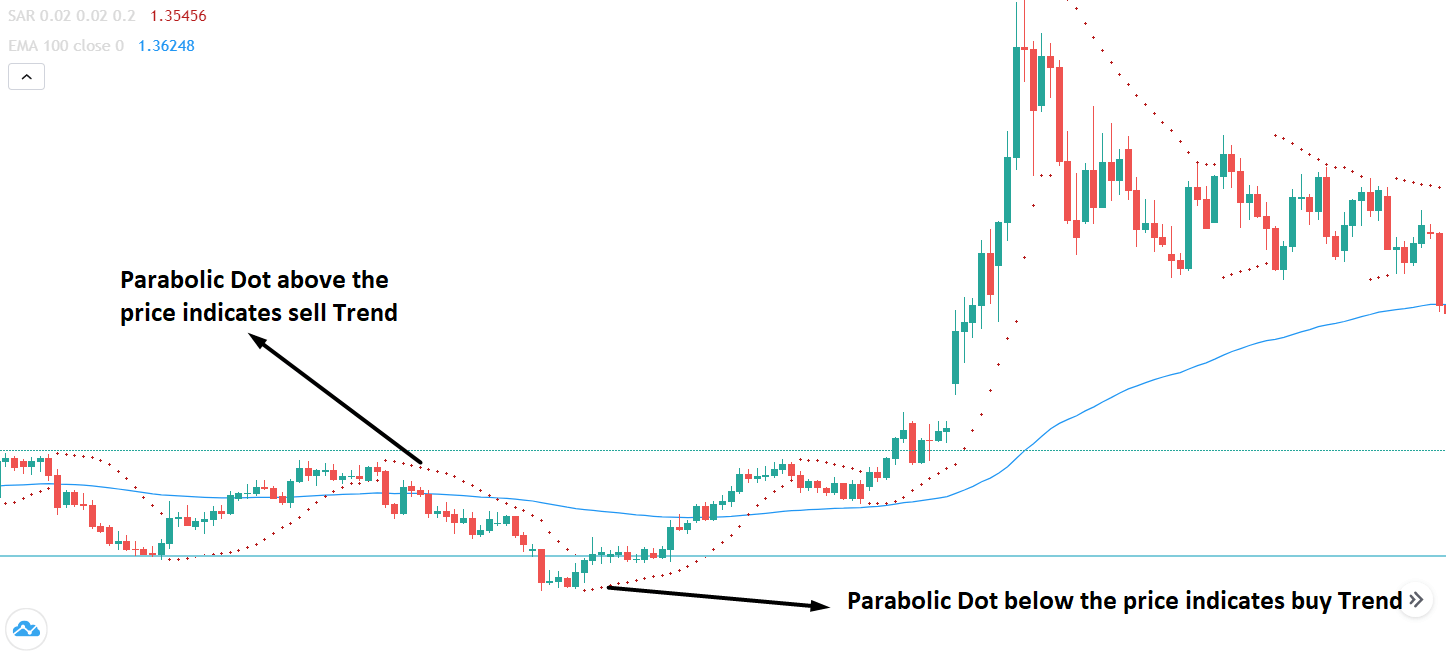
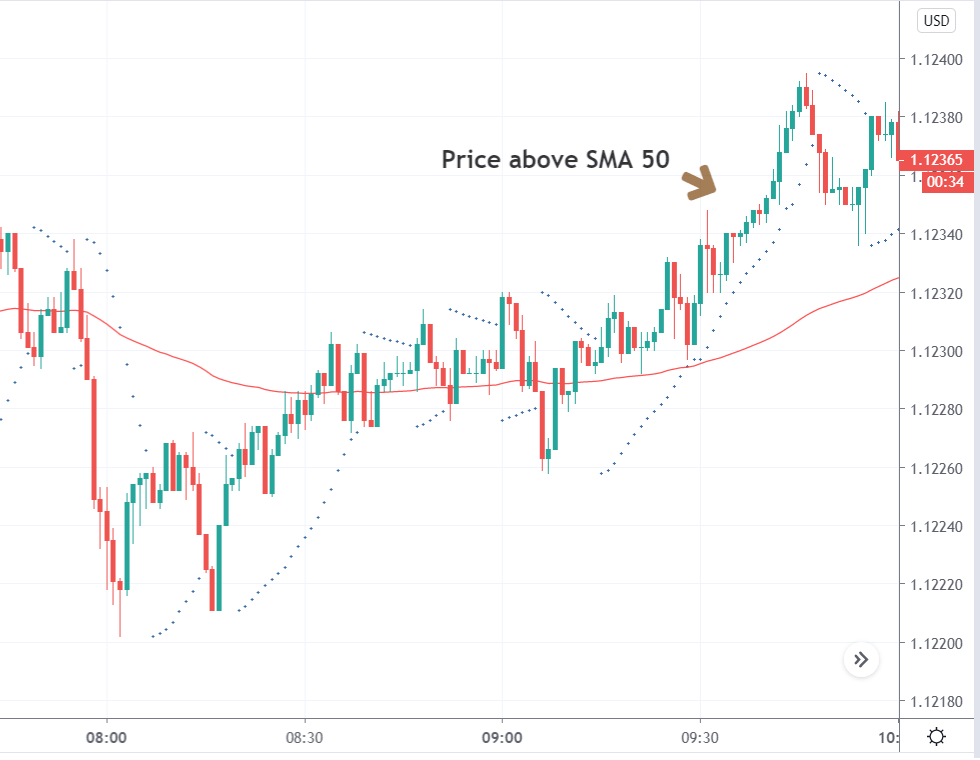
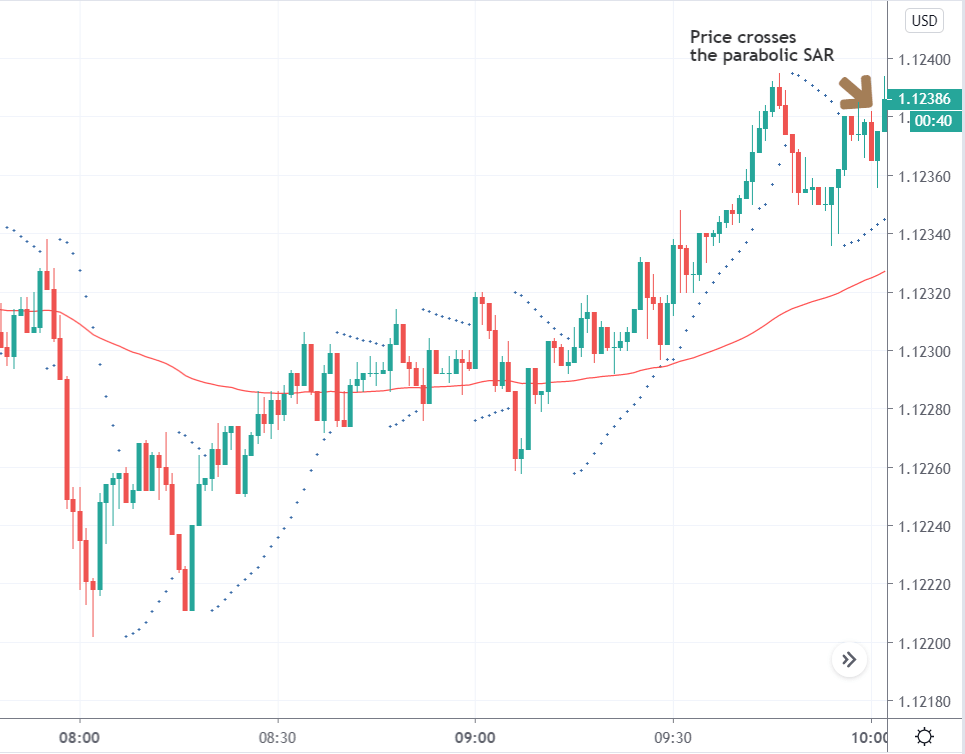
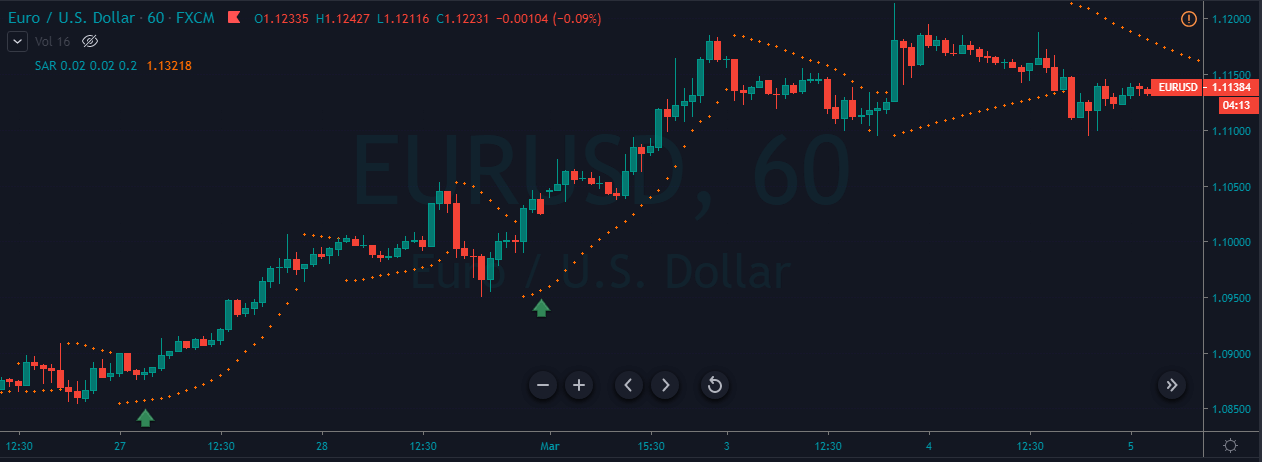
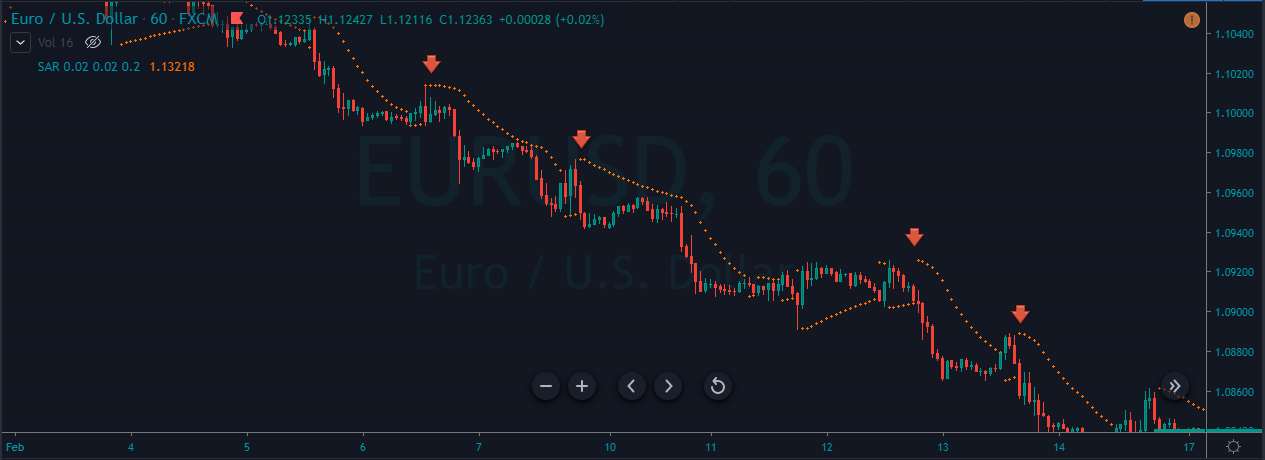
-Determination of the trend. When a new candle is opened and the indicator prints its point on the other side of the candle from where it was on the previous candle, this indicates a change of trend and a possibility of entry into a trade.

-In determining the trend as indicated above, use the ADX indicator to determine whether the trend is powerful enough to have a justification for a new commercial entry, always in the direction of the trend.

-When a certain number of candles have been making new lows or highs with the indicator point always remaining above or below each candle, use the point price (or one near it) as a manually adjusted stop-loss (i.e., a dynamic stop loss) to signal an exit from a trade.

The Best Way to Use the Parabolic SAR

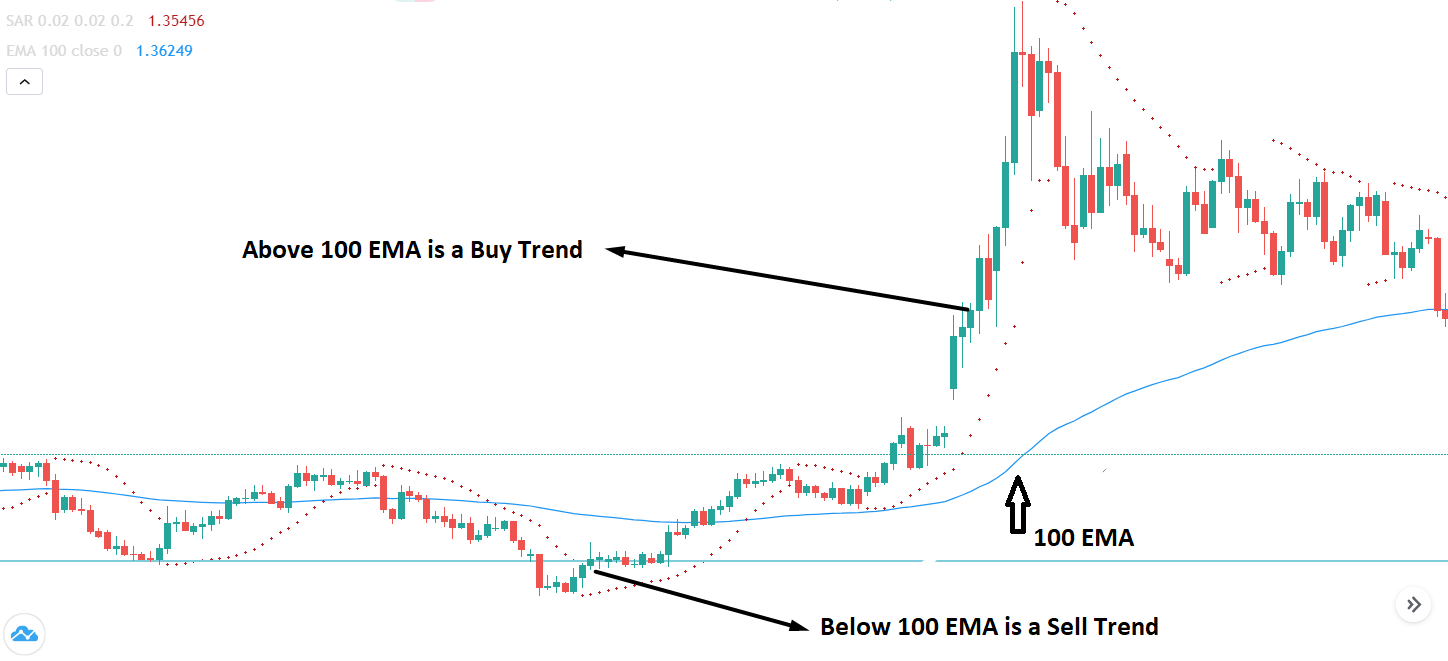
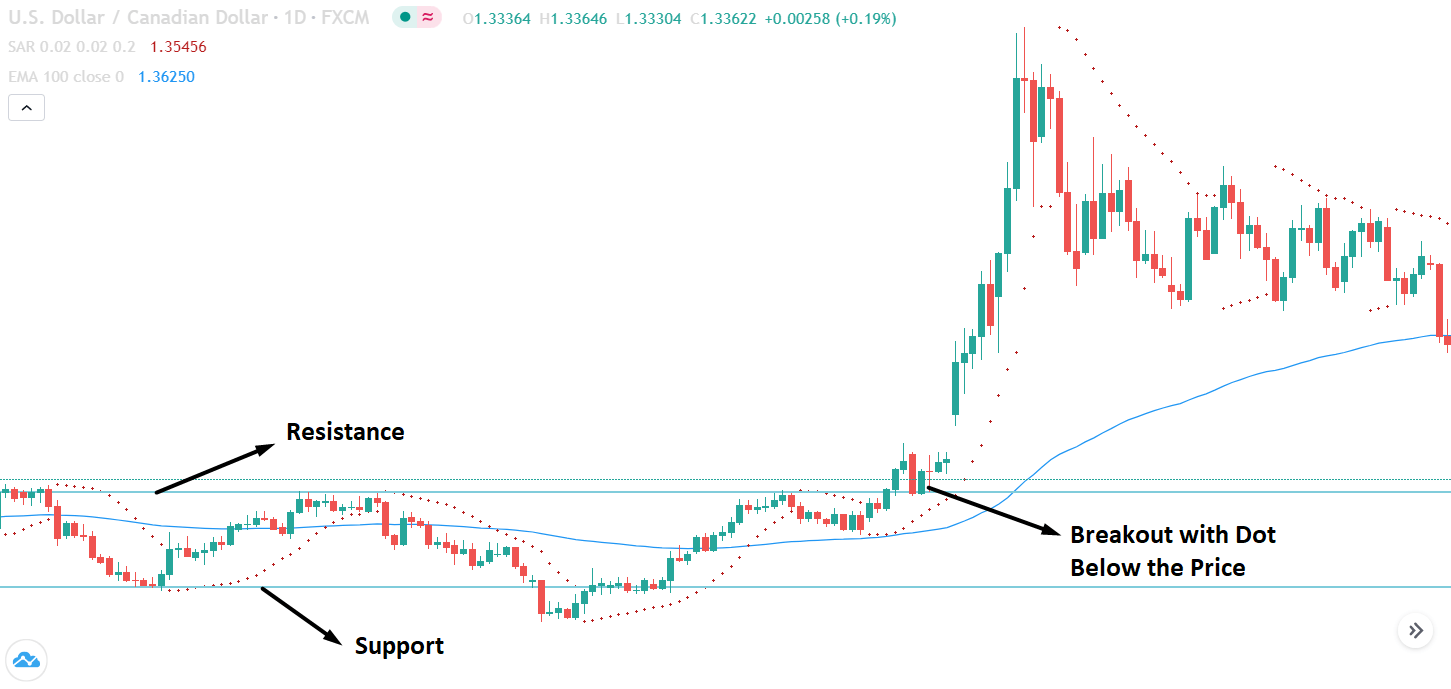
I think the best use of the Parabolic SAR indicator is like a trailing stop when it comes to operating in a strong directional movement. I don’t think it has a great value to determine when to enter: entering the trend direction in Forex is best determined by the break or, usually, better yet, by moving the signals from triple moving average crosses.

Normally, when operating in strong directional movements, the best benefit profile comes when trying to capture two different movements:

  • The initial short-term momentum movement; and
  • The long-term directional movement that begins at 1.

Trying to capture only movement 1 is usually not very profitable in the long run. A better trading strategy is to take partial gains when movement 1 ends, letting the rest of the position run in the hope that movement 2 will take place. Successfully capturing movement at 1 can give you the “take off” necessary to enter the trade at a good entry price that is sufficient to capture movement 2.

Understanding the Parabolic SAR Formula

You don’t really need to know the actual formula of any technical indicator in order to build a trading strategy, but it’s worth understanding why SAR parabolic points appear. In addition, if you want to create an Excel Parabolic SAR calculation file to build a decision support system for your daily transaction, you would need to know the parabolic SAR formula. However, here is the formula used to calculate the parabolic SAR values:

Sarn + 1 = Sarn + α (EP – Sarn)

In the formula Parabolic SAR, the Sarn is the current period and as +1 indicates, the Sarn + 1 is the value SAR of the next period. During an upward trend, the PE is the highest price on the trend, which would be the highest of most candles or bars on the trend. On the other hand, you can be quite sure that the EP would represent the lowest candle or bar in a downward trend. Since parabolic SAR points only appear above or below the price, it is not a difficult task for you to identify what the PE value represents.

The most important variable in parabolic SAR adjustments is α, which represents the acceleration factor in the formula. When you try to add the parabolic SAR indicator in the graph, your graphics package would normally set the value of α to 0.02.

You see, during an upward or downward trend when the price makes a new high or low, the acceleration factor increases by 0.02. This is why the gaps between the parabolic SAR points become larger during a strong trend and the size of the gaps shrink during a price consolidation. Although the default acceleration factor is set to 0.02, most graphics packages would allow you to change it. Maybe you’re wondering why you need it with the acceleration factor. Well, some stock prices are more volatile than others, and depending on the length of time you choose, optimizing the acceleration factor can actually improve your commercial performance.

For example, in the Tradingsim, it can reproduce the price action with different SAR acceleration factors to find the optimal value and test the market to see if the new value makes a major difference in the generation of parabolic SAR buy signals or Parabolic SAR Sell signals. If you see a positive result, you must customize the SAR formula to fit the share price feature of the share.

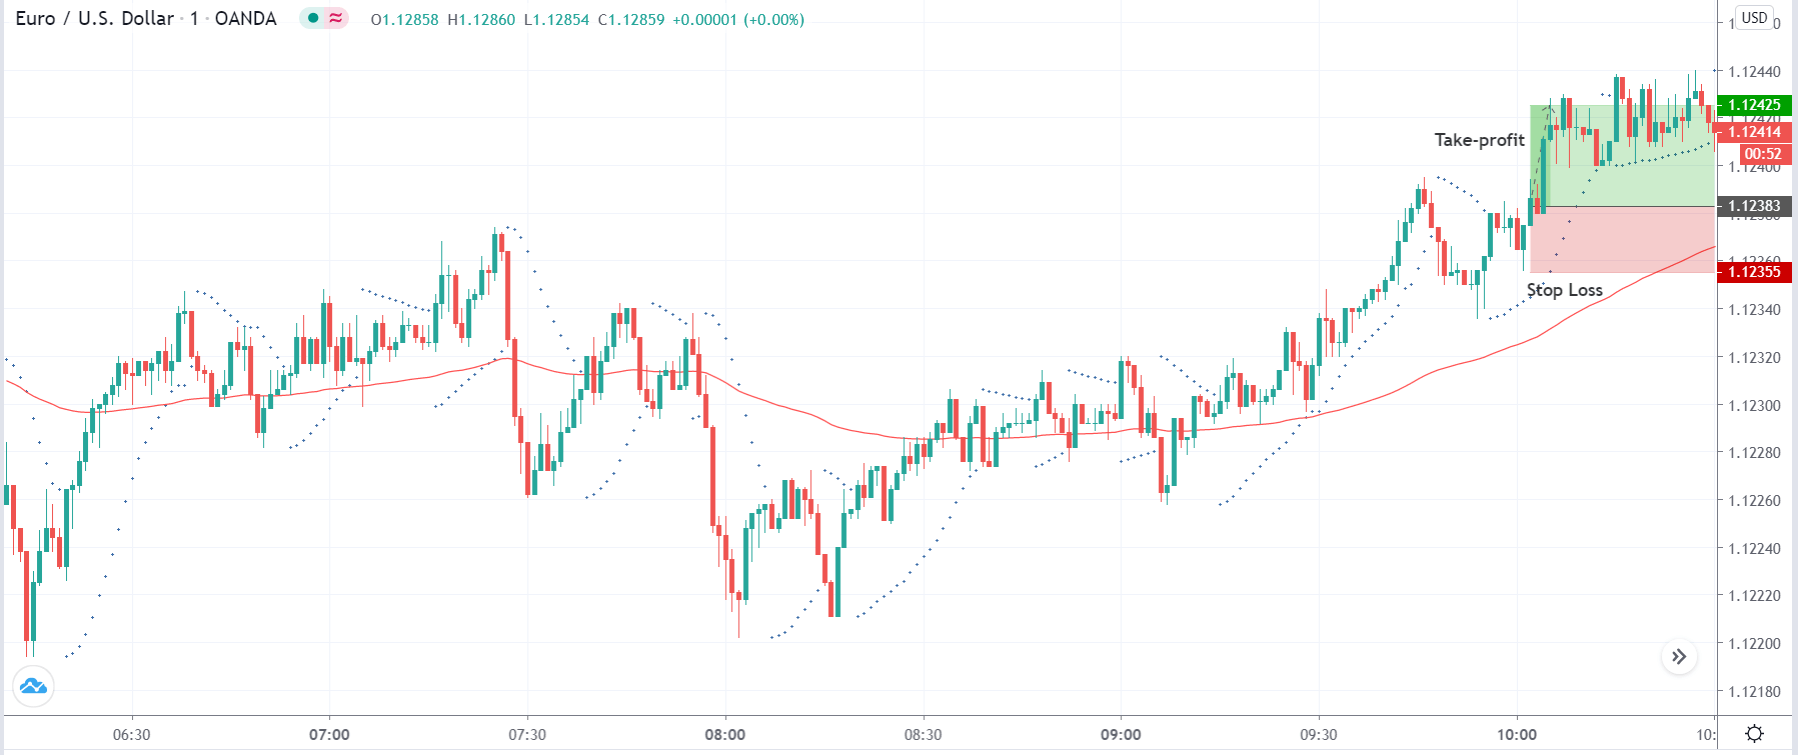
Using Parabolic SAR as Trailing Stop

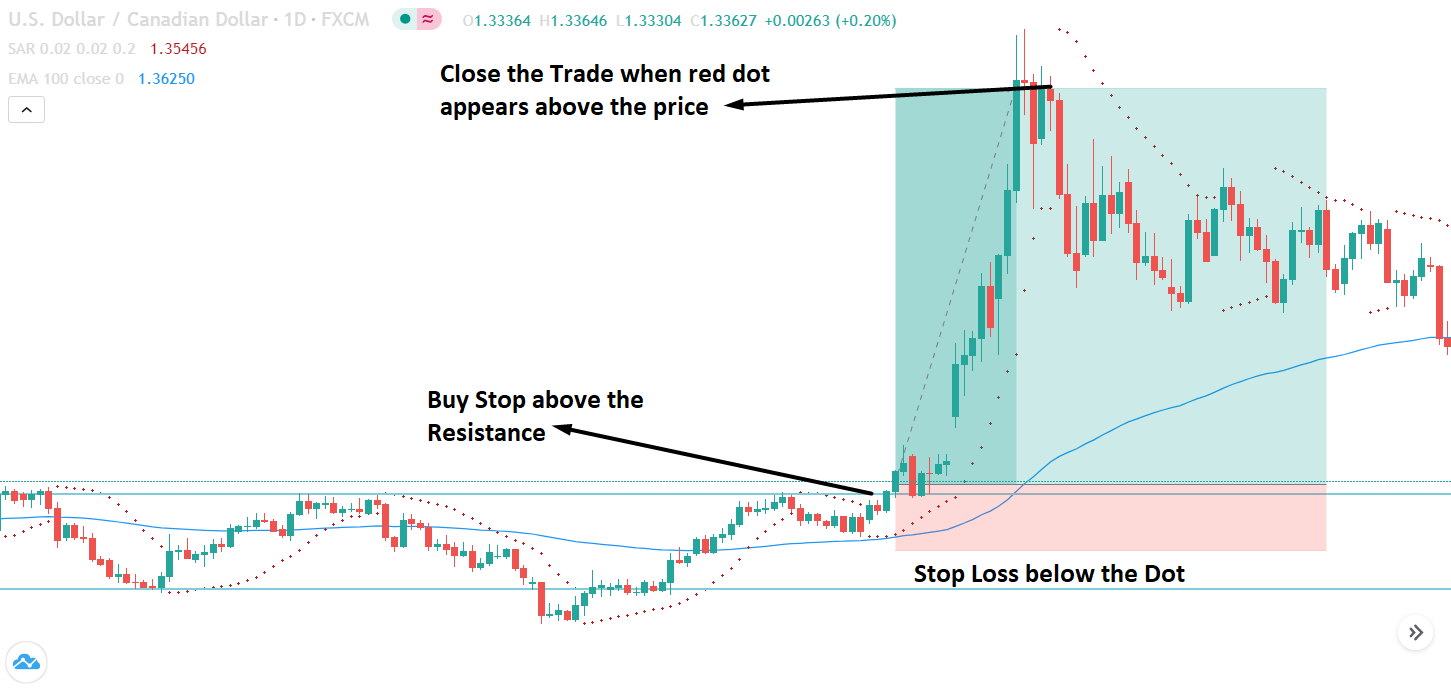
One of the best things about this indicator is that it is extremely easy to use and does not really require any concern on the part of the user with regard to input values. The default values are perfect. One method is simply to manually adjust the stop-loss price to place it a few pips just beyond the indicator point as each new sail opens. A second option may be to wait for the candle to reverse and close beyond the point. This will most likely contribute to you getting better results in the long run.

Remember that your own calculations on any strategy you are using should be moved to the image. Let’s take an example, if you what you expect make a 50% commercial exit at a risk-reward ratio of approximately 2:1, and get an output signal at 0.5:1, which is far from that desired target, you would best ignore the output signal, or maybe move the stop loss to the balance point.

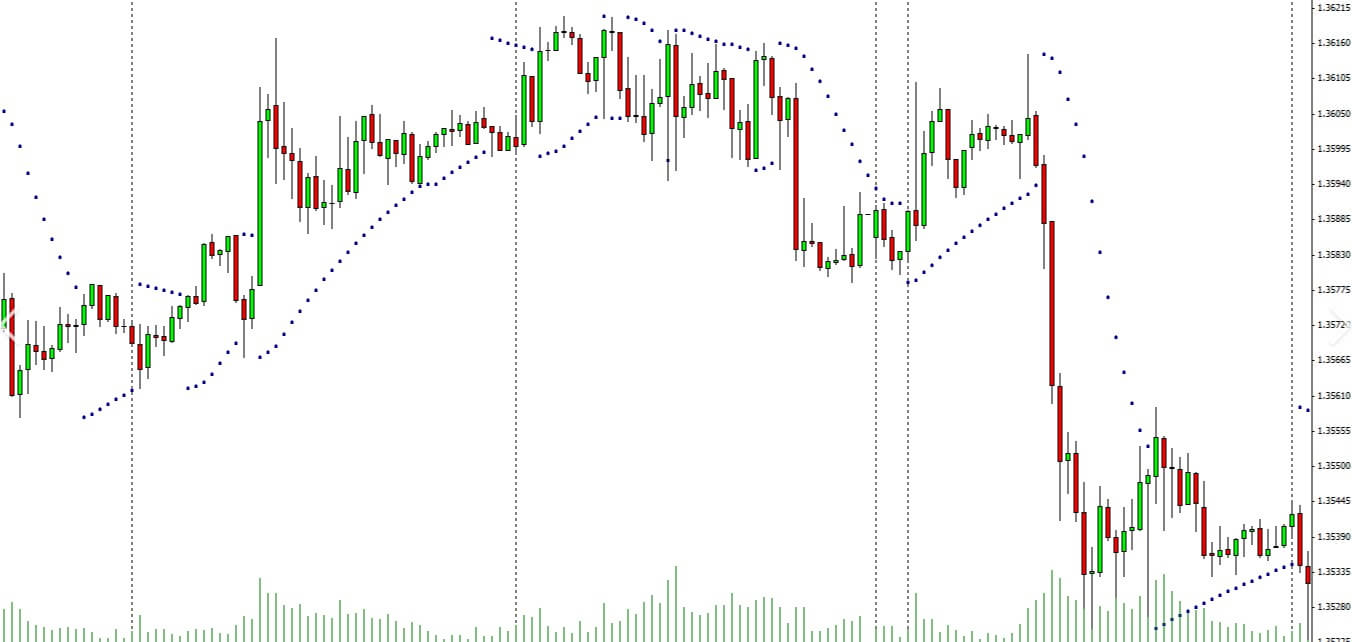
Warning: Only Use With Trending Markets

There are different ways to know for sure if a market is on a trend, but the Parabolic SAR indicator provides good visual aid. If the graph shows that the indicator is changing the point only occasionally, and fairly long chains of consecutive candles with all the points on the same side, then the market is “swinging” enough to give your operation a good chance of making a profit. If the dots are not in a series and are all displayed mixed, then it is a hectic market and it is probably best to avoid it.

Categories
Forex Service Review

A Quick Overview of J. Welles Wilder’s Parabolic SAR

The parabolic indicator SAR (parabolic stop and reverse) was created by J. Welles Wilder, and is used to find possible reversals in market trends. Points to the table show the levels of support and price resistance. This indicator is included in both MT4 and MT5, and default settings are Step 0.02, Maximum 0.2.

How to Use Parabolic SAR

So far, we have done several reviews where we have seen indicators that focus mainly on capturing the beginning of new trends. While it is very important to be able to identify new trends well, it is equally essential to be able to identify where a trend ends. After all, what good is a well-synchronized input without a well-synchronized output?

A parabolic SAR places points on a graph that indicates possible reversals in the movement of prices. These points change from being under the candles during the uptrend to being above the candles when the trend is reversed in a downward trend. This may sound complicated, but the great thing about SAR parabolic EA is that it’s straightforward to use. It’s really very simple.

Basically, when the dots are under the candles, it’s a BUY sign. We’ll have a sales signal when the points are above the candles. We are probably facing the most accessible indicator to interpret because it assumes that the price is going up or down. After saying this, this system is best used in trend markets. You should not use this EA in a hectic market where the price movement is sideways.

Using Parabolic SAR EA to Exit Operations

You can also use Parabolic SAR to help you determine whether or not to close your trade. We have performed a test of this, and we have seen how it worked as an output signal in the pair EUR/USD. When EUR/USD started to fall, it looked like it was going to keep dropping like a rock. Any trader would probably wonder how low it would still go. When at a certain point, three points were formed at the bottom of the price, suggesting that the downward trend was over and that it was time to exit those shorts. If you decided stubbornly to cling to that trade thinking that EUR/USD would resume its fall, you would probably have erased all those gains as the pair finally ended up going up.

Conclusion

We are looking at a very interesting tool that can certainly boost profits. Of course, configuring it correctly is important, but this is simple to do. It is ideal to complement a variety of effective expert advisors. In fact, there are plenty of Parabolic SAR based EAs located within the MQL5 marketplace being offered both for free and at a cost at this time.

Categories
Forex Indicators

Parabolic Sar Need Not be Complicated – Read these Best Practices Today!

In forex trading, some indicators are a case study in making sure you’re using the right tool for the right job and what can go wrong when you take something at face value without doing your own research.

The Parabolic SAR is a great example of an indicator that absolutely crushes some traders – particularly beginners and traders who aren’t properly testing their tools. Like a lot of forex trading tools out there, the SAR is advertised as being good at one thing but it turns out that this superficial understanding of it leads you down a dead-end and can cause your portfolio serious harm if you use it wrong. And, just like a lot of other indicators out there, there may well be legitimate and effective uses for it that lurk beneath the surface but that you will never discover if you just use it out of the box, without taking the time to examine it properly.

This is precisely why the parabolic SAR merits a closer look. That means both that we’re going to talk about it here but also that you should put in the work and properly test how it can fit in with your trading setup.

What is it and Why is it?

There’s a recurring theme in the forex world and the world of trading in any kind of securities more broadly and that’s that the people who dream up and develop indicators and tools are just downright bad at naming them. So many times you’ll come across a tool or method or indicator and you’ll think it’s good at doing one thing because of what it’s called but, on further examination, you’ll realize that it’s actually no good at that thing and you end up using it for something completely different – sometimes you’ll straight up use it for the opposite of its intended application.

That’s kind of the case with the parabolic SAR, which is an acronym of Stop and Reverse. The indicator was the brainchild of pretty much the daddy of a whole host of technical trading indicators – you may have run into him before but if you haven’t, his name will still crop up often enough that you’ll end up remembering it anyway: Welles Wilder Junior. He came up with some of the most-used indicators out there, the Relative Strength Index (RSI), the Average True Range (ATR), the Average Directional Index, and, among them, the Parabolic SAR.

Now, it’s true that he came up with a lot of these indicators to assist equities traders rather than forex traders – they were mostly developed in the 1970s and 80s, well before spot forex trading was even a thing – but the fact that they are still so familiar to us today speaks to the fact that there is often still some value in them. And there is potentially some value in the parabolic SAR, it’s just that it may not be in using it as it was originally intended.

Wilder developed the SAR because he was looking for a way to measure an asset’s momentum in such a way that it would be possible to calculate the point at which it becomes more likely than not that the momentum would switch direction. The idea he had was that a strong movement in the momentum takes on the shape of part of a parabolic curve. A parabolic curve looks a little like a graph of exponential growth and traces a gentle arc from the near horizontal to the near-vertical. In the SAR, the momentum doesn’t always follow through the whole curve and might only mark out a section of it – nonetheless, that’s where the first part of its name comes from.

Wilder also noticed that when the price catches up to the curve mapped out by the momentum, the odds that it would change direction became higher than the chance of it continuing in the same direction. This meeting point of the momentum arc and the price is then the stop point and a reversal here becomes likely – hence stop and reverse.

Reversal Hunting

There’s one great thing about the Parabolic SAR that’s immediately obvious to everyone who comes across this thing and that draws traders into actually using it and that is that it’s almost ridiculously easy to read.

Now, to the more seasoned traders out there that might seem like a bit of a nonsensical thing to say, they would immediately see that as a red flag and be like, “well, you know what, just because something is easy to read doesn’t automatically mean that it’ll actually work the way it’s intended”. And they’d be right of course but once you’ve been trading a while it becomes kind of difficult to take yourself back in time and put yourself in the mindset of someone who’s just starting out.

Traders who have never seen anything like the SAR before will be immediately impressed with how clear and simple it is and how straightforward the signals it sends you are. And that’s its initial appeal – it looks like it does exactly what it was advertised to do and there’s zero input required from you the trader. You just plug it in and it’s ready to go.

On the surface of it, the SAR was developed as a reversal indicator that tracks momentum and then tells you, “hey, momentum has bumped up against price here, there’s a reversal unfolding”. And if you don’t look at it in any greater depth than that, this superficial approach to it is going to lead you down a blind alley where you could find yourself embroiled in some very serious losses.

The first thing to point out here is that reversal trading is a very dangerous, high-risk business and if you’re not 100% sure of what you’re doing, it is very hard to be in the small, elite club of traders that can make it reliably and sustainably work for them. If you are new to trading or even if you have a couple of years of experience under your belt and you decide to go hunting reversals using the parabolic SAR, you are doubly in trouble. Not only will you almost certainly run into big losses running reversal trading without an array of measures and systems (such as risk assessment, money management, and a thoroughly tested and evaluated toolkit of indicators and strategies) designed to cut back on bad trades, you will also be applying the wrong tool to the wrong job.

Reversal trading is not for the faint-hearted and it most definitely is not for beginner traders. But more than that, the parabolic SAR just isn’t a good indicator for the job. It will, almost without fail, call out reversals that are immediately followed by retracements – go test it out, it’s almost uncanny.

Alternative Uses

So if it sucks at doing what its name says it’s good at, what is the SAR actually good for? Well, those of you who have by now become accustomed to taking indicators for a spin around the testing range will be familiar with this one phenomenon that crops up all the time.

What happens, even with quite experienced traders, is that you’ll take a tool or an indicator and start backtesting it, and when you see it takes you into a trade, you’ll measure out how much of a win that trade would have been. So, if you see it take you into a trade that runs for, say 600 pips, you’ll say to yourself, “awesome, this thing is great, I just took home 600 pips!” Well, no, no you didn’t. If you were really making that trade in real-time, there’s no way that you would have taken all 600 pips of that run. Your trade entry and exit just cannot be that perfect in the real world. If you’re lucky, you might have grabbed half of it and taken a 300 pip win but more likely you’ll only have been able to realize something like a third of the whole movement and taken 200 pips.

Now, of course, the reverse is also true and you might have seen that move switchback early on just far enough to blow out your stops so you would have to count it as a loss. One would hope that you have the right money management approach to cut down on that loss by ensuring that you are going into the trade with the right stake that allows you to set your stops at a point that allows a bit of leeway in the price movement. The other thing that you can do here to maximize your win is to apply the right technical trading tools to ensure that you can reap as much of the reward as possible.

This is where the SAR comes in. Not, probably, as your primary entry indicator but more as a secondary, confirmation indicator that helps you to see out a trade to the maximum possible point. In short, you can use it as a trailing stop.

On your chart, the SAR will appear as a series of dots above and below the price that appears as lines – those are the sections of the parabolic curve that we talked about before. When the lines of dots cross the price line, they will flip across to the other side. In reversal trading, this is supposed to be a signal that a reversal is happening but – as we saw – that’s not the best way to use these things.

Context

It’s important to know when to use the SAR because, like a lot of other indicators, it only works in certain market conditions. The main thing to remember is to absolutely never use the SAR when the market is choppy. If you see that the market is ranging or heading sideways or even if there’s a weak trend then you are not going to want to use SAR because it will throw up lots of little false signals that will make it impossible for you to make any money out of the trades it leads you into.

So, the best way to approach the SAR is to use it once you have already identified a strong trend in the market and in conjunction with a primary indicator (or set of indicators) that will lead you into a trade. Under these conditions, the SAW can really shine.

When your system identifies a trade entry on a strong trend and you make the decision to pull the trigger, you can use the SAR as a continuation indicator to lead you down the movement to the point at which you can exit and still walk away with as many pips as possible.

To get accustomed to how this might actually function out in the real world, you will have to put in the work and try this thing out on your historical charts and through a demo account – making sure you combine it carefully with the tools you already use.

Round-Up

In short, the main things to take away from the SAR are that you should never ever use it in either of the following scenarios: a) as any kind of reversal indicator – it does not do this job well and it will lose you money; b) in any way shape or form if the market is not in a clear, strong trend – if there is any fuzziness to the market or even a weak, watered-down trend, don’t use the SAR.

But in its capacity as a secondary or confirmation indicator that you use as a trailing stop or continuation indicator that leads you through a trade you are entering (when the market is already in a strong trend), it has the potential to help maximize your wins.

Finally, make sure you test it for yourself and that it works in the system you have set up to suit your trading needs and preferences. If it doesn’t fit into this, never fear, there are plenty of other trend indicators out there that will do a similar or better job and all you have to do is get out there and find them.


Categories
Forex Basic Strategies

Combining Moving Averages with Parabolic SAR To Generate Accurate Trading Signals

Introduction

Trend trading is a great way to earn money from the forex market. Any retail trading strategy based on a trend continuation pattern works well when it moves within a trend.  Therefore, in this trading strategy, we will take trades from minor corrections using the parabolic SAR towards the trend.

Furthermore, we will use a 100-period exponential moving average to determine the trend. If the price is trading above the 100 exponential moving average, we will consider the trend as an uptrend. If the price is trading below the 100-period exponential moving average, it will consider it a downtrend. We will follow a simple logic by considering buying trades when the market moves up and considering sell trades when the market is moving to drown.

However, there are no specific rules about the period of your moving average. Some traders are comfortable with 100 EMA, while some traders are compatible with 20 EMA or SMA. Therefore, if you’re trading in a lower timeframe, you can use any moving average from 20 to 100 periods. However, we will focus on 100 EMA as it provides good profitability based on swing trading ideas.

Why Should We Use Parabolic SAR?

Parabolic SAR is a forex trading indicator that stands for “stand and reverses.” This trading indicator was devised by J Welles, represented by some dots below and above the candlestick. In an uptrend, dots remain below the price and indicates a bullish pressure once the price is rejected from these dots. Similarly, in a downtrend, the dots form above the price, and the price starts to move once it gets rejected from the parabolic SAR.

In the image below, we can see a clear chart of the candlestick pattern.

Let’s plot the parabolic SAR in the price chart and see how it looks like.

It is visible that in an uptrend, Parabolic SAR is below the price, and in a downtrend, the parabolic SAR is above the price. This is why the parabolic SAR is considered as a stop and reverse indicator.

Furthermore, the parabolic SAR has a built-in stop-loss function. Once the price moves up or down with a new candle, the parabolic SAR changes with the price. Therefore, you can move your stop loss once the price creates a new higher or lower low. Furthermore, you can edit the primary parameter of Parabolic SAR from the indicator’s setting, but in this trading strategy, we will use the default format.

Moving Average with Parabolic SAR

If we use a 100-period exponential moving average, we can catch the major trend direction from the minor correction. The forex market Moves Like a zigzag. Therefore, there is a minor correction in a major bullish trend and minor bullish correction in a major downtrend. If we know the major trend, we can quickly enter the trade from a correction to get the maximum reward from the minimum risk.

In the forex market, parabolic SAR usually provides trading signals earlier than expected, which might create a negative impact on your trading result. Overall, any trend following indicator does not provide a good result when the price moves within a range. In most of the cases, markets follow the trend of about 35% of the time. Therefore, it is essential to filter out the conditions where the market is moving within a range.

We can eliminate the unexpected market behavior by using the 100 moving average as it will provide a more significant trend that will prevent over-trading. In the image below, we can see how the parabolic SAR provides false trading signals when the market moves within a range.

In the ranging market, it would be difficult to make a profit using this trading strategy. Therefore, it is better to use the 100 moving average to get the overall direction of the trend.

Moving Average With Parabolic SAR Trading Rules

Every trading strategy has its unique rules. In the moving average with the Parabolic SAR trading strategy, our main aim is to follow the trend towards the direction of 100 EMA.

Overall, we will follow simple rules as Complex trading rules make it challenging to implement it on the chart. You can make good profits with a simple trading strategy if you can utilize it well with appropriate trade management and money management rules.

Timeframe

The moving average with the Parabolic SAR trading strategy works well in all timeframes from 5 minutes to weekly charts. The longer timeframe will provide better trading results. However, it is better to stick to the 1 hour to daily chart as it can cover fresh moves driven by banks and financial institutes.

Currency Pair

There is no obligation to use a currency pair. However, it is better to use a currency pair that does not remain within a range for a long time like EURCHF. Therefore, all major and minor pairs are good to go with this trading strategy.

Buy Entry (Inverse for Sell Entry)

  • Identify the price above the 100 periods moving average. If the price is choppy at the 100 EMA, Ignore the price chart, and move to another market.
  • Identify the parabolic SAR to point dots below the candlestick, which will be a buy signal (above the candlestick is a sell signal).
  • Later on, place a buy stop order above the candlestick high.
  • Put your stop loss below the printed dot with some buffer.

Example of Parabolic SAR Strategy

At the image below and see how parabolic SAR provided a buy trade setup.

  • Notice that the price is moving in a range at the 100 EMA area with a violation. The blue horizontal line represents the support and resistance level, where the price is consolidating. In this consolidation, we will not take any trade.
  • If you look at the price structure, you can see the price is moving within a range from their resistance to support. On the price move above the 100 exponential moving average, you should put a pending order above the range, projecting that it will break out from the resistance level and create an impulsive bullish pressure.

Stop Loss and Take Profit Set

When you put the pending order above the resistance level, you should put a stop loss below red dots that have appeared below the candlestick. While setting the stop-loss, make sure to use some buffer of 10 to 15 pips.

Later on, hold the price until it points red dots above the price. The red dot above the price will indicate that sellers are entering the market, and there is a possibility to create a new lower low. Furthermore, while sitting the stop loss and take profit, you should follow the basic rules of price action, including the breakout and pullback.

Summary

Let’s summarize the moving average with the Parabolic SAR trading strategy:

  • You should look for a fresh trending movement above or below 100 exponential moving average.
  • Parabolic dots below the price will provide buy-entry, and parabolic dots above the price will indicate sell-entry.
  • You should avoid ranging markets where the price might violate parabolic dots.

Moreover, trade management and good trading psychology are mandatory for every trading strategy. You cannot make a decent profit until you know how to minimize the risk to get the maximum benefit from trade.

Categories
Forex Basic Strategies

Trading The Rapid Fire Strategy – A Reliable Scalping Technique

Introduction

In recent times, the scalping style of trading has gained a lot of attraction from all types of traders. These strategies are characterized by high-volume trading, which is designed to enter the market frequently to make just a few pips.

Most scalping strategies are built using indicators that can make it extremely tough for beginners who are new to the markets. This is one of the reasons why scalping is not recommended for new traders. Whichever scalping strategy we use, we need to make sure that the broker’s platform allows us to employ the strategy on the lowest time frames.

The two scalping techniques we will be discussing are – Rapid-fire and Piranha. These strategies are developed on the 1 minute and 5 minutes time frame charts, respectively. These two time-frames provide ample opportunities to enter in and out of the market several times a day.

Although scalping can be exciting, it can lead to fatigue and loss of concentration due to constant monitoring of the markets. Therefore, besides just knowing about the strategy, one should meditate and learn to be away from the markets when not required. Overtrading does not profit all the time.

The rapid-fire strategy has two basic requirements:

Highly liquid currency pair | Lower timeframe

This criterion led to the development of the strategy on the 1-minute time frame chart using the EUR/USD currency pair. With this strategy, one can find around 30 to 40 trading opportunities every day.

Time Frame

The rapid-fire strategy works well with the 1 minute and even 2 minutes time frame charts, where each candlestick represents one minute of price movement.

Indicators

We use two indicators for the rapid-fire strategy with the following settings.

  1. Parabolic SAR – Step size 0.02 | Maximum 0.2
  2. A simple moving average (SMA) with period 50 and apply to close.

Currency Pairs

The strategy is designed specifically for most liquid currency pairs as EUR/USD, GBP/USD, USD/JPY, and a few others. However, the EUR/USD pair is the most preferred pair for the strategy.

Strategy Concept

The rapid-fire is basically a trend trading strategy. So, we will be applying the strategy on the pullback of a major trend. The strategy combines two trend indicators, SMA 60 and Parabolic SAR, with the appropriate setting. The SMA is used to identify the major trend of the market. This means we look to buy the currency pair when the price is above the SMA, and similarly, we look to short the pair when the below the SMA.

The Parabolic SAR is used to give the exact entry signal after identifying the market direction and pattern. Once we identify the direction, when the price moves above or below the parabolic SAR, we take a trade based on the current position of the price. Let us understand this in detail.

Trade Setup

In order to explain the step by step procedure of the strategy, we have considered the EUR/USD currency pair where we will be applying the strategy on the 1-minute time frame chart. It is advised not to switch to a time frame any lower than 1 minute as it is very hectic.

Step 1

Since it is a trend trading strategy, the first step is to identify the major trend of the market and wait for a retracement. If the retracement comes close to the SMA, it is the ideal case of a pullback. The longer the price remains above or below the SMA, the stronger is the trend.

In our example, we see the market is in an uptrend, as shown in the below image, where the price is well above the SMA for a long time.

Step 2

We can see that there are two dotted lines of the parabolic SAR, an upper one, and another is the lower. The next and most crucial step of the strategy is looking for the entry signal. In case of an uptrend, when the price retracement comes in from the highest point, the price is below the parabolic SAR, which means the price is still in its retracement frame. When the price goes above the upper dotted line of the parabolic SAR, it signals a continuation of the trend, and we enter right at the close of the candle above the SAR.

In the below image, we can see how the price crosses the parabolic SAR and signals an upward price movement.

Step 3

This is the final step of the strategy, where we determine our take-profit and stop-loss levels for the strategy. The stop loss is placed below the previous ‘low,’ or in some cases below the second previous low if the previous low is too close. In case of a downtrend, it is above the previous ‘high.’ As the stop loss is not too big, the risk to reward ratio is more than 1 for this strategy. The take-profit is set at 15-20 pips above or below the entry price, depending on ‘long’ or ‘short’ position.

In our case, the risk to reward of the trade was 1.5, where the market moves further above the take-profit point. Since we are trading with the trend, the trade has the potential to move much further, and thus, one can use trailing stop loss to maximize the gains.

Strategy Roundup

The rapid-fire strategy could also give another entry signal during the course of current trade. It is common to encounter consecutive trade signals one after the other, simply because of the low time frame being used. However, it requires a lot of practice before one can spot them. One should know how to manage the trades, especially when the setups come in fast and furious. The rapid-fire strategy works best in trading markets, which requires quick thinking and swift reactions.

Categories
Forex Services Reviews-2

TIPU Parabolic SAR Dashboard Indicator Review

The Tipu Parabolic SAR Dashboard was published in June 2016 by the creator Kaleem Haider. Haider has a number of Tipu Indicators available for purchasing and his main aim is to make trading easier for traders around the world. Currently, Haider is offering version 2.10 of this indicator, with the latest update being made a couple of years ago in October 2018. Take a look at this review as we highlight the main features of this indicator and how it can be used during your trading.

Overview

The Tipu Parabolic Dashboard is a multi-timeframe, multi-currency indicator that can help traders to analyze markets in a quick and efficient manner. The SAR (Stop and Reverse) is a method developed J. Welles Wilder that is a trend-following indicator that is used mostly for trailing stop (a type of stop-loss order that moves relative to price fluctuations).

Using the Tipu Parabolic SAR Dashboard, users can swiftly change the periods and symbols through this dashboard, so this indicator is ideal for those traders that tend to miss out on great trade opportunities whilst going through browsing charts manually. Another cool feature of this indicator is that it adds alert features on email, on-screen, and even on mobile so you’ll always be informed on time.

The two main features of this indicator are; a number of customizable alerts including buy/sell alerts, push alerts, email alerts, or visual on-screen alerts and a very customizable panel that can be moved on any place on the chart or minimized to de-clutter your screen.

Service Cost

The Tipu Parabolic SAR Dashboard can be purchased for $30 or it can be rented for $10 yearly. For those traders that would like to test it out before spending money on it can do so by downloading the Free Demo.

Conclusion

This indicator seems to be quite well received by users however some did encounter issues with the indicator resetting the currencies chosen by them back to default, and unfortunately, this seems to be an ongoing issue.

If missing out on trades is something that you experience often, download the free demo available and check if this indicator and its alerts can help you in making the right decisions at the right moment.

This Forex Indicator is currently available in the MQL5 marketplace: https://www.mql5.com/en/market/product/16139

Categories
Forex Course

88. Trading The Forex Market Using The Amazing ‘Parabolic SAR’ Indicator

Introduction

Parabolic SAR is a trend following indicator that was developed by ‘Welles Welder.’ The SAR in the name stands for the ‘Stop and Reverse.’ Welder introduced this indicator in his 1978 book “New Concepts in Technical Trading System.” In this book, he also introduced many of the revolutionary indicators like RSI, ATR, and Directional Movement Concept.

As the trend of the currency pair extends over time, this indicator trails the price action. If the indicator is below the price action, it means that the price of the currency is rising, and when it goes above the price, it indicates that the market is in a downtrend. In this regard, the Parabolic SAR stops and reverses when the trend of the instrument changes its direction.

During the volatile market, the gap between the price action and the indicator widens. In a choppy or consolidation market, the indicator interacts with the price quite frequently. Most of the technical indicators represent the overbought and oversold market conditions, whereas the Parabolic SAR visually provides us an insight on where to exit our position.

Parabolic SAR – Trading Strategy

The basic strategy while trading with this indicator is to go long when the dots move below the candlestick and go short when the dots go above the candlestick. It is advisable to use this way only in a strong trending market. If the trend is choppy or if the price action is continuously being pulled back, this indicator will continuously give us the buy-sell signal. All of these trading signals won’t be genuine and can produce many losses if we trade all of those signals generated.

As we can see in the below EUR/NZD price chart, the market was in an uptrend. But the momentum of the buying trend was quite weak. That’s the reason why this pair gives a lot of buying and selling opportunities in this pair. If we trade every opportunity, we will end up on the losing side. This is the reason always we must always find the pair which is in a strong uptrend or downtrend.

Buy Example

First of all, find a currency pair that is in a strong uptrend. While the price is in an uptrend wait for the indicator to go below the price action when the price pulls back. If this happens, we can take buy entry. We can expect a ~ 50+ pip movement if the market is trending. Place the stop-loss just below the dots of the Parabolic SAR.

As we can see in the above image of the EUR/USD Forex pair, the market was in a strong uptrend. We have identified two trading opportunities, and both the trades gave us 150+ pip profit. One crucial thing to remember is, in an uptrend, only go for the buying trades and ignore all the sell signals. Place the stop-loss just below the parabolic dots and book the profit when the market gives an opposite signal.

Sell Example

For identifying sell opportunities, we must first find out a strong downtrend. When the indicator goes above the price action, we can activate our sell trades.

In the below chart, we have identified a couple of selling opportunities in the EUR/USD Forex pair. We can see that each trade travels a significant amount of time before we see the next trading opportunity. This is because the sellers were super strong. Parabolic SAR provides amazing trading opportunities in strong trending markets only. This is the only way to use this indicator for buying and selling.

That’s about the Parabolic SAR indicator and how to use it to trade the markets. This indicator can be combined with others to find the accuracy of the trading signals generated. Try using this indicator and let us know if you have any questions in the comments below. Cheers.

[wp_quiz id=”67826″]