Introduction
Parabolic SAR is a trend following indicator that was developed by ‘Welles Welder.’ The SAR in the name stands for the ‘Stop and Reverse.’ Welder introduced this indicator in his 1978 book “New Concepts in Technical Trading System.” In this book, he also introduced many of the revolutionary indicators like RSI, ATR, and Directional Movement Concept.
As the trend of the currency pair extends over time, this indicator trails the price action. If the indicator is below the price action, it means that the price of the currency is rising, and when it goes above the price, it indicates that the market is in a downtrend. In this regard, the Parabolic SAR stops and reverses when the trend of the instrument changes its direction.
During the volatile market, the gap between the price action and the indicator widens. In a choppy or consolidation market, the indicator interacts with the price quite frequently. Most of the technical indicators represent the overbought and oversold market conditions, whereas the Parabolic SAR visually provides us an insight on where to exit our position.
Parabolic SAR – Trading Strategy
The basic strategy while trading with this indicator is to go long when the dots move below the candlestick and go short when the dots go above the candlestick. It is advisable to use this way only in a strong trending market. If the trend is choppy or if the price action is continuously being pulled back, this indicator will continuously give us the buy-sell signal. All of these trading signals won’t be genuine and can produce many losses if we trade all of those signals generated.
As we can see in the below EUR/NZD price chart, the market was in an uptrend. But the momentum of the buying trend was quite weak. That’s the reason why this pair gives a lot of buying and selling opportunities in this pair. If we trade every opportunity, we will end up on the losing side. This is the reason always we must always find the pair which is in a strong uptrend or downtrend.

Buy Example
First of all, find a currency pair that is in a strong uptrend. While the price is in an uptrend wait for the indicator to go below the price action when the price pulls back. If this happens, we can take buy entry. We can expect a ~ 50+ pip movement if the market is trending. Place the stop-loss just below the dots of the Parabolic SAR.
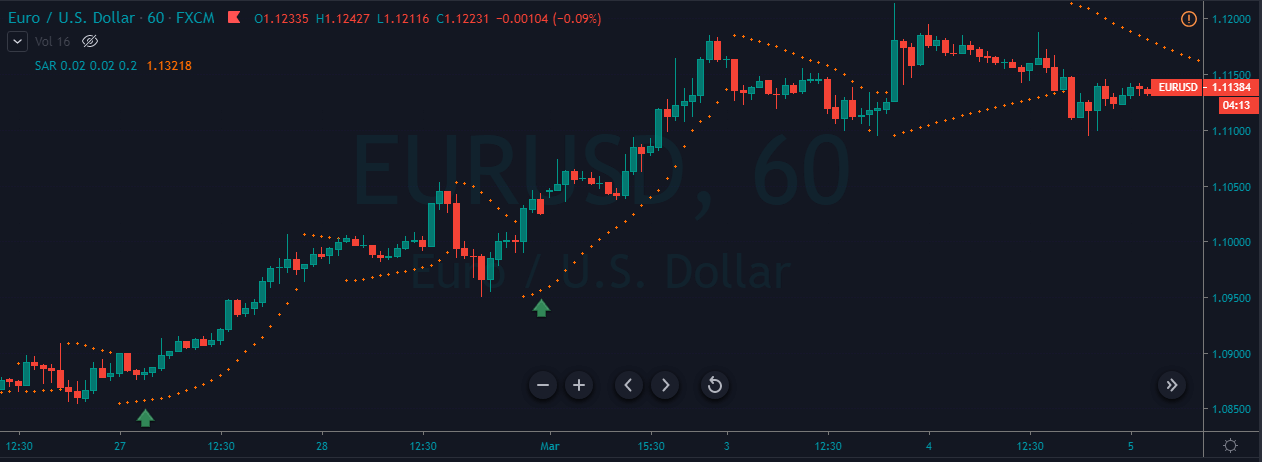
As we can see in the above image of the EUR/USD Forex pair, the market was in a strong uptrend. We have identified two trading opportunities, and both the trades gave us 150+ pip profit. One crucial thing to remember is, in an uptrend, only go for the buying trades and ignore all the sell signals. Place the stop-loss just below the parabolic dots and book the profit when the market gives an opposite signal.
Sell Example
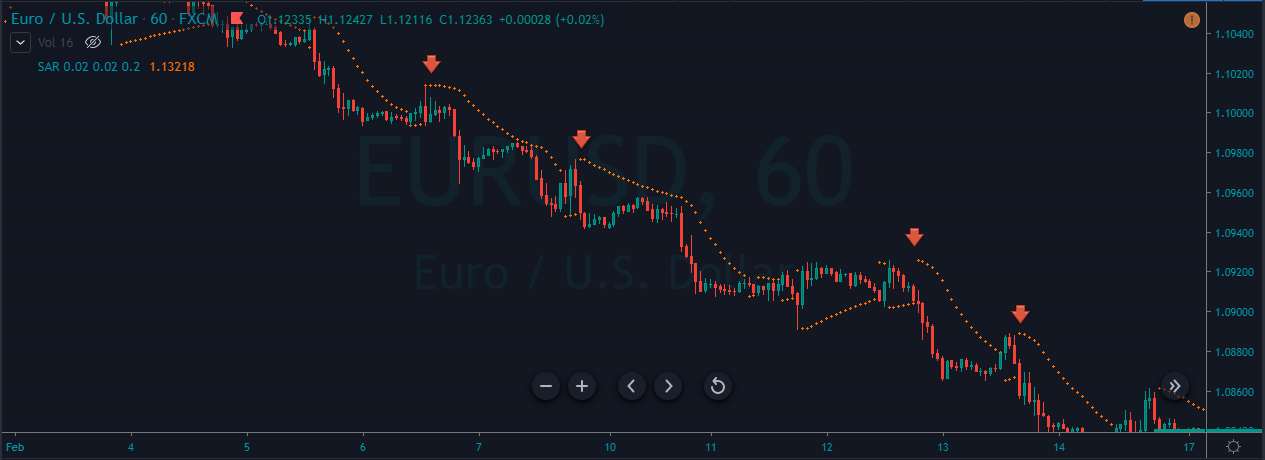
For identifying sell opportunities, we must first find out a strong downtrend. When the indicator goes above the price action, we can activate our sell trades.
In the below chart, we have identified a couple of selling opportunities in the EUR/USD Forex pair. We can see that each trade travels a significant amount of time before we see the next trading opportunity. This is because the sellers were super strong. Parabolic SAR provides amazing trading opportunities in strong trending markets only. This is the only way to use this indicator for buying and selling.
That’s about the Parabolic SAR indicator and how to use it to trade the markets. This indicator can be combined with others to find the accuracy of the trading signals generated. Try using this indicator and let us know if you have any questions in the comments below. Cheers.
[wp_quiz id=”67826″]