Categories
Forex Service Review

Trade Copier Pro MT5 Review

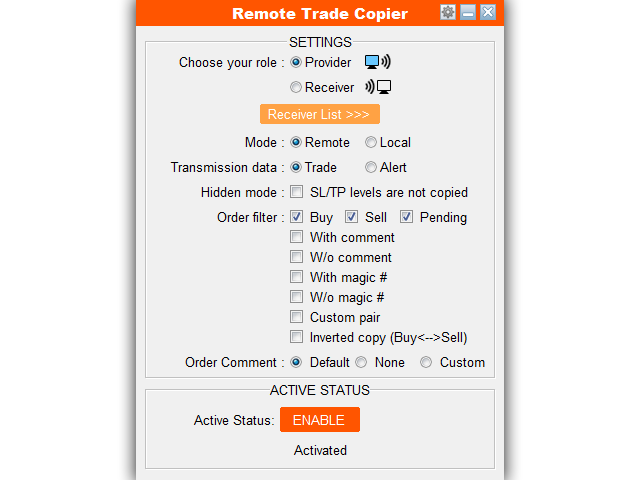
Trade Copier Pro MT5 is a utility used to copy trades remotely between different terminals and can be found on the MQL5 market. This software was last updated on the 14th of March 2020 (at the time of writing) and is currently on version 5.91.

Overview

The Trade Copier Pro software is designed to copy trades remotely between multiple different accounts using MetaTrader 4 or MetaTrader 5. This product is best used for signal providers needing to copy their trades to their client’s accounts which are not hosted in the same place. 

There is a whole host of features available, we won’t list them all but a selection of them include:

  • Copy between MT4 and MT5 accounts.
  • Switchable between Provider or Receiver role within one tool.
  • Can copy Forex trades to multiple receivers (can also receive trades from multiple providers).
  • The provider/Receiver can manage his Receiver/Provider list via a powered database managing system without an additional tool (add, remove, edit, enable/disable, set expiry).
  • The provider can set the subscription expiry for each receiver so that the receiver will not be able to receive the signal after that time.
  • Protect the receiver from slippage and outdated orders.
  • The receiver’s account can still trade manually or use other EAs without any conflict.
  • Auto recognizes and synchronizes symbol prefix/suffix between brokers.
  • Multi lot size setting options for the receiver.
  • Allows filtering copy – SL or TP or exit point.
  • Allows filtering which type of orders will be copied for both provider and receiver.
  • Allows inverted copying for both provider and receiver.
  • Drawdown protection.
  • Auto sends a mobile notification and emails to the receiver when the account has new activities.
  • Real-time control panel.
  • Easy usage and friendly interface.

So as you can see, there is a wide range of features, there are some additional ones available too. There is also a whole host of settings and parameters available to change such as lot sizes, max lot size, whether SL/TP levels are copied, max slippage, whether buy/sell orders are copied, and many more.

Service Cost

The cost of this piece of software is currently $149 to buy, you are also able to rent it, it will set you back $49 per month that you wish to rent. There is also a free demo version available should you wish to try it out before you buy, and we would recommend that you do, there are some limitations to it such as only allowing the receiver of the trades to set the volume with fixed lot sizes.

Conclusion

There are just three different reviews available for this product, there is a range of ratings, one five stars, one star, and one review without a rating.

Very goood! I like it!!!” – 5-star review.

The robot does not work correctly. It may not copy transactions at all. May try to copy trades with maximum lot. (AUD / CAD wanted to sell for 1010 lots !!!). When copying a transaction for 0.1 lot of sale, immediately bathe 0.01 lot.” – 1-star review, translated from Russian.

So one positive and one negative does not provide a great consensus, but you should bear in mind that it does not work for everyone. You should try out the demo version in order to ensure that it has the features that you require prior to purchasing the full version.

Categories
Beginners Forex Education Forex Basics

Myfxbook: The Definitive Guide

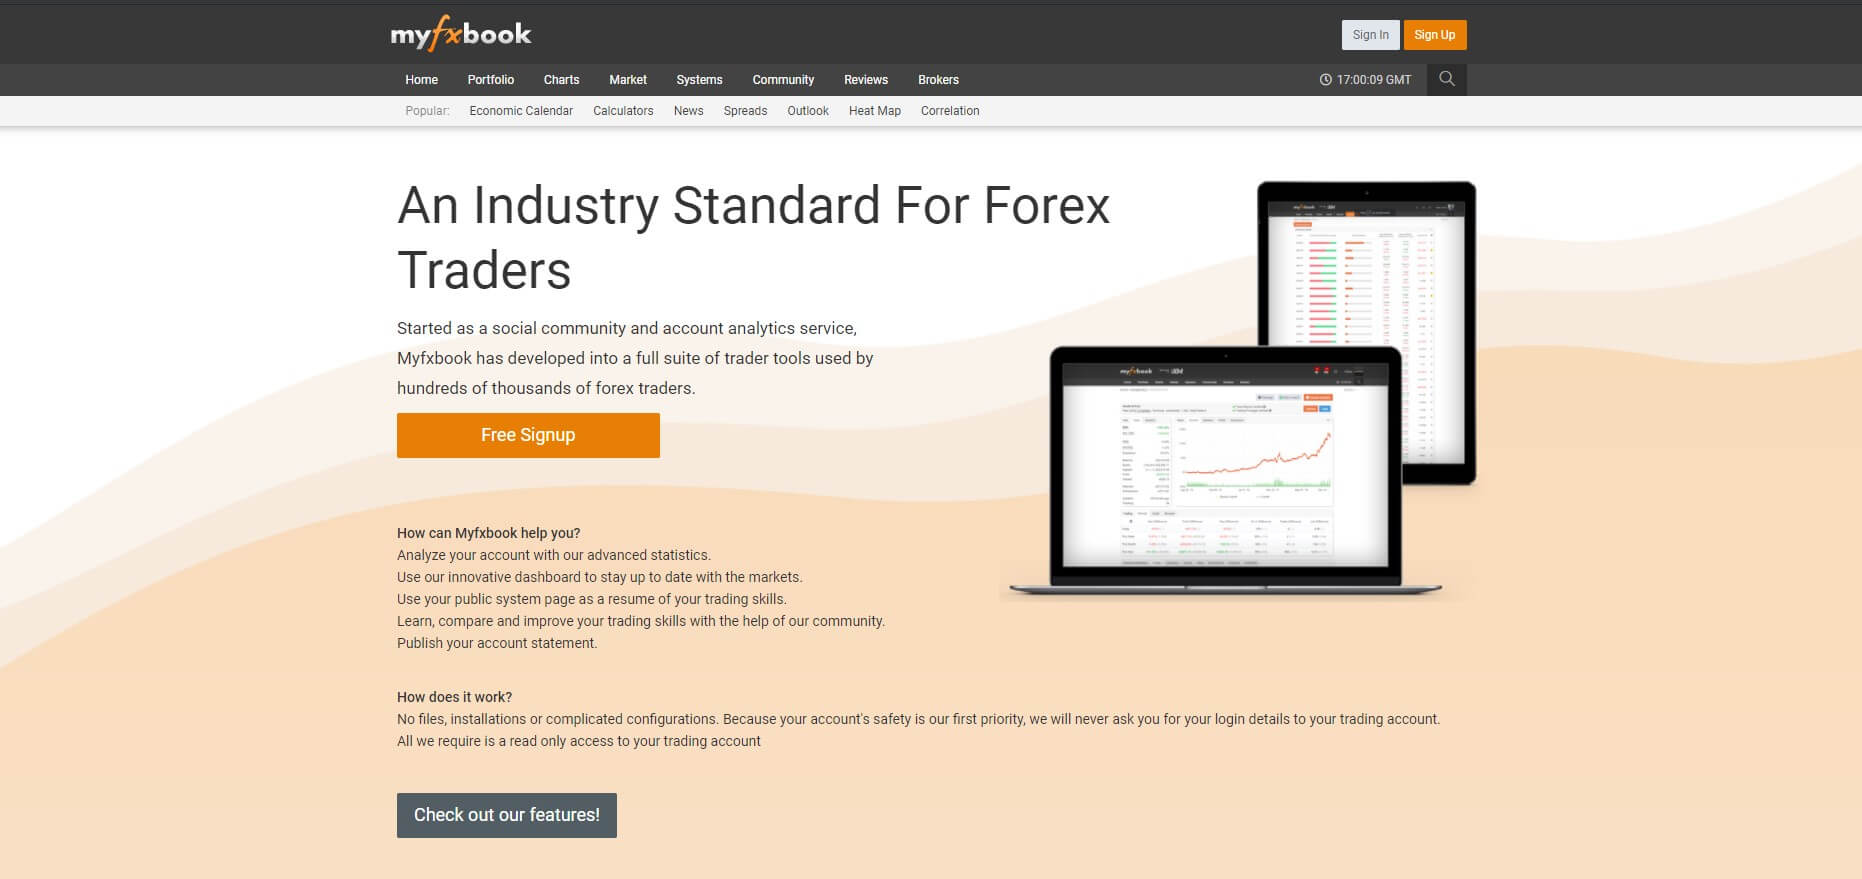
What is Myfxbook? How do I create an account? What can I find on this platform? What should I do if I want to be a provider of trading signals? In this guide, you will find everything relative to how to handle Myfxbook, a platform that has given a turn to social trading.

More than 100 online Forex brokers offer the services of the Myfxbook platform. It is a tool that has gone beyond social trading to become a provider of services related to the world of world-class short-term financial investments.

But what is the novelty of this platform? Until now, social trading communities had simply been confined to a particular broker. Thanks to Myfxbook, the community is growing. It is a multi-broker platform, with which signal services, Experts Advisors, programmers, PAMM accounts, copy trading, and more.

This feature, together with the number of parallel services it offers and the reliability it provides to copy traders, has made Myfxbook one of the reference trading pages. Through these paragraphs, you will discover how this platform works and what it can do for you.

What is Myfxbook?

This website was born as a trading account analysis system, a community created for traders in which transparency in the operation of those service providers took precedence. In turn, making the learning process easier for other less-experienced traders. Myfxbook is one of the first websites dedicated to social trading.

As we can see, everyone wins: expert traders can make profits by being followed (in the form of commissions) and novice traders can develop their knowledge thanks to the monitoring of other traders. A collaborative project where ideas are shared.

The main difference between Myfxbook and other platforms, also dedicated to social trading, is its ability to work with different intermediaries and the security it brings by showing real and verified results.

Myfxbook puts at your disposal the following benefits:

-Analyze your trading systems automatically and in one place, without the need for manual calculations.

-You can observe (and copy) other traders to discover how they do their trading and, in this way, develop your skills.

-You can share your system and your results to find customers and become a fund manager.

-Likewise, you will also have access to the audited results of other traders in cases where you need to hire some social trading service (copy trader, signal system, PAMM accounts, etc.).

-You will have the possibility to buy and sell trading systems.

-You will be part of a community, Myfxbook is a great social network dedicated to trading.

-You’ll access a wealth of news and market information services to make trading decisions.

How Do I Access Myfxbook?

The first step is to register in Myfxbook (in myfxbook.com), this page is available in Spanish. To be able to use the platform you need to have a trading account with one of the more than 100 brokers that are compatible with its use and allow you to participate in its program. The trading platforms supported are:

The process is very easy, what you should do is fill out the form that you will find on the left side of the home screen, after accessing the page (myfxbook.com). You must define:

  • Your username
  • A password
  • Provide an email address

They’ll send you an email from which you must confirm the newly created account and you can now access Myfxbook by logging in (i.e., entering your username and password).

After this first step, the next step is to connect your trading account with Myfxbook. This option is available in the “Portfolio” menu, by pressing the “Add Account” button. You can also do this task in “Settings” in the user menu (where your username appears).

With MetaTrader, you can link your account through Publisher or by downloading an Expert Advisor (EA) specially designed for this purpose. After that, you will have to install the app, after it is downloaded. It will ask you to select a specific account from the chosen platform (it is advisable to select an account that already has a history).

The following steps are done from the trading platform itself, we can anticipate that, in MetaTrader 4, these tasks are performed from the “Options” command, within the “Tools” menu.

In the “Activity” menu of Myfxbook (top of the screen), you will be notified that your trading account has been linked to your Myfxbook account.

Once your trading account is linked to the platform, in the “Portfolio” menu you can get a view of your trading statistics and associated account information. This will be of great use to carry out a thorough analysis of your profitability, your percentage of winning trades, drawdown, and other variables that you will have to take care of as a trader. Especially if you have multiple accounts, so you can monitor your entire operation.

Prepare Your Profile

On the right side of the screen, at the top, at the aforementioned user menu, you have everything to leave your profile ready in this new social network of which you are already part.

Your profile is your cover letter to other traders and will be essential if you intend to initiate or participate in any conversation, debate, ask questions, or market any social trading service.

To fill your profile you must select the “Edit Profile” submenu or enter “Settings” and select the “Profile” tab (both options are located within your user menu at the top right of the screen, where your name appears).

What Can You Find in Myfxbook?

It is necessary to say that some of these services are available without the need to create an account in Myfxbook, that is, without the need for previous registration on the page. However, once created, you will have full access to all the utilities that this platform has. As we have seen, the process of creating an account is simple and fast: it is worth taking this step. Among the menus of Myfxbook, you will find all this amount of tools that we show you below, menu to menu.

This first menu is related to the latest market news, very useful to keep you up to date. The menu is composed of:

News: access to the latest news related to the Forex market.

Economic Calendar: economic publications that move currencies.
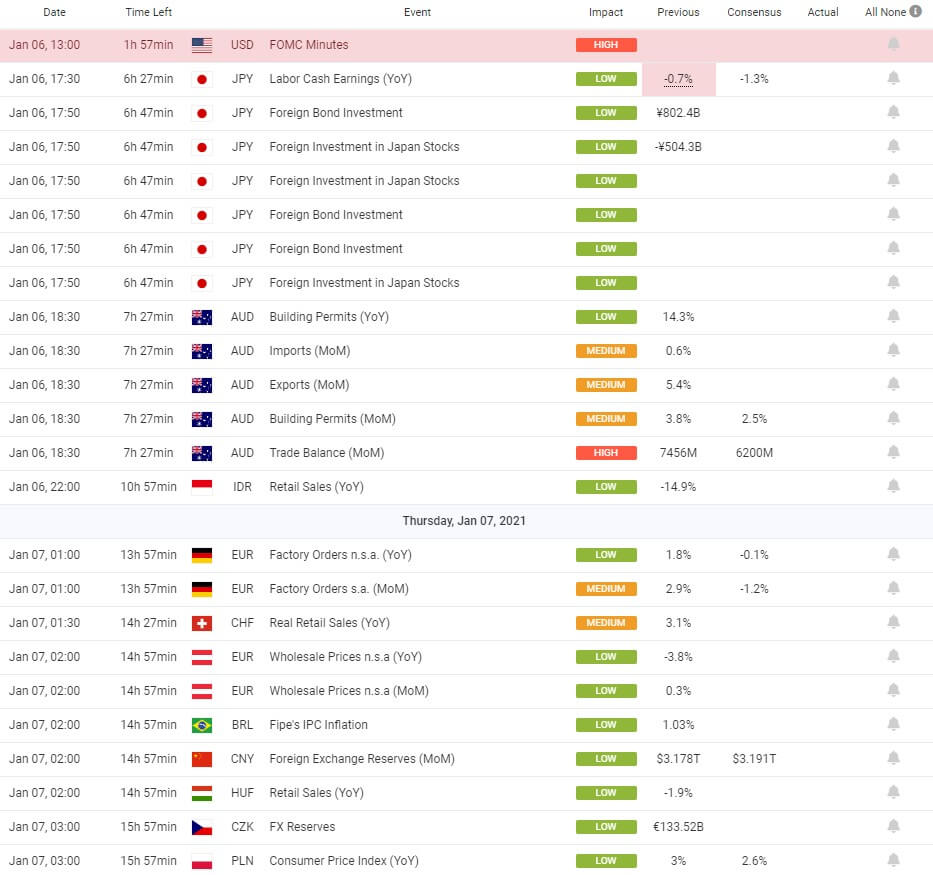
Recent Posts: Last threads in the Myfxbook forum.

Forex Calculators: In this command, you have available a series of calculators designed to make your trading easier (for example, pips calculator, margin calculator, Fibonacci, etc.).

Portfolio: From this menu, you can link your accounts and access their statistics. In short, you can analyze your trading to improve it.

Then we’ll see how we can perform this data public so that other traders can assess if it is advisable to contract some product or service that is intended to offer.

Autotrade: The Autotrade menu is the corresponding menu for replicating operations. When a trader is a signal provider and carries out a trade, Myfxbook sends a signal to all those trading accounts that follow it (that is, the accounts of its customers). In this way, the same position as the aforementioned supplier is opened or closed.

The menu consists of a submenu with the frequently asked questions of this service (FAQs), the help submenu, and a simulator that we can test the strategy of any provider before making the decision to follow it.

Soon we will see the requirements to be able to be a signal provider in Myfxbook.

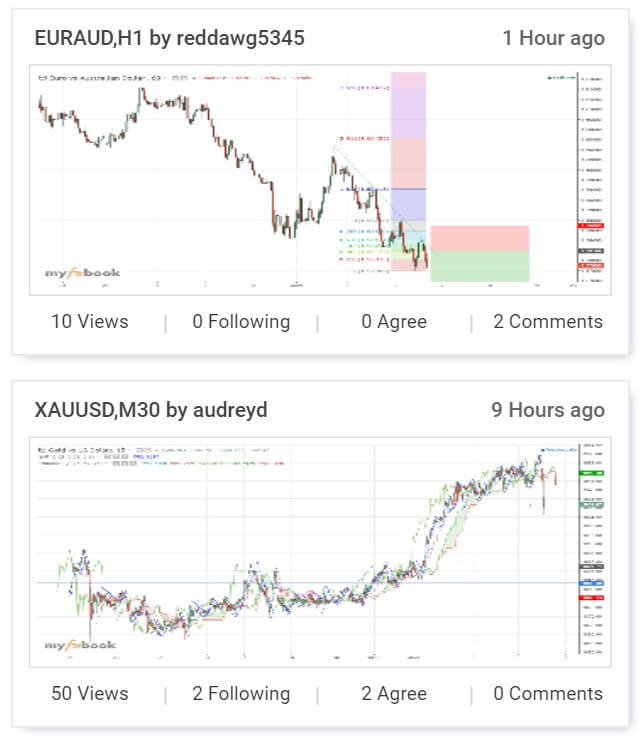
Charts: Charts are one of the tools that Myfxbook provides to members of its community. Any user can create an analysis and post it so that other traders can view and comment on it. It is possible to see the most followed, the most recent, or the most commented charts (among others). Everything depends on the specific option you choose in the submenu.

You also have the opportunity to create your own analyses and share them in this social network, in this way analysis is shared and learned through shared opinions. It will also help you boost your personal brand as a trader.
Markets: In this section, we will find several sub-menus with information about the Forex market useful for making trading decisions:

Technical Analysis Patterns: shows the different Japanese candle patterns that follow each other in major currency pairs. The temporality in which they appear and the implications they have (bullish or bearish) can be defined. You can also comment (and see the corresponding comments).

Volatility: you can visualize the volatility, in pips, of the main currency pairs (in several seasons).

Heat Map: Do you want to know which are the hottest currencies? Here you are indicated the strongest and weakest in different time periods.

Correlation: The relationship between currency pairs is important to avoid overexposure to the risk of a particular currency pair. There are also trading strategies based on correlation. In this command, you can have it under control.

COT (Traders’ Commitments) Data: data obtained from Commodity Futures Trading and in which you can read the positions of the participants of the forex futures market, to get an idea of what they think.

Liquidity: You can look at the estimates of trading activity in the market in this subsection.

Systems: This menu is only visible to all users who have created an account in Myfxbook. In it, you will have the opportunity to visualize the different trading systems and strategies of those users who have made this information public, in order to be followed. Through the statistics provided by the platform (and that we have already seen in a previous image).

Also, you have the option to follow any of them that you find interesting, by clicking on the button “Autotrade”. You can have direct access to the most popular ones by selecting the corresponding submenu. You can also compare different trading systems.

Remember that one of the advantages that Myfxbook provides is the transparency and reliability in the statistics of the different historical data, the accounts are audited at the time they are linked to this platform.

Community: This is a communication space, where you will be able to ask, share, debate, and learn about any topic of trading in the Forex market.
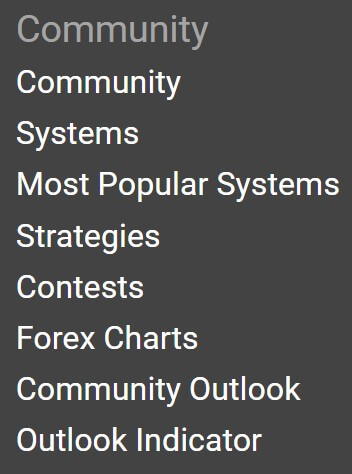
Beyond the general forum, this section is composed of several sub-menus, in which you can see conversations regarding:

  • New traders
  • Experienced traders
  • Investment systems
  • Strategies
  • Programmers
  • Suggestion box
  • Contests
  • Technical patterns
  • A feeling of community

Any user can open a new discussion thread. Being proactive in this aspect improves our visibility within the platform and, therefore, we will be more transparent and reliable traders. In addition, it is a good meeting point to share ideas and market products and/or services related to currency trading.

Comments: In this section, you can access, in addition to participating directly, various comments, reviews, ratings, etc. about:

  • Brokers
  • Automatic systems
  • Signal providers
  • VPS services
  • Programming services of EAs
  • PAMM services
  • Reimbursement programs
  • Trading platforms

As we can see, once again, Myfxbook stands out for the transparency it offers. On this occasion, the users of the platform are the judges of any service offered. There is nothing like seeing the ratings and reviews to check the reliability of any product or service.

Competitive examinations: As its name suggests, this menu will help us to be aware of the different trading contests organized by different sponsors. We will be able to see, also, the contests that at that time may be active.

If we access the menu, we will have the relevant data to decide whether or not we are interested in participating in a trading contest. Data such as:

  • Sponsor
  • Number of competitors
  • Whether it’s a demo or real
  • Awards
  • Winners (if the contest is over)
  • Start and end dates of the competition
  • Statistical analysis of the operations carried out

Without a doubt, it is another advantage of Myfxbook: to have under control the trading contests and all the information about them.

Brokers: This section is a comparative table of the different online financial intermediaries trading in the currency market. From it, we can see, compare, analyze, and decide which broker is the most interesting for our operation, depending on our trading style and our preferences. We will be able to undertake a follow-up of the spreads they offer, swap commissions, as well as other costs and promotions they can offer us.

Hiring a broker adapted to your needs is essential to develop a good trade. Through this menu you can see all the information of interest in this sense: one more reason to have Myfxbook among your favorite trading pages.

How Can I Become a Trading Service Provider in Myfxbook?

As mentioned above, Myfxbook gives you the opportunity to promote yourself as a trader, offer a range of services, and develop all your skills in the currency market. However, to market any social trading service you need to make public the statistics of at least one of the accounts you have linked to this platform.

Myfxbook stands out for offering a real, verified, and transparent information of the different traders, so, to have the opportunity to be a top trader, you must make a good operation and this contributes to the professionalization and regulation of this professional activity.

To make your trading account data public, simply click on the “Invitations” tab (in the “Settings” or “Portfolio” menu) and mark all options as public.

Trading providers earn a 0.5 pip commission on each account subscribed for each winning trade. If you are content to be a successful trader, you must first learn and take experience in the markets. In this respect, Myfxbook will also be of great help to you thanks to the information and possibility of communication it offers.

To access the Autotrade service and to be a signal provider, the following requirements must be met:

-Only real accounts with MetaTrader 4, verified and connected to Myfxbook, are accepted.

-The account must credit a minimum balance of USD 1,000.

-You must have a history of at least three months and at least 100 operations.

-The historical drawdown must be less than 50%.

-The historical return should be greater than 10% and greater than the historical drawdown.

-You must have earned an average of 3 pips per operation.

-As for the duration of operations, the average will be more than 5 minutes.

-The system should not use any martingale technique.

In other words, it is necessary to demonstrate some value in trading in order to be a provider of social trading services. It is another feature that defines Myfxbook as a secure and reliable platform.

The Reality of Myfxbook

The reality of this platform is that you will find many martingale systems and hidden scams. Most of them may look very promising but then they have a big fall and they get out of the way. In the end, most are hidden under a username.

So, all that being said, in my case I take advantage of this tool to get statistics from my accounts and little else. You can access profitable systems and they can give you an idea of how they work if you’re smart looking at some of their statistics, but remember that it’s a mine of martingale and grid systems, which we already know ends up blowing up accounts. So far all this guidance on this well-known tool within currency trading and trading systems, forex brokers.
Categories
Forex Service Review

A Quick Overview of J. Welles Wilder’s Parabolic SAR

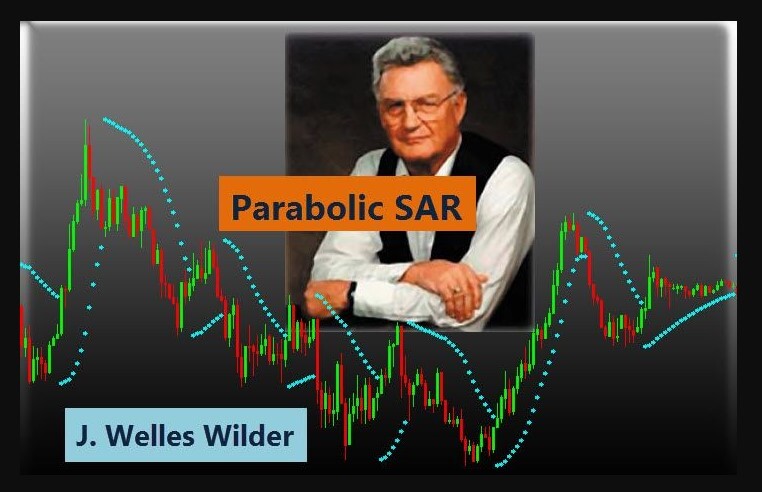
The parabolic indicator SAR (parabolic stop and reverse) was created by J. Welles Wilder, and is used to find possible reversals in market trends. Points to the table show the levels of support and price resistance. This indicator is included in both MT4 and MT5, and default settings are Step 0.02, Maximum 0.2.

How to Use Parabolic SAR

So far, we have done several reviews where we have seen indicators that focus mainly on capturing the beginning of new trends. While it is very important to be able to identify new trends well, it is equally essential to be able to identify where a trend ends. After all, what good is a well-synchronized input without a well-synchronized output?

A parabolic SAR places points on a graph that indicates possible reversals in the movement of prices. These points change from being under the candles during the uptrend to being above the candles when the trend is reversed in a downward trend. This may sound complicated, but the great thing about SAR parabolic EA is that it’s straightforward to use. It’s really very simple.

Basically, when the dots are under the candles, it’s a BUY sign. We’ll have a sales signal when the points are above the candles. We are probably facing the most accessible indicator to interpret because it assumes that the price is going up or down. After saying this, this system is best used in trend markets. You should not use this EA in a hectic market where the price movement is sideways.

Using Parabolic SAR EA to Exit Operations

You can also use Parabolic SAR to help you determine whether or not to close your trade. We have performed a test of this, and we have seen how it worked as an output signal in the pair EUR/USD. When EUR/USD started to fall, it looked like it was going to keep dropping like a rock. Any trader would probably wonder how low it would still go. When at a certain point, three points were formed at the bottom of the price, suggesting that the downward trend was over and that it was time to exit those shorts. If you decided stubbornly to cling to that trade thinking that EUR/USD would resume its fall, you would probably have erased all those gains as the pair finally ended up going up.

Conclusion

We are looking at a very interesting tool that can certainly boost profits. Of course, configuring it correctly is important, but this is simple to do. It is ideal to complement a variety of effective expert advisors. In fact, there are plenty of Parabolic SAR based EAs located within the MQL5 marketplace being offered both for free and at a cost at this time.

Categories
Forex Service Review

Royal Wave Pro MT4 Review

Royal Wave is a Trend-Power tool based on a price adjustment algorithm that performs statistical analysis of price movement to predict and locate low-risk entry and exit areas. This alert system generates well-timed trading signals that give the trader enough time to make the most appropriate trading decisions.

Features of the Royal Wave Pro:
  • Algorithm of trend power.
  • Low-Risk Entry and Exit Zones.
  • Predictions for areas where the asset is overused and oversold.
  • Rich Alerting System (these are sound alerts, SMS notifications, Zone Flasher, etc.)
  • The oscillation range from 0 to 100 facilitates the understanding of the signal.
  • Analysis of various terms and currencies.
Areas of Entry:

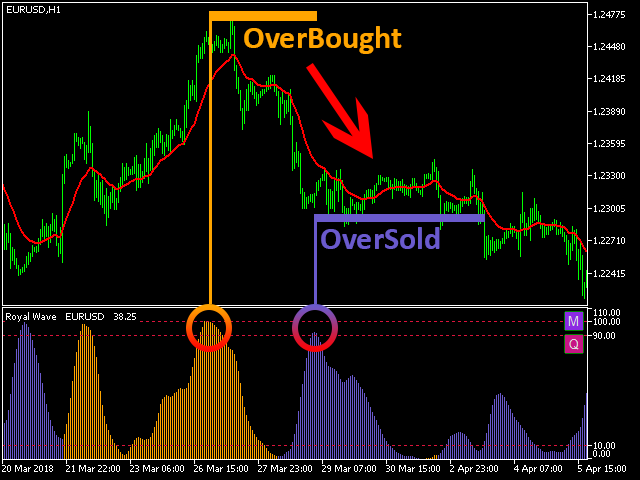
Once the value of the oscillator is almost zero it means that there will be a significant movement in the price shortly because traders in most installments agree on the current price and have come together to move the price of a big step in one direction. Therefore, this indicator predicts entry areas with a low risk where the price only seems to move in one direction until the moment the oscillator reaches the exit zone. The entry zones are always going to be the beginning close enough to a big move in price.

Zones de Salida (Exit Zones):

When the oscillator reaches the output area in the 100 environments, it is predicting an overbuy when the color is yellow, or an excess when the color is blue. This zone can be used to exit an operation or update a stop loss level due to the high probability of reversals in these areas.

The exit points of the zones are potential candidates to be points of reversal in a trend. By using the real-wave signal array, some of these areas can be identified as low-risk to enter a reversal trade.

Trend and power supply:

The oscillator value represents the current power of the trend ranging from 0 to 100. When energy is rising, a yellow color indicates a steady upward trend, and blue color indicates a strong downward trend. A decreasing power shows consolidation, which means that there is no trend in price, and the trader must wait for the entry zone.

Signal Matrix:

Gives an informative view of various symbols against all time frames in a matrix. Each cell in this matrix is a brief representation of the price behavior of a symbol from a single time frame.

Transversal Window:

View and compare data from an arbitrary symbol and time frame within a graph with a different symbol and time frame. This tool can be used to develop multiplayer and multi-timeframe strategies.

In short, we are talking about a reasonably comprehensive indicator. Created in May 2019, it has already had some updates from its developer Ehsan Tarakemeh. At the moment, you don’t have any comments from users, but personally, we think it is an indicator that can be very useful in our trade, and we would put this indicator on the waiting list so that it can be added over time.

It would be advisable to use the free trial version to get to know it better. Its selling price on the MQL market is 129 USD, or 69 USD if you prefer to rent it for 3 months.

Categories
Forex Indicators

Dangers of The RSI Indicator

Relative Weakness or Relative Strength? The RSI is a popular indicator but it is not without its detractors. If you go online to learn more about technical forex trading – and who these days doesn’t? – then you will surely encounter a lot of people recommending the RSI. Indeed, most people you see on social media or YouTube who talk about the RSI will talk about it in glowing terms. This is why we think it’s important to bring you to the other side of the story. There is a growing number of technical forex traders out there who dismiss or outright criticize the RSI and this article is here to bring you their side of the story and the arguments they deploy to highlight the major problems with the RSI.

Popularity Contest

If you go online and do a search for all of the most popular indicators out there, you will likely find that you’ll get more hits for the RSI and just about any other indicator. You’ll hear about it all over social media whenever you’re trying to learn from others about forex and you’ll see video tutorials mentioning it or even promoting it. More than that, you’ll see it on your TV screens when you turn over to see the financial news and you will have heard about it from the very people you relied upon to teach you forex trading in the first place. Already here there are several serious problems to point out but we’ll come back to those further on in the article. First thing’s first, what is RSI?

Brass Tacks

The Relative Strength Index is an oscillating indicator that measures the velocity and magnitude of price movements. What you need to know though, is that it ultimately tells you if something is over-bought or over-sold. “Wait a minute, what do you mean over-bought or over-sold?”, you cry at your screen. Indeed, that’s one of the things about the RSI you should know. It was invented by a guy who is the father of a number of technical indicators, J. Welles Wilder. But the thing is, he invented it primarily for equities trading, where knowing if a stock is overbought or over-sold is pretty useful information because stocks – and commodities, where it is also heavily used – have an intrinsic value, while forex does not.

That isn’t to say that a currency pair can go as high or low as it wants, there are limits because governments or national financial institutions will eventually step in and rein things in. But that can happen thousands of pips down the line and there’s no guaranteed or even foreseeable limit where that kind of institutional intervention is going to kick in. Moreover, there is another issue with the RSI’s history, beyond it being invented for trading stocks, and that’s that it was invented back in the 1970s – literal decades before the kind of retail forex trading we are all doing was even a thing.

How Does It Work?

In its basic configuration, the RSI measures values from 0 to 100, where you will typically have lines at 30 and 70. When the reading goes below the 30 line, this indicates that a security or currency is oversold or undervalued and when the reading goes above the 70 line, this indicates that it is overbought or overvalued. As a default, the RSI will cover the previous 14-day period and is supposed to be overlaid against your chart to provide you with trade signals.

For example, if the RSI verges off into overbought territory and then drops down below 70 again, this should indicate that there is about to be a downward trend and you should go short. Conversely, if the inverse is happening with the RSI crossing into oversold territory and then rising back above the 30 line, this should indicate a reversal and the signal will be telling you to go long. That is how it’s supposed to work but – as many traders are increasingly keen to point out – there are several problems with that so let’s look at some of those.

The Problem of Popularity

As any high school prom king or queen will tell you, being popular is not always all that it’s cut out to be. In terms of the RSI, for us, it is important to understand why it’s so popular in the first place. Firstly – and this is pretty understandable actually, especially for traders who are just starting out – it is dead simple to use. Even if you’ve never encountered it before, just the short explanation above will tell you a huge chunk of what there is to know about using the RSI.

There isn’t a problem with simplicity per se – something being simple should not be a reason to avoid it. If there is a simple and easy to use indicator out there and it works, then just go ahead and use it. The problem comes from people who expect to be able to find one indicator and use it to consistently make money by trading on the back of that one indicator. But you should know by now – regardless of where you are in your trading career – that there are no silver bullets. In fact, if you think you’ve found a silver bullet that’s easy to use and is simple and everyone else is using it, you’re in big trouble.

But that isn’t the real problem with the RSI’s popularity. The real problem with the RSI’s popularity is that it is popular. If that sounds like a tautology, it is. But in forex trading there is a big problem when everybody is doing the same thing so when something’s popular, it’s time to start hearing those alarm bells. If you’re doing something in forex trading that is popular, something everyone else is doing, you’re running with the herd. And if you’re running with the herd, there are big players out there, who have way more influence in the way the market behaves, who is going to notice that the herd are all moving in a particular direction. The herd as a whole are going to be on the radar of the big players who will manipulate the mechanics of the market to take advantage of that big clump of traders who are all doing the same thing and sending their money in the same direction.

Of course, you’ll eke out a win every now and then – that is, the big players will let you have a win from time to time – because this keeps you in the game and lets them pick you off the very next time the herd gets going together. This doesn’t work the same way in the equities trade, so if you’re used to that, get ready for something different. In forex trading, you want to steer clear of the herd and stay away from what’s popular as much as possible. If that were the only problem with RSI, it would be enough to make smart traders drop it immediately. But there are other problems lurking in there and if you are still clinging on and conjuring up counterarguments in your head right now, you should be aware of the other problems some traders are keen to highlight.

The Problem of Credibility

The RSI is not only one of the most popular indices out there, but it has also been given the weight of credibility by television. You will have noticed that financial news anchors will often pull up a chart of a given currency pair and show it on your screen referenced against its RSI. Now, why do they do this and why is it a problem?

The simple answer to why they do this is that they don’t know any better. Most financial analysts on television are not traders and certainly not technical traders. They make their living by being smart and credible and being extremely good at talking about the financial markets. They do not need to spend their time trading, researching, testing, and backtesting indicators. Moreover, they know full well that their audience is also not, for the most part (like 99%), technical traders. So neither are they in a good position to properly present and explain indices more complex than the RSI nor would their audience appreciate it because they would struggle to follow along.

So why is this a problem of the RSI and not just a problem of how the financial news treat forex trading? Well because if you are just starting out trading or have been trading using the RSI (with mixed results), seeing these prestigious financial news shows flashing that very same indicator up on the screen will probably mean you will give the RSI more weight than it deserves. If it deserves any at all. You might use it and lose money or you might continue using it beyond the time when you actually become aware that it isn’t working. All because it has been lent this credibility by being on television and being discussed by smart people in suits.

The Problem of Teaching

Speaking of smart people in suits, another reason why people continue to use the RSI and why it is so popular is that it is taught to people learning how to trade in just about every forex trading course out there. When you’re just starting out and you don’t know any better – and crucially, you haven’t built up any of your own trading experience in a meaningful way – RSI looks pretty valid. It is kind of exciting because you are taught this indicator that tells you to wait for certain conditions and when you see them, it gives you a signal to trade.

It’s really easy to learn and you pick it up with no effort at all (are those alarm bells ringing yet?) – all you have to do is look at your chart and identify when the RSI is giving you a signal to trade and just take it. If you’ve learned anything about forex trading by now, you should hear how unrealistic all of that sounds. What’s more, the RSI really easy to teach, which is why it has found its way onto all those courses and video tutorials. It doesn’t take a rocket scientist to teach it and you don’t have to have a foundation course in brain surgery to learn it.

But that’s where you have to question who it is that’s teaching you to trade. Is the person you’re learning from an actual trader? Chances are they are not. If they are making their money by teaching forex trading or by making forex tutorials and courses and then selling them on, there’s a good chance they don’t have to trade for a living. They just want to teach this stuff and, if you’re starting out, you’re hungry for knowledge and just want to learn. As a result, they will show you easy-to-teach indicators, like RSI, that fit neatly into their course material and are easy to back up with simple examples that will make them look like they’re teaching you something important.

There’s a problem with those examples, however. In almost all cases, when somebody is showing you an example of how RSI works, they’re showing you a cherry-picked example. They’ll go out and find the perfect moment, on a chart of the perfect currency combination and set it to the perfect timeframe and then they’ll say, “see here where the RSI crosses back down under 70, that’s an indication that the price is about to trend downwards and here you can see that that is what’s happening”. But even in these best-case scenarios, if you look at the chart, you’ll probably be able to see a couple of cases of the RSI telling you to trade one way but the price going the other way or stagnating. You can try it now, go to YouTube or on social media and find somebody singing the RSI’s praises – there’s a 90% chance that you’ll be able to see for yourself that the example (the one that they chose) is full of holes.

Ultimately, the reason RSI gets taught so much to just about every last living soul who wants to learn about forex trading, is that the teachers themselves don’t know any better. As we said, they are almost certainly not traders themselves, and, more to the point, there are thousands of indicators out there to choose from. A great many of these are more difficult to teach than the RSI, less likely to throw up what appear to be sure-thing examples and more likely to work in conjunction with other indicators in a trading system that’s adapted to the needs and habits of the individual trader. Well, how do you teach that? Surely it’s just simpler to show people the RSI. It is and that’s why they do it.

The Problem of Success

With all of its popularity and credibility and the fact that it was taught to you when you first started trading, the RSI gets used a whole lot. Now, if everyone was learning the RSI and using it and it failed every time, people would simply drop it immediately and it would be resigned to the ash heap of history. But it doesn’t work that way. In fact, it’s much more insidious and sinister than that. The main reason people continue to persevere with the RSI is that even though it is probably losing them money in the long term, they have occasional successes with it, which reinforces all those cognitive biases generated by everything we’ve already covered in this article. It’s called gambler’s ruin or casino theory.

If you went to a casino in Las Vegas and you and everybody around you was just constantly losing money – never winning, not even 0.001% of the time – nobody would ever go to a casino again. The way the house keeps you coming back for more is that you do occasionally get that blackjack or the roulette ball does sometimes land on your number. It doesn’t happen nearly as often as the house wins but it happens often enough that it gives you that kick of adrenaline and clouds your judgment so you keep gambling.

Do not underestimate the power of that rush from winning. It will keep you in a casino for ten hands beyond the one at which you should have stopped or keep you using an indicator that you have seen doesn’t work consistently but that brought you that one win a few months ago and boy didn’t that feel good. The big players in the forex market understand the power of that thrill and will use it as mercilessly as the casinos in Vegas or Macau or anywhere else in the world. They reel out a little slack and the herd lap that up and comes back for more.

The Final Nail in the Coffin

There is a counterargument to much of this and if you use and like the RSI, you’ve probably been reading through this like a coiled spring, waiting to counter with: “But the RSI does work in range-bound markets!” Well, there are a lot of seasoned technical traders out there that would respond like this: If you’re seeing a ranging market, it’s probably already over. Forex markets don’t range forever and identifying a ranging phase in the market is not as simple as textbooks will have you believe. You won’t know when it’s coming and when you see it forming it will likely be too late to take advantage of it using the RSI.

The problem is that there is a glut of reversal traders out there relying on the RSI to call out reversals for them and they outnumber the people who are trying to follow a trend when it does break out. It’s the very reason the price trends as long as it does sometimes. When it does, it sucks the life out of those reversal traders over and over again – erasing any gains they made when the price was consolidating.

Try It and See

Of course, the best way to be really sure that the RSI is flawed is not to listen to an endless to-and-fro of well-thought-out arguments. The best way to be sure is to take the thing to the testing range and see if it falls apart. One good way of doing that is to open a demo account and trade it using the RSI exclusively. Use this account to track the wins and losses over a meaningful period (anything less than a couple of months is too short) to see where it gets you. Sadly, most traders are not sufficiently disciplined to go through all of that and will not benefit from that learning experience but demo-testing an indicator like that does reveal a whole lot about it.

The alternative is to look at a historical example and analyse those moments where the RSI was giving a trade signal. Chances are you would see very few examples where the signal would actually have paid off. The way to do this is to take a popular currency pair or a pair that you actually trade and look back over a year’s worth of data. Pull up the RSI indicator, compare it against the price chart, and go through each and every time the RSI pinged a trade signal. Check forward from that point to see whether following that signal would have paid off but be honest with yourself about where you would have set your stop/loss and take profit limits.

You will find that, in most instances, following the RSI will completely kill you. That’s not to say it never throws up a win. It will give you a win from time to time but the losses will outweigh these infrequent wins over time. And not only that but the wins will more often than not be pretty mediocre and the losses will not. To sum up, there are a lot of traders out there who are very disparaging about the RSI and now you know why. If you feel like this is sound advice, don’t take their word for it, test it out for yourself in a demo account and see if it really lives up to any of its hype.

Categories
Forex Indicators

Which Indicator is Best for Trade Management and Risk Measurement?

Out of the thousands of indicators out there that technical forex traders add to their charts, there is one that is often overlooked. Sometimes even ignored. Indeed, though it is used relatively frequently, many traders often forget that it is part of their process. Yet, in reality, it is one of the most important indicators to have in your toolkit.

That indicator? It is, of course, the ATR.

What Is ATR?

Many of you will, of course, already know what ATR is and how it works as well as you know the back of your hand. It never hurts, however, to refresh that knowledge and take another look at it. Put as simply as possible, Average True Range is a measure of volatility. What it does is take a look at the last fourteen candles (it doesn’t have to be fourteen but that’s usually the default setting) and tells you how much movement there has been. This will be expressed in the number of pips the currency combination you have selected has moved, on average, over those last fourteen candles.

It’s a moving indicator so you need to take care when you’re measuring it and whether the most recent candle is throwing off the rating in some way. So, if you’re day trading, for example, it is best to wait to measure the ATR just as the candle you’re currently on is coming to a close. That way your measurement is of fourteen complete candles – which will give you the best reading.

And that’s it. It’s that simple.

But Why Is ATR So Important?

The thing is, ATR is simply not one of those glamorous indicators. Which is probably why it often goes so unnoticed. In fact, many traders don’t even have it up on their chart the whole time. But that doesn’t mean it isn’t a key part of their system. Perhaps even the most crucial one. That isn’t to say that it is the best indicator or some kind of silver bullet. But it needs to be part of your system because it provides you with two key pieces of information.

Firstly, by telling you how much a currency pair is moving over a given period, it can help you to make sense of your other indicators and tell you when to trade – or rather, when not to. For example, say a currency pair has already moved beyond its average range but your strategy is signaling that you should go long. Combining the ATR into your other indicators can help to show you whether what you’re dealing with is a breakout or whether it would be better to go short or simply not trade at all.

But, here’s the key thing. The ATR is not a silver bullet. No indicator on its own is. It must be just one part of your strategy and not the driving force behind it. You shouldn’t use the ATR on its own to decide whether you should pull the trigger on a trade or not. If you think any single indicator can do that, perhaps it’s time to duck out of trading altogether or, at the very least, get back to the classroom.

It is also useful to give yourself a little history lesson and use the ATR to explore how a currency pair has performed in the past under different circumstances. Crosscheck that with any significant news events you know about and it can provide a useful picture of the volatility of a currency combination – ultimately helping you to have a better understanding of what to expect.

Managing Risk

The second useful thing the ATR can give you – and according to some this should actually be its primary function – is that it can help you to manage how much you risk on a given trade. You should not make a single trade without consulting it. So, how does that work? Well, let’s say you’re doing everything right. You’re avoiding being drawn into trading with the herd. You’re ducking and diving and staying clear of the big players are – avoiding those hotspots where everyone else is trading. 0You’re using your system to identify when the optimal moment is to trade – getting all of your indicators to line up to make sure it’s the right moment and whether to go long or short.

Before you pull the trigger, you need to know how much to trade. And that’s where the ATR comes in. You need to factor it into the process you go through – make it part of your checklist – because in that sense it is probably the most useful indicator you have. It allows you to gauge risk in a measurable way so that you can improve how you manage your money and the amount that you invest per trade for any given currency pair. Now, the number one question here is how much money you put on a trade. But it doesn’t make sense to speak in terms of dollar amounts in this example. The ATR can’t tell you to put, say, USD 5,000 on a yen vs. pound trade. Neither does it make sense to talk in terms of lots, because a lot on the pound/dollar pair will be a different amount to a lot on another currency pair. Instead, it’s better to think of how much you are trading per pip.

To do that, compare the ATR for two currency pairs. For the sake of the example, let’s take a commonly traded pair like GBP/USD. Depending on what’s happening in the news cycle but assuming no dramatic news has been happening, this pair is likely to turn out a pretty low ATR. Perhaps something like 14 pips. If we compare that to the ATR of a more volatile pair, for example, GBP/AUD, here we might see an ATR of 115 pips. Some pairs will blow that out of the water and will easily generate ATRs of 200 or 300 pips regularly. And a lot of traders will look at that volatility and will steer clear of trading in those waters.

Sticking with the example of the dollar/pound and pound/Aussie dollar pairs, it doesn’t take a mathematical genius to look at the ATR and see that 115 pips is about eight times as many as 14 pips. That means the pound/Aussie is moving about eight times as fast as the dollar/pound. As we would expect given the respective volatilities of these pairs. So, armed with that knowledge, how do we trade it? It couldn’t be simpler. Let’s say that in this example you’re trading the dollar/pound at 16 dollars per pip. You can trade the pound/Aussie with full confidence, simply by trading it at eight times less. In short, when trading a faster currency pair, use the ATR to modify your per pip trading amounts to correspond to the increased volatility. In so doing, not only are you managing risk but you are also managing your overall approach to trading.

A Whole New World

Many, if not most, traders out there – particularly the less successful ones – start off by trading equal amounts per pip on different currency pairs, without taking into account the different speeds at which they move. This makes no sense. To all intents and purposes, by doing that they are saying that they have equal confidence in their trades across currency combinations of different volatilities. The danger that exposes them to could really take a chunk out of their account very quickly indeed if things go south. Traders who do that are taking on unnecessary risks because they are not mitigating the risk of greater volatility.

The ATR allows you to see that risk and modify your behaviour accordingly. It can be a tool for managing how much you trade per pip on a given pair and, consequently, it allows you to profile your trades for risk. This ability can introduce you to a whole new world of more exotic currency pairs because it enables you to broaden the spectrum of the pairs you trade. Placing the right amount of money per pip on a trade mitigates the risk of volatile pairs and means that you can add new currency combinations to your trading schedule without the fear of being towed under by fast-moving pairs.

In a Nutshell

The most important thing to take away from all of this is that managing risk and managing your money are the most important functions you have when you approach forex trading. If you can get these two right, you can separate yourself from the less successful or outright unsuccessful traders. It is the thing that will ultimately determine whether your forex trading career is going to result in more money in your bank account or less. And the primary tool you have at your disposal for mitigating risk and managing the money you invest in trades is the ATR. Even if you don’t have it on your actual chart – and many traders chose not to – you should still use it for every single trade you make.

Categories
Beginners Forex Education Forex Basics

Why Popular Tools are Bad for Your Trading

A vast majority of people keep using certain tools that a portion of successful forex traders describe as utterly futile. In this article, we are going to assess the basis of such opinions and possibly shed some new light on the topic of technical analysis tools in spot forex trading. More specifically, we are going to provide ways in which you can stop yourself from squandering any more money by offering some direct and practical advice. If you keep finding yourself in a precarious situation where you cannot seem to prosper or grow as a trader, learning about these 12 tools may provide you with new and innovative ideas and perspectives you can incorporate in your trading in this market.

Some references go as far as to say that the number of traders who are experiencing financial hardship, constantly spiraling downward, is as high as 99%, if not above. Some of the reasons behind such lamentable statistics may have a lot to do with one’s money management skills. At times traders have quite a good idea of which entries they should make, but they lack the investment mindset to back these skills up in a more sustainable manner. As one of the essential topics in the world of trading, this is unfortunately seldom discussed, along with today’s topic. Aside from possibly lacking an efficient system to support your intelligent investment and trading decisions, you may be also lacking the knowledge or experience regarding tools, often unfoundedly glorified by various people.

While educating yourself on tools, techniques, and strategies is key in this world, we may often come across information suggesting the use of some outdated tools and indicators, which can be even quite detrimental to your attempt to follow current trends. What is more, some of these were not even developed for forex trading in the first place as they are based on concepts used in trading equities and gold, among others. It is these basic concepts which forex market revolves around that you strive to grasp and apply intelligently and strategically: understanding the nature of fiat currencies, the impact of money management skills, the role of big banks, the importance of trend trading, and the detriment of trading reversals to a trader’s overall success. At this point, every trader must accept the need to eliminate the information which is not beneficial because no professional algorithm can overpower flawed thinking. You can now begin to grasp how disinformation and misinterpretation can impact your development and finances, which naturally involves the necessity to discriminate between different tools and indicators you can use in your chart.

Started in 1996, the spot market is only a little over one decade old, which is why we currently have approximately 10 thousand indicators and tools at our disposal. Nevertheless, we must be aware of the fact that most of these were not specifically invented for the needs of forex trading. Like with various other gadgets that lost their importance or were simply replaced by more modern versions (e.g. pager vs. cell phone), we can logically conclude how even the world of trading requires modernization to be able to produce realistic results. A tool designed in the 70s for the stock market can possibly render some success, but you know that an innovative tool can lead you to a much better, and much more secure, outcome. Therefore, let us see which 12 indicators fall under this category and why we should consider turning to some other tools at this time.

ADX Indicator

The average directional index (ADX) was developed in 1978 and the reason why traders use it is twofold. People mostly use it for the purpose of measuring volume, which is absolutely understandable and needed in forex trading; however, the volume meter is simply too slow and, even if you try to make it work faster, the information it provides can become severely inaccurate. Another important component of this indicator, Directional Index (DI) which tells traders whether their currency pair is bullish or bearish, has such a major lagging issue that it affects the whole process. Therefore, due to using this indicator, you are not only at risk of making entries based on false data, but you also enter the market too late, which together make this indicator increasingly unreliable.

Trend Lines

As there is no one correct way to draw trend lines, which involves a great degree of imprecision, this approach may easily be least worthy of your time. Differences between the way trend lines are drawn can be so vast that a trader may not know how to surpass this seemingly unsurmountable problem – show the focus on price tops or where the price closed and what should they do if a price has broken the trend line? Everyone seems to have their own idea of what to do in this case, but these opinions differ to the extent that forming a uniform approach seems impossible. Furthermore, with such a great number of possible options, we may be able to draw several trend lines in any chart. Unfortunately, most trends are already over by the time we discover them. If you experienced a situation where a price did not align with your trend line, it is because the notion of diagonal support or resistance is entirely nonexistent, which supports the belief that trend lines should not be used in charts to gain any relevant information.

Stochastics

Developed way back in the 1950s, this tool is based on terms such as overbought and oversold that meaningfully and essentially have no relevance to trading fiat currencies, which alone is a proof strong enough for you to opt for another indicator. Moreover, it is highly unreliable in trading stocks too because the majority of signals it gives are false even in case of range-bound prices. What is more, traders inevitably face disappointing results whenever the prices are trending because, with a commonly vast number of reversal traders, stochastics will simply keep giving inaccurate information. This further implies that all the money traders make during the range-bound periods will go to waste once the prices start trending. Therefore, regardless of whether you are using the slow or the fast version of this indicator, there is a high chance that your investment will not go as planned.

Price Levels

Although this is not a tool per se, a number of traders believe that they should place special attention on trading when they come across a round number (e.g. 1.2000 EUR/USD or 1.5000 NZD/USD). Because the same happens when a price ends in this way, traders must understand the vastness of options this standpoint entails. Moreover, price levels are commonly interpreted as psychological levels, which some professional traders consider downright false. Another reason why this may not be your best approach is the fact that the big banks will always show interest in a surge of activity in the trading market, and should they any of these catch their attention, they may decide to step in. Traders simply cannot predict how the price will go from this point onwards, which is why putting your faith in price levels may be unwise.

CCI Indicator

The Commodity Channel Index (CCI) is commonly used for both trends and reversals. Built in 1980, this indicator is mostly criticized for its tendency to push traders into making a move too early. A number of traders claim to have attempted to make use of this indicator and failed because of its mechanics. As this market does not react well to any untimely activity, entrusting your financials to an imprecise indicator may take a toll on your trading and possibly your future prospects of succeeding in forex trading.

Support/Resistance Lines

Despite this indicator being so frequently used by spot forex traders, we need to address the fact that it leaves room for too many possibilities. Unlike trend lines, these lines are quite easy to draw and, at the same time, almost every trader can have access to the exact same information. Such ability diverts a lot of attention in a very narrow direction and this immediately sparks big banks’ interest. The moment this happens, the price is redirected the opposite way and everyone using this indicator ends up losing a lot of money.

Japanese Candlesticks

One of the oldest indicators dating back to the 18th century, Japanese Candlesticks, is also one of the easiest to see and thus used by large numbers of traders. Once they are noticed, everyone decides to react to the same signals and, quite naturally, big banks interfere once again. Due to the fact that a price reversed, you may even find a hammer you believe functions well, but so did other participants in the market. Many traders find themselves very excited at this point that they cannot seem to notice several points in the chart where other hammers previously failed. To keep traders motivated, the big banks will always allow them an occasional victory, but this only further instills casino mentality in traders intended to maintain a constant surge of individuals hungry for another win.

Chart Patterns

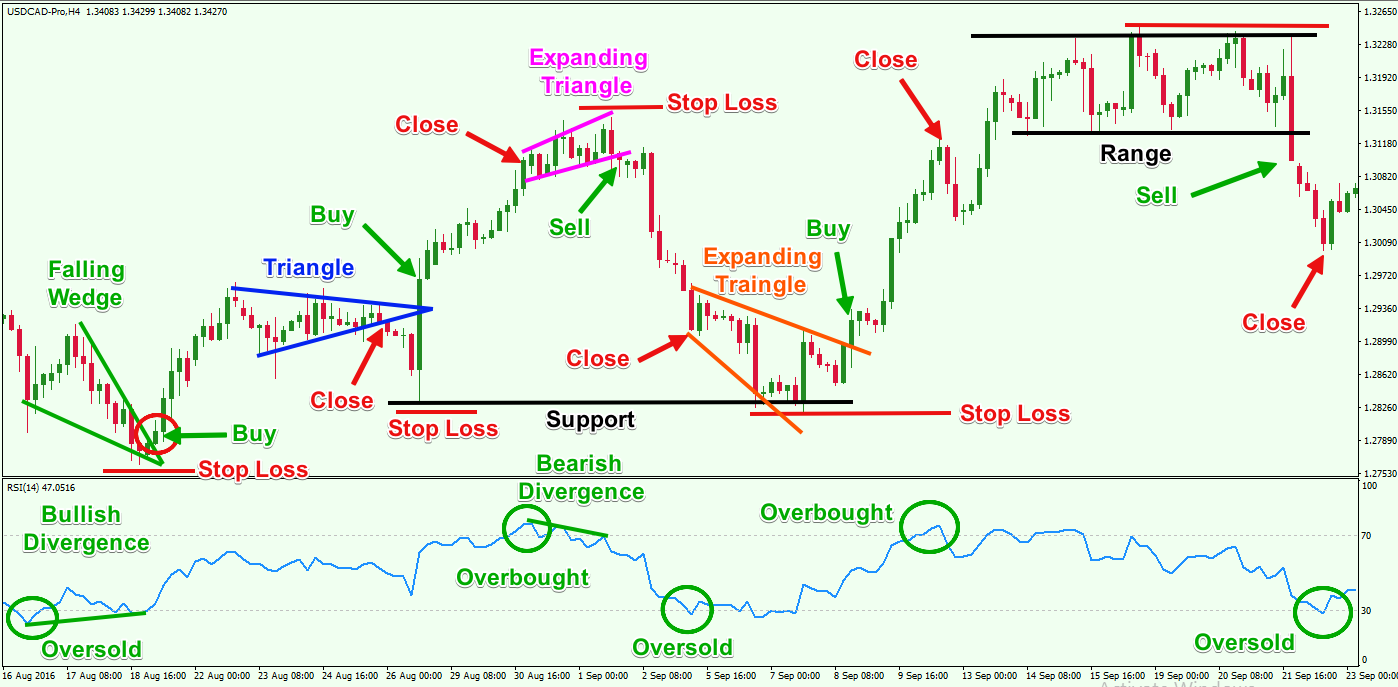
Chart patterns, which function similarly to the previously mentioned indicator, can be quite useful in trading stocks because it focuses on traders’ sentiment. Forex trading does not favor this approach unless we decide to go against the flow, because traders in this market are by default bereft of the information where the money is actually going as the big banks are the only ones entitled to possess this kind of knowledge. In addition, chart patterns are quite easy to see and, as we have seen with the other indicators above, big banks take traders’ orders, trigger them, and whipsaw the price. Only once these traders exit the trade will the banks actually decide on the price’s direction, and the vast number of people who use this indicator allows for this perpetual motion to keep happening over and over again.

Bollinger Bands

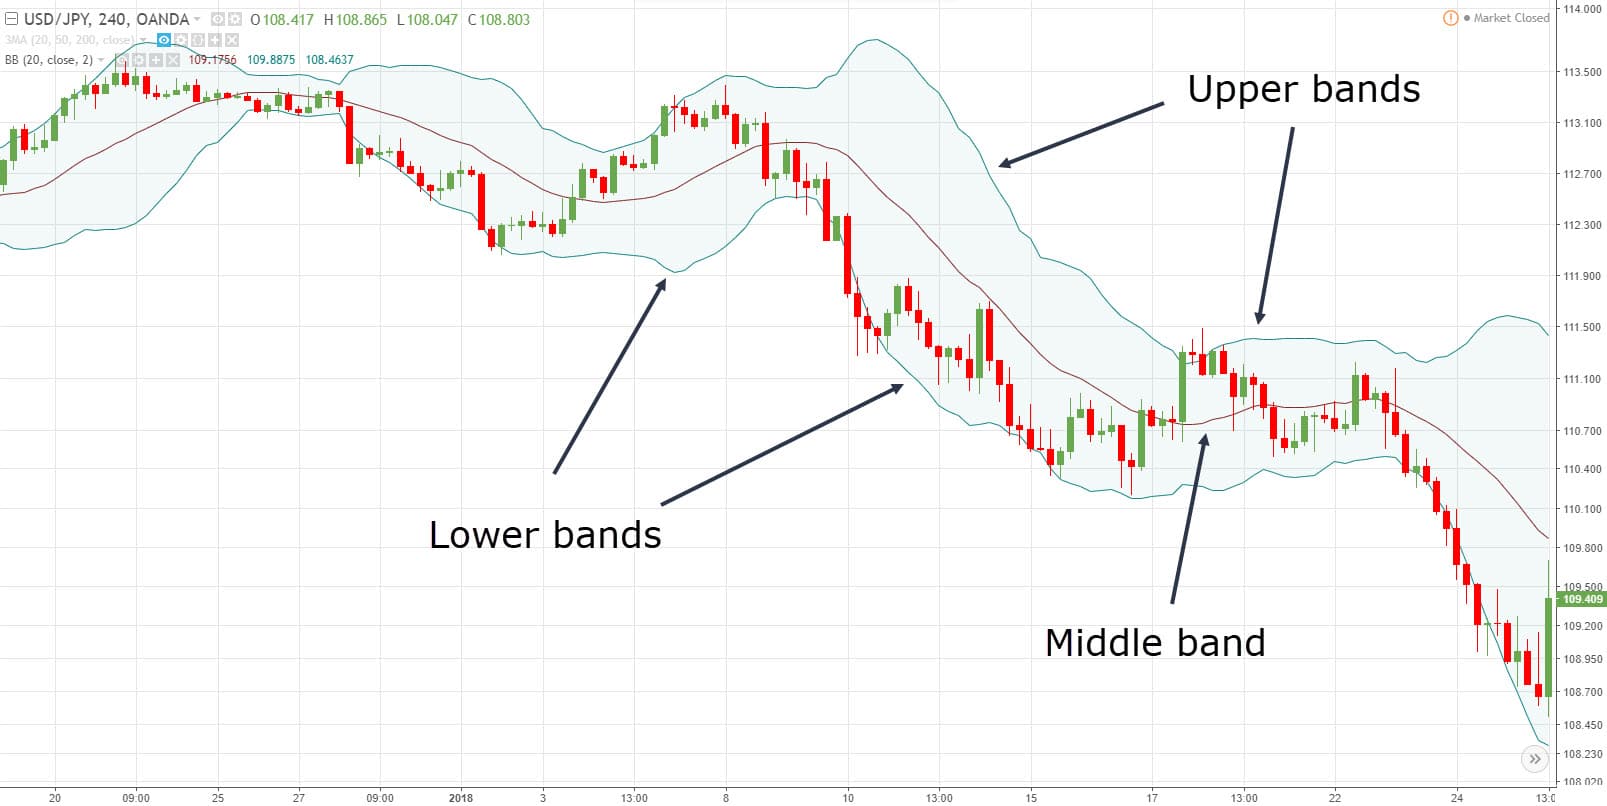
This indicator created by John Bollinger in the early 80s is another tool largely dependent on the subject of overbought and oversold, the trap which reversal traders keep getting themselves into. As discussed above, this approach is not viable in trading currencies although some individuals make use of them in calling trends. Unfortunately, this again has its drawbacks because you may be pushed out too early. Successful forex traders commonly look for long runs where they can get a great number of pips, which is why this indicator often does not make their algorithm.

Fibonacci

Similar to support/resistance lines, with any given timeframe, any trader can draw several Fibonacci retracements on any chart. Having several lines on one chart entails that there are too many possibilities, especially considering the fact that we cannot know which line the price is going bounce off of. As Fibonacci revolves around the patterns which occur in nature, the spot forex market naturally cannot make use of this indicator.

RSI

The Relative Strength Index (RSI) was created in 1978 for the purpose of trading stocks, which implies that concepts of overbought and oversold are again used extensively with this indicator. Considering the fact that a number of stock traders do not find it to be useful in reality, we can wonder why traders would even attempt to use them in trading currencies. As RSI is one of the most researched and widely used indicators, traders now have access to a great quantity of data which can save them from experiencing failure while trading currencies.

Moving Average Crossovers

Despite the fact that this indicator proved to be useful at times, it still does not give you an exclusive insight into any market activity. Even if you can draw an SMA (simple moving average) of 50, 100, or 200, you become one of many who focus on the price nearing one of these levels or on the two moving averages crossing. Moreover, as the spot forex market requires traders to be alert and timely with their decision-making, this indicator is probably not the best choice because it simply gets you in too late.

Whichever indicator you want to use, make sure that you do not lose sight of the need to enter the market and start trading just on time, which some of the tools discussed today evidently cannot grant you. If you want to become a successful trader, explore whatever available information you can and work on your trading toolbox understanding what trading currencies essentially means. Last but not least, think of the percentage of people doomed to fail just because they have not invested time and effort in researching and analyzing the indicators they entrust their financial stability with.

Categories
Forex Service Review

Advanced Fibonacci Tool Review

Advanced Fibonacci Tool can be located within the indicators section of the MQL5 marketplace, there may be several Fibonacci tools so we have provided a link to the exact one that we are looking at. The indicator was uploaded by its creator Onur Uzuncakmak on the 20th of September 2017, it was last updated on the 16th of November 2016 and is currently on version 1.2.

Overview

Advanced Finobbacci Tool is an indicator designed for the MetaTrader 4 trading platform, there is also a MetaTrader 5 version available too. Its main purpose is to give a more advanced version of the standard Fibonacci levels indicator and will draw the levels onto the charts.

Some of the key features of the indicator:

-Drawing of Fibonacci retracement and expansion levels using hotkeys.
-Auto-adjusting of retracement levels once the market makes new highs/lows.
-Ability to edit/remove any retracement & expansion levels on the chart.
-Auto snaps to exact high and low of bars while plotting on the chart.
-Getting very clear charts even though many retracement and expansion series marks.

In terms of parameters, there is a number available that you can alter. Some of the options include the text font, font size, color of retracement levels, the color of expansion levels, width of resistance and expansion levels, custom retracement, and custom expansion.

Service Cost

The Advanced Fibonacci Tool can be purchased with a one-off payment of $89 which gets you unlimited access and no limitations. Unlike many indicators on the MQL5 marketplace, there is no option to rent it. There is also a free demo version, this will have some limitations attached to it, unfortunately, the site does not indicate what they are so we cannot say for sure, it may still be worth downloading to try out, just to see if it functions how you need it to be for making a purchase.

Conclusion

There are only two reviews for the indicator but they are both positive giving it an overall rating of 4.5 out of 5.

Best Fibonacci Indicator in the market!!” – A 5-star review.

Please add some function for multi-timeframe” – Not really a review but it gave 4-stars.

So the indicator has received some good rating and the developer has been replying to comments offering support which is a good indication towards the type of post-purchase customer support that you will receive. We would advise you to try out the demo version, and send any queries you have to the developer so you can be sure that it is the right indicator for you before you make a purchase.

This Forex Indicator is currently available in the MQL5 marketplace: https://www.mql5.com/en/market/product/5577