Categories
Beginners Forex Education Forex Basics

How to Correctly Use an Economic Calendar

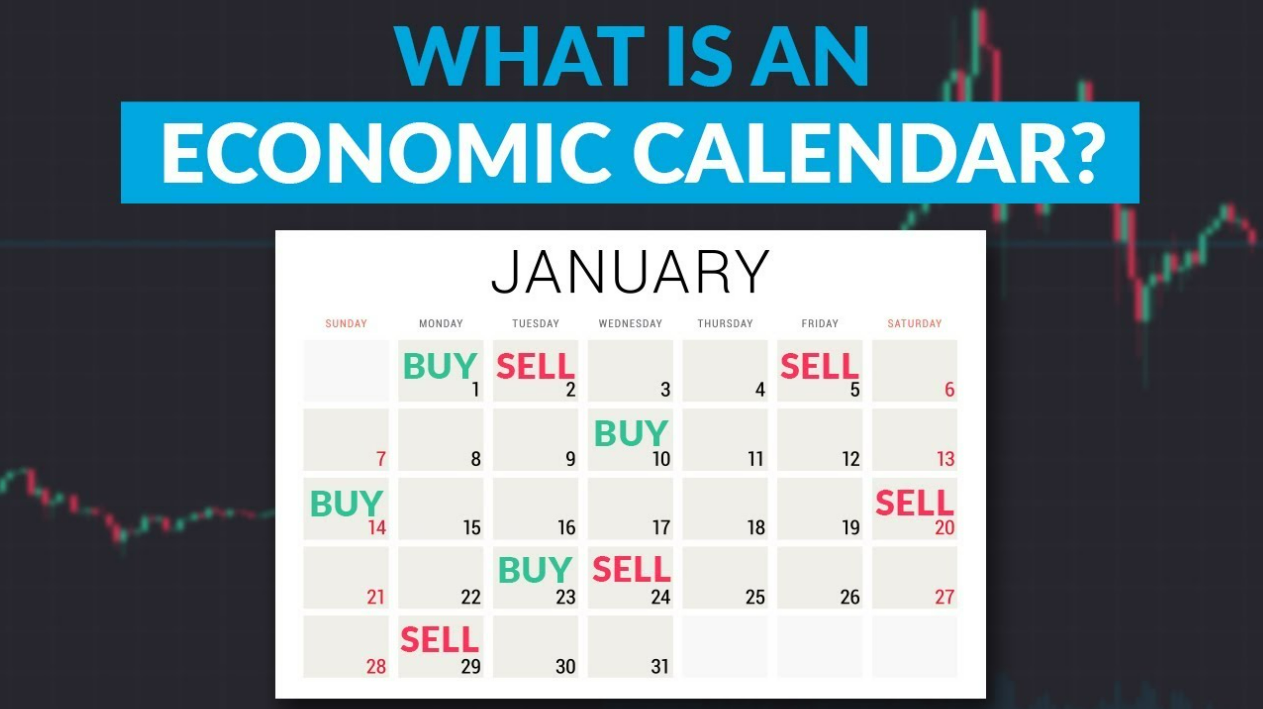
The Economic News Calendar, also known as the calendar of economic events, plays an important role in the life of every trader and investor in the world, whether this is a minor trader who speculates with a personal account or an operator trading as part of an institutional trading network (institutional operators). An economic calendar is a tool that shows the fundamental events that affect the trading environment of financial markets.

In financial markets like Forex, there are certain announcements that are made with some frequency that highlight very important events in the socio-political and economic world. These announcements come from government agencies, central banks, private organisations, lobbyists and others, and can sometimes serve as reference points on which economic policies are based and strategic movements are made in the business and political landscape.

For example, the onset of the global financial crisis led Governments around the world to respond in a political manner in accordance with how their countries and Governments were affected by the events from 2008 to 2010. In the eurozone, the sovereign debt crisis has boosted the change of governments, the implementation of economic policies and decisions. In the United States, we saw the birth of the Asset Rescue Program in Trouble (TARP), several major bailouts, and the easing policies of the Federal Reserve Bank. Several of these decisions were made around the world, changing the aspect of the calendar of economic news as we know it, forever.

The globalized nature of the world today means that these announcements directly affect the global economy, with far-reaching effects on how we live our lives and how future events will shape our future. Financial market operators have had to come to understand how these announcements affect the investment climate in a country, region, or global markets, and depending on the content and tone of these economic announcements, positive or negative sentiment in a currency, market or economy can develop. This in turn leads investors to operate in different markets in a certain way, as a result of the volatility that occurs. These ads are known as market news.

Market news is not published randomly but is published according to a well-planned month-to-month calendar, in a full-year cycle. This economic news publishing program is what is known as the economic calendar. For Forex traders, it is also known as the Forex calendar or Forex news calendar, because most of the news it shows has an immediate and direct (and sometimes lasting) impact on the currency market. Indeed, the economic calendar affects all markets, although the degree of affectation varies.

Components of the Economic Calendar

What is the Economic News Calendar made of? What is in this tool that traders need to consider? Here is a detailed description of the specific components of the Economic Calendar:

The date and time of publication of each economic news item included in the calendar. In this case, the operator can clearly see the exact time when the news will be released, which usually appears in Eastern United States time by default. Some economic calendars have tools that allow the operator to change time settings to match their local time. However, the global standard of reference is eastern time in the United States. Therefore, the operator needs to know how far from the Eastern Time Zone of the United States its own time zone is, in order to know the moments of the day when it must be attentive to the markets.

The economic news itself. Logically the trader should know what is economic news to be published and with which he is trying to act accordingly.

Below is a nice video created by Trading 212 regarding Economic Calendars…

In the case of Forex, the currency of the country of origin of each news item. This is the currency that is usually affected by the news, and therefore traders will be on the lookout for the currency pairs in question to see which pairs present the greatest trading opportunities. Usually, the ISO abbreviation of the currency will be displayed, or the flag of the country with the affected currency will be displayed.

The degree of impact on the market of the publication of the news. This is an indication of how strong the impact of the news can be on markets, measured by the degree of market volatility and the range of price movements. News on an economic calendar is classified into low-impact (green), medium-impact (amber), and high-impact (red) economic news. Some calendars will use the colour codes next to the news, while others may use stars (*) to indicate the degree of impact on the market so that the highest-impact news has a 5-star rating (*****) and low-impact news has two stars or even a single star.

Some economic calendar providers will display a «Detail» box. Operators can click here for more information on a particular news item, as well as the impact on the market in case there are higher than expected or lower than expected numbers.

Economic calendars usually show the previous value, expected value, present value, and revised value of each economic news item. This is where traders can get information about the benchmarks for each data and the actual numbers of the news as it arrives. Some providers provide a historical chart or template that shows the performance of a particular story in recent months or years for comparative analysis.

Sources of Economic News Calendars

The economic calendar can be obtained for free on the websites of almost every major Forex broker. There are also other external providers that can be useful. It is up to each trader to search the websites of Forex brokers, online market analysis sites, online forums related to markets, and analysis service providers to find a good economic calendar that offers complete and up-to-date information. Different economic calendar providers can add certain features that will make their calendar versions more attractive. This does not affect the dates and times of publication of each news item.

How to use the Economic Calendar?

Now that we know what the content of the economic calendar is, it is essential to understand how to use it correctly. While there are no strict rules on the use of economic calendars, here’s a guide on how this tool can be used to trade in markets like Forex.

Rule 1: Always study the news program on the economic calendar in a block of time of an allowance, and do this for the following month in advance. This is so that the trader can take note of the high-impact news and the dates and times on which this news is scheduled for publication. This allows you to plan your operations accordingly, so that you do not have open positions that may be negatively affected by the publication of the news, eliminating its gains or significantly increasing the unrealised losses of losing trades. It is impressive how many traders simply ignore this simple fact, at their own risk.

Rule 2: Use world time tools (showing the current time in any time zone) available in the search engines to know the time difference between the local time and the time shown in the economic calendar. This will allow you to adjust your time settings accordingly. This will help you not to miss the negotiation opportunities that will bring particular economic news.

Rule 3: Use historical data to study how a particular story affects markets. If you want to know what is the way in which a currency pair or index will react to the publication of a certain economic news item (as an important economic indicator), then the most appropriate response might be to study your past behavior using historical data and graphs. This will prevent a trader from setting a profit goal of say 100 pips, for a story that will only move the market around 50 pips, for example. It will also help to know whether an individual economic news item is unstable.

Rule 4: Trading only with high-impact news is recommended, as these are the events that move markets and create the volatility needed to produce good trading opportunities. Low-impact economic news does not create enough volatility, and therefore is not suitable for high-profit markets because it generates small-scale movements.

Rule 5: Use calendars that have automatic update tools that add the current numbers to the calendar at the time the news is published. This will help you closely monitor your operations.

Conclusion

In summary, we can conclude that an economic calendar is an important tool for traders in all financial markets. It must be used in a complete and correct manner so that operators can derive the maximum benefits from the information it provides. Sometimes an operator may have to combine two or three calendars in order to get everything they want from an economic calendar, as some may have additional features and have shortcomings in other respects.

Trading is mainly based on planning. Knowing the economic calendar well in advance can help the trader to plan his operations in such a way that he does not end up trapped in some of the surprises that may occur during economic news publications.

Also, note that the market is constantly evolving. Some economic news that was low-impact a few years ago has become more important to markets and has a high impact due to the emergence of new sectors that are now engines of the global economy. An example of this is housing data in the United States. Before 2006, some of the housing sector indicators were not very important, but as the subprime mortgage crisis was identified as the main cause behind the global financial crisis, US housing data has become a highly monitored economic news item.

Finally, the trader should be aware of adding new economic news and removing some that are irrelevant and even archaic. Some of this news can be highly impacted, such as the JOLTS employment report from the United States, which was born out of the labor sector crisis in that nation.

Categories
Forex Indicators

Incorporating the Right Indicators Into Your Trading System

Technical traders are not making decisions on any other input but their set of indicators and rules. As a holistic approach, it is a trading system that combines position or risk management, chart analysis, and volatility/volume parameters, producing three types of signals: enter a trade, exit a trade and do not trade. Technical traders’ decisions are therefore based on a black and white mindset. In other words, their mind is not different than the trading systems they have made.

On a professional level, their mind is just thinking about testing out more to improve the system effectiveness on the forex market. This article will reveal an important view of how to add on an element or an indicator to a system that already has a few synergetic elements, each playing their role, and measure various categories from the market numbers. Using an example from one professional prop trader system structure, we can give an understanding of what to look for when improving your own trading system. 

Technical traders may follow a certain theory, using just John Ehlers’s indicators, for example, but it is proven that risk is mitigated by diversification. Even though the indicators from this researcher are somewhat predictive in nature, having another indicator from other theories that base on historic confirmation might be not only risk-mitigating but also create special chemistry when combined. Traders that are advanced already have a system and are probably familiar with the theories or how their indicators are made. Beginner traders are not familiar with this, and actually, they do not have to be to create effective systems. We will present you with a few shortcuts to finding this special indicator combination.

As an example, a trading system can have a volatility indicator based on which position size and risk management are based on. Having such a variable and adaptive way of controlling risk is imperative as discussed in other articles. ATR indicator is one such volatility measure. The next element in the system is a specialized volume or volatility indicator whose role is to tell us when there is not enough momentum in the market or trend and to just ignore signals from other indicators as the risk of price changing direction is increased. We are looking for quality trends to follow, a scientifically proven method of trading with the best results. When we are looking to exit a position, technical traders also make decisions after an indicator. This type of indicator should be great for finding points when trends exhaust and some think oscillators and reversal indicators are a good pick for this role.

A separate article also explains this in more detail. At the core of the system is the confirmation indicator, when to enter a trade is a starting point when we look at charts. Finding an indicator that proves to be very effective at finding emerging trends is a precious element but we all agree none is close to being right even 70% of the time. As this is the core of the system, why not make it better by adding an additional confirmation indicator? Having two different experts will generate better solutions than just one. Now, if we go on we might think more is better, but there is a thin line after which adding more indicators creates a detrimental effect on the system. It is too complicated. So adding just one additional confirmation indicator is enough. The point here is to make sure that the first trend confirmation signal is not a fake market move that just a whipsaw, so add another one that needs to produce a signal in the same direction before we make a trade. Eliminating losses from these fake moves has the same effect on our account as when we win. 

Confirmation indicators have various calculations, formulas, and ideas behind them, and that is great. As an analogy let’s say your system is a team of players. Each player has its role but we have all witnessed a magic bond between two or more players that are just extremely effective when combined. Of course, having a bad player and another bad player is going to be better but it is no-brainer because we want to have two greats. Finding great indicators is a long and tedious work, once we have one with the best backtesting and forward testing results, it is priceless. The ones that got to the top 10 of your list might be the ultimate additions to your number one. The good thing about these indicators is that they are abundant, unlike the volume indicators, and they are easy to test. 

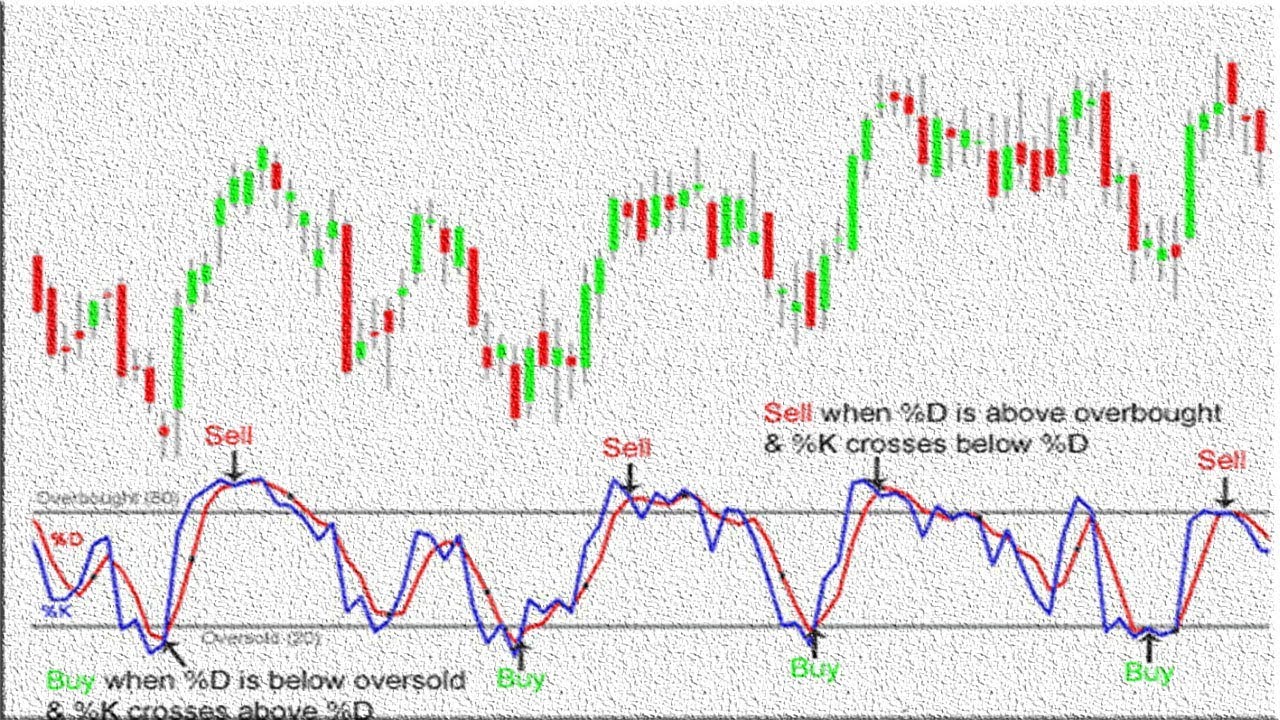
Trend confirmation indicators can be categorized to make this process beginner-friendly. Starting with the Zero Cross indicators, they are generating signals based on a line crossing a horizontal zero value line. A typical example of this is the Chaikin Money Flow (CMF), an indicator using volume and other market values in its formula. After all, traders are interested in how good it is for their system after backtesting and forward testing. When the main signal line is crossing the zero line it means a new trend or continuation is starting. If your main confirmation indicator is from the same category, you will need to change one to get the diversification effect.

The second category is the Line Cross-type. These are probably the most common type of indicators. MACD can be one example of this, although MACD also has a zero line. If you want to diversify, you will need to pay attention to different signals even the  MACD, for example, belongs to the Zero Line and the Line Cross category. The third category is the on chart indicators. Now, these indicators are the ones when applied are represented on the MT4 chart itself, not in a separate window below it. Moving Averages are a simple example of this type of indicator, and there are many ways you can classify a trade signal with them. Many systems have them and they can be an extremely effective tool. Finding the right Moving Average indicator is surely going to be worth the time. 

Now when we understand how to combine and diversify indicators, understand that the second confirmation indicator is there to filter losses made from the main one. Since cutting losses is the same as generating wins, we are looking for synergy results where the second indicator is filtering the losses but not filtering the wins. Volume indicators have a similar role here but know it is hard to find a volume indicator that does not filter a win in the way. The nature of measuring volatility or volume simply needs more data to be effective, consequently, they lag. Lagging may cause your system to miss the right moment to enter a trade and therefore a possible big win but this is just something we have to accept.

Additional confirmation indicators are not necessarily like this but they still add value to your system. Traders’ focus should be on cutting the losses, it is the main problem once you make your first system. When we find and adjust our second indicator, aim to cut a lot of losses. If a winner is filtered, try to adjust settings a bit but not at the cost of letting the losers in. As we have discussed in previous articles, your indicators should be recent, do not latch on to the popular ones, you will soon find others have better results in your testing. Combining different type indicators with great results is the way to go but know that sometimes the synergy might not be there. Similar to sports, you may collect the best players together in a team but the result can be disappointing. On other occasions, two great players that understand each other can beat the opposition alone. Interestingly, case studies have shown each had a different specialized skillset that adds value to the other. The goal is the same but the formula is based on different measures and the representation is different. 

You will find many times that your two confirmation indicators do not align, and this is good. Pay attention to the main setting adjustment you can make, the period. By having one faster and one slower confirmation indicator, you may find that sweet spot of filtering losses and keeping the winners. Whatever confirmation indicators you find, only testing will show you if this combo is worth keeping. The more pairs you test, the better the odds you will find a golden team. Other elements in your trading system should not be messed with during testing, you need to have control and compare only this confirmation indicator combination.

Here is an example provided by one prop trader demonstrating how this idea works in practice. We are going to use the EUR/USD currency pair. It is the most traded pair with many news, reports, and event that could push the trend the other way. As such it is considered the riskiest pair you can pick and should provide a lot of losses and wins. Losses we should cut by introducing a second confirmation indicator. From the picture below we can see our Aroon indicator is really having a hard time finding a winner. This chart is very nasty for trading trends with many whipsaws.

Red and green vertical lines are added once the indicator gives a signal to go short or long. Aroon was able to give us approximately 3 wins and 8 losing trades. We can see Aroon is a line cross indicator type, signals are generated once the red line crosses above the blue for short and vice versa. Let’s see what happens when we add a second confirmation indicator not belonging to the line cross-type. 

We have added an Exponential Moving Average for 20 periods as the on chart type indicator. Now if you use the EMA for generating signals only when the price crosses it, you will find many conflicting signals with the Aroon. When they are in conflict, we do not take that trade. When we take this rule to the chart, many of the losses are filtered. 

Now we have kept the winners and have only 6 losses. EMA might not give us great loss reduction but the end result is still better than before. Let’s try to find a better indicator. 

We have added the Force Index indicator and adjusted its period to 26 from the default 13. Additionally, a horizontal line is added at zero effectively making this indicator a zero line cross type! The result is we still have 3 winners and now only 2 losses. Before all this, we had 8 losing trades. So we have transformed our system from a 27% success rate to 60%. Note that your system still has a volume filter and other elements that boost this rate to a much better percentage. With good position sizing, money management, you should be profitable. You now have better odds than a 50-50 coin flip.

By the way, having proper money management and using a 50% success rate system can still yield profits. Just pay attention, what is presented is just a couple of trades on a single currency pair. What you need to do is test your indicator combinations on longer periods and other assets. We are aiming to create a system that works on every currency pair, without adjustments. The final product is a universal system you can use professionally for a long, long time. 

To conclude, the hard work you have to put in is necessary to find that perfect combo. Treat it like a treasure hunt, a game with real treasures behind. If this is exciting to you then it is just a matter of time when you complete your trading system and just trade as it says, consistently providing you with treasures. Your score list of tested indicators is useful, you can pick up your second confirmation indicator from there without searching through the forums and indicator websites. Use the tricks described here, add a line, test different periods and settings, add an MA to the indicator. Finally, the synergetic effect is easy to test, as demonstrated, you will not spend too much time to figure out you have a high % combo in front of you.

Categories
Beginners Forex Education Forex Basics

Can We Still Be Successful with Bad Tools?

Everybody has a different opinion on how forex works and how exactly we should trade. There will always be some group of people that take issue with the things are said and done. We will always be surrounded by people who tend to discredit certain strategies. With something complex as forex is there will always be expressions of disapproval. We like to say that there are 2 types of people who really stick out in the trading parliament. Those are complainers and arguers. With complainers is simple, if we don’t do and say things exactly the way they want, then they are going to take the issue with it. With these kinds of people, disagreement will be the most possible outcome. Life goes on.

With arguers is much different, here we have just people with a contrasting opinion which is perfectly fine. In the end, we are all trying to figure out what is happening in the market, the world economy, and how big banks are affecting our trading. If we ask 1000 people the same question we would probably get 1000 different answers on the same topic, it’s just like that and that is how is going to be in most cases. So the best thing we can do is to give our own opinion after the research and try to back it up as much as we can. Constant pursuit for a better understanding of how forex works behind the scenes should always be one of our main goals.

Is it still possible to ride on big waves even if we use bad tools? There can be some winnings for sure, but it would be a lot more difficult to trade with bad tools. Because at their core these are sub-standard tools to use and by using them we would certainly have an uphill battle ahead of us. There have been a lot of traders that still became professional traders despite this fact. Even with sub-standard tools if our trading strategy is in place we might do some damage. The traders with good money structures who have their emotions well-settled might do good even with wrong tools. Way too often the game is over before even starts because some of us might be using terrible, outdated technical tools on our chart. But even with the almost perfect money-making algorithm, there is a big chance for messing up if we don’t have good trading psychology and adequate money management.

Surely there are tools and indicators invented a long time ago so we can reasonably assume they were not made for the market that we trade. They are certainly not the only options among more than 10.000 indicators and tools that we could put on a chart at any given time. There is no need to be trapped using the same tools if they don’t do the job as they should. We want to keep our chances as higher as possible and honestly, we are not going to score with outdated tools. We should always try to eliminate a lot of stuff before we can even think about moving forward but following the same tired advice, the same tired old technical tools being used every time is not going to get us anywhere. We need to be aware which tools could be totally useless for our trading and that we might be way better without some of them. Also, we need to distinguish which parts of some potentially bad tools we could actually use because there are tools with the most parts that we could not declare as beneficial.

There is a whole new horizon of indicators out there so just by being aware of their existence could put us in a very exclusive company. Most people, even professionals don’t know that there is a whole new world out there. Depending on a different type of tool or indicator that we are discussing, all types of arguments are falling into a few categories. Firstly, people like to say: “Well my friend, you just didn’t use it in this setting, that’s what you have to do”. Our response on that would be that the chances are we did try on that setting because of our through nature of approaching to forex and it didn’t just work for us. If something works for someone else that’s great but systems are different like we all know. If someone has a success in the particular setting then that somebody has figured something out. We always like to give applauses of admiration for those who manage to discover something revolutionary. Friends traders, please do share.

We have people typically connected to the Fibonacci tool. The Fibonacci crowd might say: “Oh you are just not using it this way, maybe you should try this method…” or “If you use the Fibonacci from an intraday stand of point it will work better”. Well, some don’t trade intraday because they have great success with the daily chart and that would usually be one of the main ingredients for the right way of trading forex as we like to point out. Still, it may not be for everyone. Further, there have to be at least 50 different ways we could use the Fibonacci in our trading like there are a lot of different ways we could use a bunch of other tools and indicators. The problem is that the explanation of any of those deserves a book or two. We could often see similar arguments when we debate about other tools. But all we care about here should be our personal success, no matter which tools took us there.

If somebody found a way to make a bunch of pips consistently, for example, using the RSI we could only salute to that person. If somebody has overcome a gigantic obstacle, well deserved. Here we are putting our systems to work and testing them as much as we can therefore our directions in trading are based on our great effort and long experience. So if someone has the method that works better, something like moving average crossovers mixed with the support and resistance lines, we wouldn’t have much to say than to be forever grateful if that somebody shares his knowledge with us. Do we think that our method is superior? Of course, everybody thinks that their method is better. We all see the values in our methods because we appreciate the benefits they give us. We should stay unpopular, we have wisely allocated our time, and we have a system that gets to take some emotions out of the game. These are some of the things that we endorse.

Traders, our advice on this would be to always keep improving on what you have. If somebody is an RSI trader and he is getting good results over time, he should never stop searching for better options out there. There is no reason to stop searching for improvement. If the results are not there it’s ok to jump from the ship, but traders, be honest with yourself, make sure that the results are there, and then try to upgrade your system. There is a whole brand-new world of tools out there, relevant tools, created for the forex market that we trade and they are certainly worth discovering and testing out. Successful or not we are not stuck, we could start to make money if we educate ourselves properly or we could make more money if we dare to embrace more education. We should try to discover the best tools around, we should closely observe our results and never stop improving our system. That might be the only way.

Categories
Beginners Forex Education Forex Basics

Why Popular Tools are Bad for Your Trading

A vast majority of people keep using certain tools that a portion of successful forex traders describe as utterly futile. In this article, we are going to assess the basis of such opinions and possibly shed some new light on the topic of technical analysis tools in spot forex trading. More specifically, we are going to provide ways in which you can stop yourself from squandering any more money by offering some direct and practical advice. If you keep finding yourself in a precarious situation where you cannot seem to prosper or grow as a trader, learning about these 12 tools may provide you with new and innovative ideas and perspectives you can incorporate in your trading in this market.

Some references go as far as to say that the number of traders who are experiencing financial hardship, constantly spiraling downward, is as high as 99%, if not above. Some of the reasons behind such lamentable statistics may have a lot to do with one’s money management skills. At times traders have quite a good idea of which entries they should make, but they lack the investment mindset to back these skills up in a more sustainable manner. As one of the essential topics in the world of trading, this is unfortunately seldom discussed, along with today’s topic. Aside from possibly lacking an efficient system to support your intelligent investment and trading decisions, you may be also lacking the knowledge or experience regarding tools, often unfoundedly glorified by various people.

While educating yourself on tools, techniques, and strategies is key in this world, we may often come across information suggesting the use of some outdated tools and indicators, which can be even quite detrimental to your attempt to follow current trends. What is more, some of these were not even developed for forex trading in the first place as they are based on concepts used in trading equities and gold, among others. It is these basic concepts which forex market revolves around that you strive to grasp and apply intelligently and strategically: understanding the nature of fiat currencies, the impact of money management skills, the role of big banks, the importance of trend trading, and the detriment of trading reversals to a trader’s overall success. At this point, every trader must accept the need to eliminate the information which is not beneficial because no professional algorithm can overpower flawed thinking. You can now begin to grasp how disinformation and misinterpretation can impact your development and finances, which naturally involves the necessity to discriminate between different tools and indicators you can use in your chart.

Started in 1996, the spot market is only a little over one decade old, which is why we currently have approximately 10 thousand indicators and tools at our disposal. Nevertheless, we must be aware of the fact that most of these were not specifically invented for the needs of forex trading. Like with various other gadgets that lost their importance or were simply replaced by more modern versions (e.g. pager vs. cell phone), we can logically conclude how even the world of trading requires modernization to be able to produce realistic results. A tool designed in the 70s for the stock market can possibly render some success, but you know that an innovative tool can lead you to a much better, and much more secure, outcome. Therefore, let us see which 12 indicators fall under this category and why we should consider turning to some other tools at this time.

ADX Indicator

The average directional index (ADX) was developed in 1978 and the reason why traders use it is twofold. People mostly use it for the purpose of measuring volume, which is absolutely understandable and needed in forex trading; however, the volume meter is simply too slow and, even if you try to make it work faster, the information it provides can become severely inaccurate. Another important component of this indicator, Directional Index (DI) which tells traders whether their currency pair is bullish or bearish, has such a major lagging issue that it affects the whole process. Therefore, due to using this indicator, you are not only at risk of making entries based on false data, but you also enter the market too late, which together make this indicator increasingly unreliable.

Trend Lines

As there is no one correct way to draw trend lines, which involves a great degree of imprecision, this approach may easily be least worthy of your time. Differences between the way trend lines are drawn can be so vast that a trader may not know how to surpass this seemingly unsurmountable problem – show the focus on price tops or where the price closed and what should they do if a price has broken the trend line? Everyone seems to have their own idea of what to do in this case, but these opinions differ to the extent that forming a uniform approach seems impossible. Furthermore, with such a great number of possible options, we may be able to draw several trend lines in any chart. Unfortunately, most trends are already over by the time we discover them. If you experienced a situation where a price did not align with your trend line, it is because the notion of diagonal support or resistance is entirely nonexistent, which supports the belief that trend lines should not be used in charts to gain any relevant information.

Stochastics

Developed way back in the 1950s, this tool is based on terms such as overbought and oversold that meaningfully and essentially have no relevance to trading fiat currencies, which alone is a proof strong enough for you to opt for another indicator. Moreover, it is highly unreliable in trading stocks too because the majority of signals it gives are false even in case of range-bound prices. What is more, traders inevitably face disappointing results whenever the prices are trending because, with a commonly vast number of reversal traders, stochastics will simply keep giving inaccurate information. This further implies that all the money traders make during the range-bound periods will go to waste once the prices start trending. Therefore, regardless of whether you are using the slow or the fast version of this indicator, there is a high chance that your investment will not go as planned.

Price Levels

Although this is not a tool per se, a number of traders believe that they should place special attention on trading when they come across a round number (e.g. 1.2000 EUR/USD or 1.5000 NZD/USD). Because the same happens when a price ends in this way, traders must understand the vastness of options this standpoint entails. Moreover, price levels are commonly interpreted as psychological levels, which some professional traders consider downright false. Another reason why this may not be your best approach is the fact that the big banks will always show interest in a surge of activity in the trading market, and should they any of these catch their attention, they may decide to step in. Traders simply cannot predict how the price will go from this point onwards, which is why putting your faith in price levels may be unwise.

CCI Indicator

The Commodity Channel Index (CCI) is commonly used for both trends and reversals. Built in 1980, this indicator is mostly criticized for its tendency to push traders into making a move too early. A number of traders claim to have attempted to make use of this indicator and failed because of its mechanics. As this market does not react well to any untimely activity, entrusting your financials to an imprecise indicator may take a toll on your trading and possibly your future prospects of succeeding in forex trading.

Support/Resistance Lines

Despite this indicator being so frequently used by spot forex traders, we need to address the fact that it leaves room for too many possibilities. Unlike trend lines, these lines are quite easy to draw and, at the same time, almost every trader can have access to the exact same information. Such ability diverts a lot of attention in a very narrow direction and this immediately sparks big banks’ interest. The moment this happens, the price is redirected the opposite way and everyone using this indicator ends up losing a lot of money.

Japanese Candlesticks

One of the oldest indicators dating back to the 18th century, Japanese Candlesticks, is also one of the easiest to see and thus used by large numbers of traders. Once they are noticed, everyone decides to react to the same signals and, quite naturally, big banks interfere once again. Due to the fact that a price reversed, you may even find a hammer you believe functions well, but so did other participants in the market. Many traders find themselves very excited at this point that they cannot seem to notice several points in the chart where other hammers previously failed. To keep traders motivated, the big banks will always allow them an occasional victory, but this only further instills casino mentality in traders intended to maintain a constant surge of individuals hungry for another win.

Chart Patterns

Chart patterns, which function similarly to the previously mentioned indicator, can be quite useful in trading stocks because it focuses on traders’ sentiment. Forex trading does not favor this approach unless we decide to go against the flow, because traders in this market are by default bereft of the information where the money is actually going as the big banks are the only ones entitled to possess this kind of knowledge. In addition, chart patterns are quite easy to see and, as we have seen with the other indicators above, big banks take traders’ orders, trigger them, and whipsaw the price. Only once these traders exit the trade will the banks actually decide on the price’s direction, and the vast number of people who use this indicator allows for this perpetual motion to keep happening over and over again.

Bollinger Bands

This indicator created by John Bollinger in the early 80s is another tool largely dependent on the subject of overbought and oversold, the trap which reversal traders keep getting themselves into. As discussed above, this approach is not viable in trading currencies although some individuals make use of them in calling trends. Unfortunately, this again has its drawbacks because you may be pushed out too early. Successful forex traders commonly look for long runs where they can get a great number of pips, which is why this indicator often does not make their algorithm.

Fibonacci

Similar to support/resistance lines, with any given timeframe, any trader can draw several Fibonacci retracements on any chart. Having several lines on one chart entails that there are too many possibilities, especially considering the fact that we cannot know which line the price is going bounce off of. As Fibonacci revolves around the patterns which occur in nature, the spot forex market naturally cannot make use of this indicator.

RSI

The Relative Strength Index (RSI) was created in 1978 for the purpose of trading stocks, which implies that concepts of overbought and oversold are again used extensively with this indicator. Considering the fact that a number of stock traders do not find it to be useful in reality, we can wonder why traders would even attempt to use them in trading currencies. As RSI is one of the most researched and widely used indicators, traders now have access to a great quantity of data which can save them from experiencing failure while trading currencies.

Moving Average Crossovers

Despite the fact that this indicator proved to be useful at times, it still does not give you an exclusive insight into any market activity. Even if you can draw an SMA (simple moving average) of 50, 100, or 200, you become one of many who focus on the price nearing one of these levels or on the two moving averages crossing. Moreover, as the spot forex market requires traders to be alert and timely with their decision-making, this indicator is probably not the best choice because it simply gets you in too late.

Whichever indicator you want to use, make sure that you do not lose sight of the need to enter the market and start trading just on time, which some of the tools discussed today evidently cannot grant you. If you want to become a successful trader, explore whatever available information you can and work on your trading toolbox understanding what trading currencies essentially means. Last but not least, think of the percentage of people doomed to fail just because they have not invested time and effort in researching and analyzing the indicators they entrust their financial stability with.