Technical traders are not making decisions on any other input but their set of indicators and rules. As a holistic approach, it is a trading system that combines position or risk management, chart analysis, and volatility/volume parameters, producing three types of signals: enter a trade, exit a trade and do not trade. Technical traders’ decisions are therefore based on a black and white mindset. In other words, their mind is not different than the trading systems they have made.
On a professional level, their mind is just thinking about testing out more to improve the system effectiveness on the forex market. This article will reveal an important view of how to add on an element or an indicator to a system that already has a few synergetic elements, each playing their role, and measure various categories from the market numbers. Using an example from one professional prop trader system structure, we can give an understanding of what to look for when improving your own trading system.
Technical traders may follow a certain theory, using just John Ehlers’s indicators, for example, but it is proven that risk is mitigated by diversification. Even though the indicators from this researcher are somewhat predictive in nature, having another indicator from other theories that base on historic confirmation might be not only risk-mitigating but also create special chemistry when combined. Traders that are advanced already have a system and are probably familiar with the theories or how their indicators are made. Beginner traders are not familiar with this, and actually, they do not have to be to create effective systems. We will present you with a few shortcuts to finding this special indicator combination.
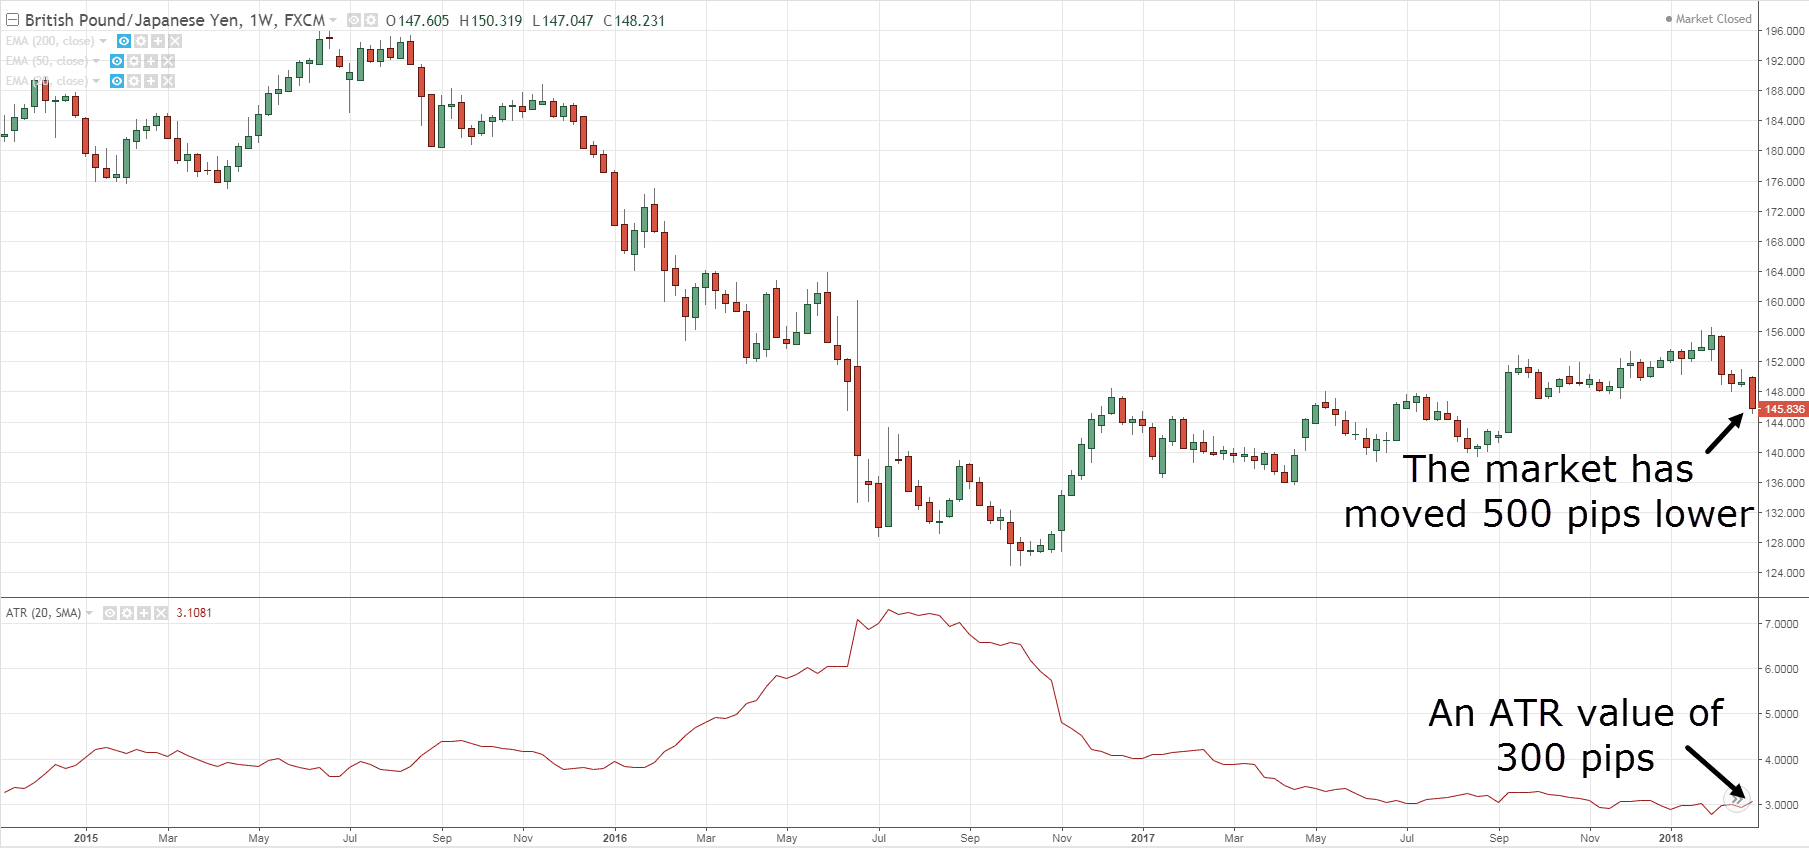
As an example, a trading system can have a volatility indicator based on which position size and risk management are based on. Having such a variable and adaptive way of controlling risk is imperative as discussed in other articles. ATR indicator is one such volatility measure. The next element in the system is a specialized volume or volatility indicator whose role is to tell us when there is not enough momentum in the market or trend and to just ignore signals from other indicators as the risk of price changing direction is increased. We are looking for quality trends to follow, a scientifically proven method of trading with the best results. When we are looking to exit a position, technical traders also make decisions after an indicator. This type of indicator should be great for finding points when trends exhaust and some think oscillators and reversal indicators are a good pick for this role.
A separate article also explains this in more detail. At the core of the system is the confirmation indicator, when to enter a trade is a starting point when we look at charts. Finding an indicator that proves to be very effective at finding emerging trends is a precious element but we all agree none is close to being right even 70% of the time. As this is the core of the system, why not make it better by adding an additional confirmation indicator? Having two different experts will generate better solutions than just one. Now, if we go on we might think more is better, but there is a thin line after which adding more indicators creates a detrimental effect on the system. It is too complicated. So adding just one additional confirmation indicator is enough. The point here is to make sure that the first trend confirmation signal is not a fake market move that just a whipsaw, so add another one that needs to produce a signal in the same direction before we make a trade. Eliminating losses from these fake moves has the same effect on our account as when we win.
Confirmation indicators have various calculations, formulas, and ideas behind them, and that is great. As an analogy let’s say your system is a team of players. Each player has its role but we have all witnessed a magic bond between two or more players that are just extremely effective when combined. Of course, having a bad player and another bad player is going to be better but it is no-brainer because we want to have two greats. Finding great indicators is a long and tedious work, once we have one with the best backtesting and forward testing results, it is priceless. The ones that got to the top 10 of your list might be the ultimate additions to your number one. The good thing about these indicators is that they are abundant, unlike the volume indicators, and they are easy to test.
 Trend confirmation indicators can be categorized to make this process beginner-friendly. Starting with the Zero Cross indicators, they are generating signals based on a line crossing a horizontal zero value line. A typical example of this is the Chaikin Money Flow (CMF), an indicator using volume and other market values in its formula. After all, traders are interested in how good it is for their system after backtesting and forward testing. When the main signal line is crossing the zero line it means a new trend or continuation is starting. If your main confirmation indicator is from the same category, you will need to change one to get the diversification effect.
The second category is the Line Cross-type. These are probably the most common type of indicators. MACD can be one example of this, although MACD also has a zero line. If you want to diversify, you will need to pay attention to different signals even the MACD, for example, belongs to the Zero Line and the Line Cross category. The third category is the on chart indicators. Now, these indicators are the ones when applied are represented on the MT4 chart itself, not in a separate window below it. Moving Averages are a simple example of this type of indicator, and there are many ways you can classify a trade signal with them. Many systems have them and they can be an extremely effective tool. Finding the right Moving Average indicator is surely going to be worth the time.
Now when we understand how to combine and diversify indicators, understand that the second confirmation indicator is there to filter losses made from the main one. Since cutting losses is the same as generating wins, we are looking for synergy results where the second indicator is filtering the losses but not filtering the wins. Volume indicators have a similar role here but know it is hard to find a volume indicator that does not filter a win in the way. The nature of measuring volatility or volume simply needs more data to be effective, consequently, they lag. Lagging may cause your system to miss the right moment to enter a trade and therefore a possible big win but this is just something we have to accept.
Additional confirmation indicators are not necessarily like this but they still add value to your system. Traders’ focus should be on cutting the losses, it is the main problem once you make your first system. When we find and adjust our second indicator, aim to cut a lot of losses. If a winner is filtered, try to adjust settings a bit but not at the cost of letting the losers in. As we have discussed in previous articles, your indicators should be recent, do not latch on to the popular ones, you will soon find others have better results in your testing. Combining different type indicators with great results is the way to go but know that sometimes the synergy might not be there. Similar to sports, you may collect the best players together in a team but the result can be disappointing. On other occasions, two great players that understand each other can beat the opposition alone. Interestingly, case studies have shown each had a different specialized skillset that adds value to the other. The goal is the same but the formula is based on different measures and the representation is different.
You will find many times that your two confirmation indicators do not align, and this is good. Pay attention to the main setting adjustment you can make, the period. By having one faster and one slower confirmation indicator, you may find that sweet spot of filtering losses and keeping the winners. Whatever confirmation indicators you find, only testing will show you if this combo is worth keeping. The more pairs you test, the better the odds you will find a golden team. Other elements in your trading system should not be messed with during testing, you need to have control and compare only this confirmation indicator combination.
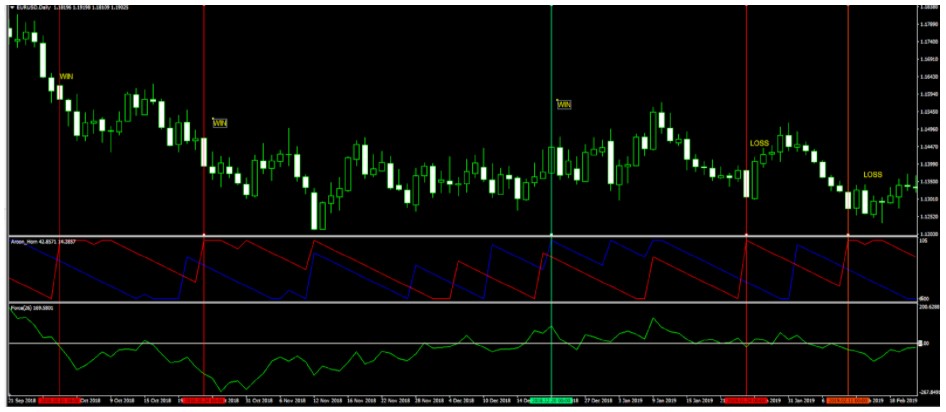
Here is an example provided by one prop trader demonstrating how this idea works in practice. We are going to use the EUR/USD currency pair. It is the most traded pair with many news, reports, and event that could push the trend the other way. As such it is considered the riskiest pair you can pick and should provide a lot of losses and wins. Losses we should cut by introducing a second confirmation indicator. From the picture below we can see our Aroon indicator is really having a hard time finding a winner. This chart is very nasty for trading trends with many whipsaws.
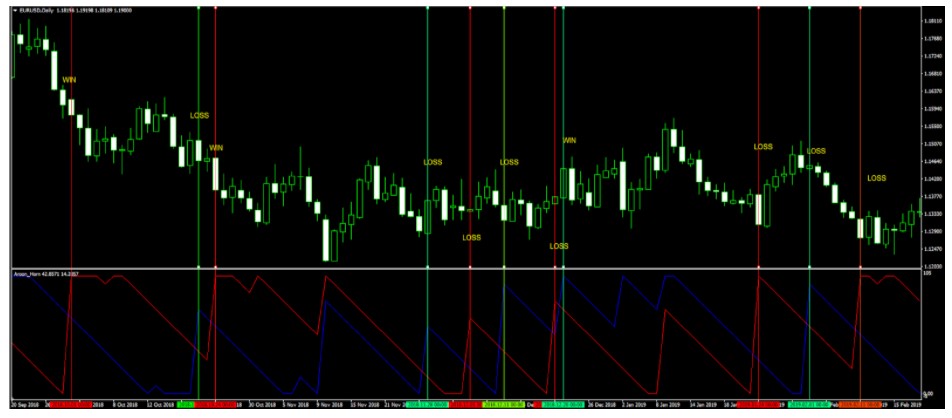
Red and green vertical lines are added once the indicator gives a signal to go short or long. Aroon was able to give us approximately 3 wins and 8 losing trades. We can see Aroon is a line cross indicator type, signals are generated once the red line crosses above the blue for short and vice versa. Let’s see what happens when we add a second confirmation indicator not belonging to the line cross-type.
We have added an Exponential Moving Average for 20 periods as the on chart type indicator. Now if you use the EMA for generating signals only when the price crosses it, you will find many conflicting signals with the Aroon. When they are in conflict, we do not take that trade. When we take this rule to the chart, many of the losses are filtered.
Now we have kept the winners and have only 6 losses. EMA might not give us great loss reduction but the end result is still better than before. Let’s try to find a better indicator.
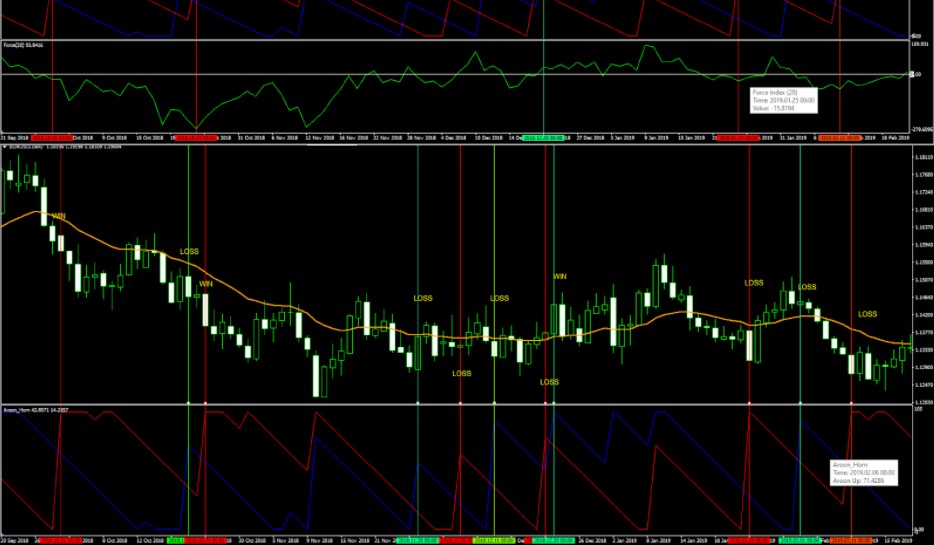
We have added the Force Index indicator and adjusted its period to 26 from the default 13. Additionally, a horizontal line is added at zero effectively making this indicator a zero line cross type! The result is we still have 3 winners and now only 2 losses. Before all this, we had 8 losing trades. So we have transformed our system from a 27% success rate to 60%. Note that your system still has a volume filter and other elements that boost this rate to a much better percentage. With good position sizing, money management, you should be profitable. You now have better odds than a 50-50 coin flip.
By the way, having proper money management and using a 50% success rate system can still yield profits. Just pay attention, what is presented is just a couple of trades on a single currency pair. What you need to do is test your indicator combinations on longer periods and other assets. We are aiming to create a system that works on every currency pair, without adjustments. The final product is a universal system you can use professionally for a long, long time.
To conclude, the hard work you have to put in is necessary to find that perfect combo. Treat it like a treasure hunt, a game with real treasures behind. If this is exciting to you then it is just a matter of time when you complete your trading system and just trade as it says, consistently providing you with treasures. Your score list of tested indicators is useful, you can pick up your second confirmation indicator from there without searching through the forums and indicator websites. Use the tricks described here, add a line, test different periods and settings, add an MA to the indicator. Finally, the synergetic effect is easy to test, as demonstrated, you will not spend too much time to figure out you have a high % combo in front of you.
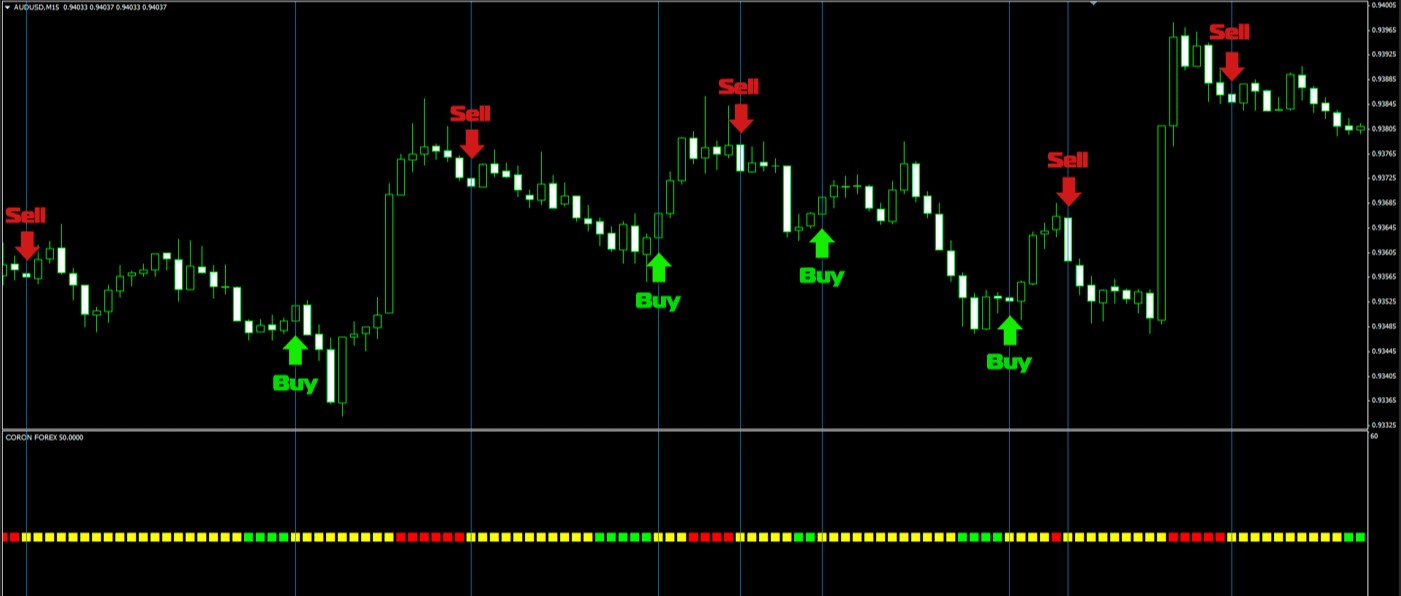
 In short, it needs to tell you whether there is enough volume to trade. Think of it as a stoplight. If it’s green (and all your other trade signals align), go ahead and enter the trade. If it’s red, however, that’s your cue to pull out of the trade. A good volume indicator will do both of these things. Another thing to keep an eye on is indicator lag. Some lag is inevitable – all indicators lag to a greater or lesser extent – but you don’t want your volume indicator to lag too much so watch out for that when searching for and testing volume indicators.