Volume is the lifeblood of forex trading but is often misunderstood and many traders don’t know how to use it to their advantage. If you imagine the market as an organism, then volume is the life force pumping through its veins and, without it, everything would gradually grind to a halt and the market would die. And yet, in spite of its importance, it still gets viewed as a somewhat unattractive part of a trader’s toolkit and is often misunderstood, misused or misrepresented. Sometimes all three. But the fact of the matter is that every consistent and successful trader will have a volume indicator that they know and love firmly integrated into their system and will check it religiously before even thinking about entering a trade.

Volume Confusion
Put simply, volume is the measure of how much of something is being traded. So far, so good. But there’s the rub. People still manage to confuse volume with liquidity, volatility, and momentum. This confusion is perfectly understandable actually. These things are all closely interrelated but they are not ultimately the same thing. A good and easy-to-remember way to think about it is that volume creates liquidity and, to a certain extent, volatility. And it certainly influences momentum.
But while you need volume to be able to trade (more on that later), this isn’t the same thing as needing volatility to trade. Just because you need a certain amount of volume coursing through the veins of the market, does not mean to say that you should be looking for the most volatile or liquid pairs and trading those. It’s important to remember this because the close interconnections between these phenomena mean that many people confuse them in their mind.
The thing to take away from all of this is that a higher level of volume shows that there is some gas in the tank and the market is more running better. This is important because the level of volume can show how robust a particular market move is, which can (along with your other indicators) give you a green light on a trade entry. To keep things uber-simple, the more volume during a price movement, the more legs that movement has got. If there is less volume, the movement is likely to lack conviction.
Why Use a Volume Indicator?
Since volume is what makes markets trend, it is crucial for technical traders and trend traders. This is not news to most people but somehow some traders try to trade even when volume is low and then come away scratching their heads when their roster of losses starts overtaking their wins. A volume indicator is just a mathematical tool that visually represents in your platform whether volume is high or low. Be careful because different indicators use different formulas, which changes how useful they are and how they are used.
A good volume indicator can cut down on the losses you will make if you enter trades when the market is running low on gas. Sure, eliminating losses is nowhere near as exciting as finding an indicator that will help you to find wins but a smart trader will be able to see the benefit immediately. The fact is if the market conditions aren’t right and your well-constructed, thoroughly tested system tells you to not trade – you’re already kind of winning because you’re not taking the hit of an unnecessary loss. You win if you don’t lose and you can’t lose if you chose not to play. That’s why you need a good volume indicator. It is key money management and risk management tool and, if you use it right, you will see how it impacts your bottom line.
So, what should a good volume indicator do?
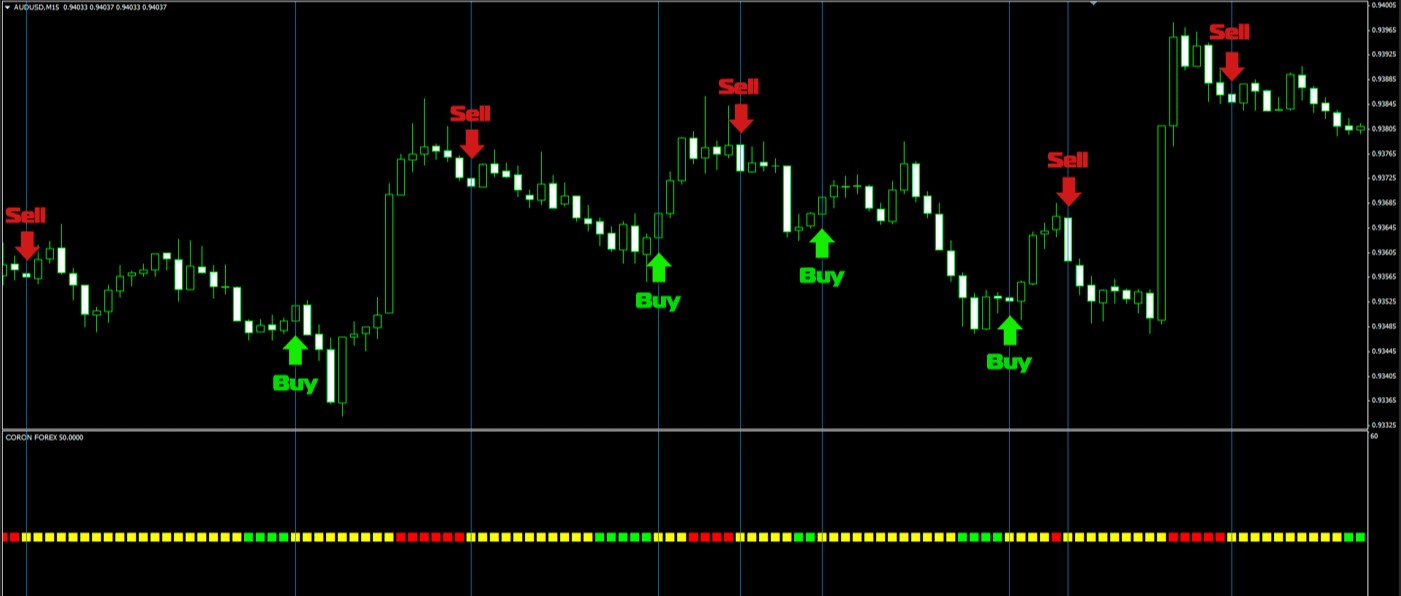
 In short, it needs to tell you whether there is enough volume to trade. Think of it as a stoplight. If it’s green (and all your other trade signals align), go ahead and enter the trade. If it’s red, however, that’s your cue to pull out of the trade. A good volume indicator will do both of these things. Another thing to keep an eye on is indicator lag. Some lag is inevitable – all indicators lag to a greater or lesser extent – but you don’t want your volume indicator to lag too much so watch out for that when searching for and testing volume indicators.
It’s just not possible to overemphasize this: if your volume indicator says there isn’t enough volume in the market at the moment, do not trade. Just like when you’re driving, you don’t hit the gas when the light is red, you don’t trade when there isn’t sufficient volume. There are a lot of factors going against you in forex trading – you can’t predict the future, you can’t control the odds of a trade going your way, you can’t influence the big players in the market … the list is endless. But one factor you can control is when you trade. If you feel – or better yet, if you calculate in a rational and systemic fashion – that the odds of a trade are not in your favor, the only smart option is to not enter that trade. It’s not that different from seeing the cards in front of you in a game of poker, figuring out that another player is likely to have a stronger hand, and choosing to fold. We could take the analogy further and figure out what a volume indicator would be in poker but that isn’t necessary – the thing to take away from this is that a good volume indicator will tell you to avoid the trades that you should be avoiding anyway.
Loss Aversion
An indicator that eliminates losses is every bit as important – if not more important – than one that increases wins. A good volume indicator is one such indicator and it is worth as long as it takes to find a good one. Combine it with a good exit indicator and you’re not just eliminating bad trades, you’re also reducing your losses. That is a force multiplier for your wins.
Ultimately, even a bad volume indicator can, in many cases, save you from making losing trades. The trick is to balance that with making the trades you can win. That’s because a bad volume indicator – while it will certainly cut down your losses – will also prevent you from entering potentially lucrative winning trades. Nobody can tell you which indicator is going to work best with your system and you should immediately ignore anyone who tries. The only thing that will tell you which volume indicator to integrate into your process is to test, test, and then test some more. You have to put in the legwork.

You also have to remember that no indicator is perfect. You have to balance the losses it saves you from and the wins it prevents. A volume indicator that tells you to avoid ten trades that would have been losses and stops you from entering three trades that would have been winning is, on balance, going to save you a lot of money. Of course, it is on you to work out how big the losses would have been in comparison to the wins and to factor that in when choosing the right indicator. In the same way, as it is your job to figure out whether you can find a volume indicator that can save you ten losses and only stop you from entering one winning trade.
But, with volume indicators (and with your approach to trading in general), eliminating losses is the path to success. Put the work in to find a good volume indicator, test it to the max and make sure it works how you need it to. Trade with confidence when it gives you a green light and, when it doesn’t, put your cards down on the table like a boss and stay out of the trade.
Which Indicator?
As we said, nobody can tell you which indicator is going to work best with your system. You will have to put the work in and figure that out on your own. However, here are some indicators to take a look at and one to avoid.
Average Volume: This is the most basic, run-of-the-mill indicator that’s already integrated into your platform. It’s a moving day average set to a specific number of days and if you’re tracking a moving price average, it makes sense to set the average volume indicator to the same number of days. Bear in mind that anything less than 50 days is going to throw up a lot of unnecessary noise.
Force Index: This measures how bearish or bullish the market is at a given moment. You can use this in conjunction with a moving price average to measure how significant changes are in the power of bullish or bearish sentiment. It won’t do the job of telling you when to avoid a trade so much as it will tell you how robust a price trend is.
Volume Oscillator: This is a combination of two moving averages, one fast and one slow (with the fast one subtracted from the slow one). It can show you how strong a prevailing price trend is by tracking when a price movement is followed by an increase in volume. When the indicator is above the zero line, this may be a sign that the prevailing trend has some wind in its sails. Conversely, a change in price followed by a slump in volume is a good sign that the trend is lacking strength.
On-Balance Volume: Just like the Volume Oscillator, this indicator is trying to show you whether a price movement is backed by an increase in volume. It does this by combining price and volume. On an up day, the volume is added to the previous day’s score and on a down day, it is subtracted. Again, this will give you an indication of the strength of conviction behind a given price movement.
Accumulation/Distribution: The A/D line seeks to confirm price trends or highlight weak movements. Volume is accumulated when the day’s close is higher than the previous days close and distributed when the day’s close is lower than that of the previous day. The main way you use this indicator is to detect whether there is a divergence between price movement and volume movement.
Average True Range: Volatility is, as you now know, very closely related to volume and, as a result, you might be able to use some volatility indicators in place of a volume indicator. One advantage of doing this is that volatility indicators can be easier to read and some people chose to use the Average True Range (ATR) as a stand-in for a volume indicator. There are several problems with doing this, however, and here are just a couple of them. For one thing, it can be nearly impossible to figure out where to place the cut-off line – the line below which you will listen to your indicator and pull out of a trade.
Firstly, that line will have change and adapt as markets change, which means you will constantly be lowering or raising it. Secondly, you will also need to have a separate cut-off for each currency pair you trade. Thirdly, you will have to raise or lower the line for each currency pair as market conditions change over time. And, as if all of that weren’t enough, you will have a hard time backtesting it because of this inconsistency over time and across currencies. A good volume indicator should be consistent over time and reflect the market in most, if not all, conditions.