Do you trade using indicators? Still do not know this indicator created by Larry Williams? The Williams %R indicator, although less popular than others, is worth studying.

Introduction
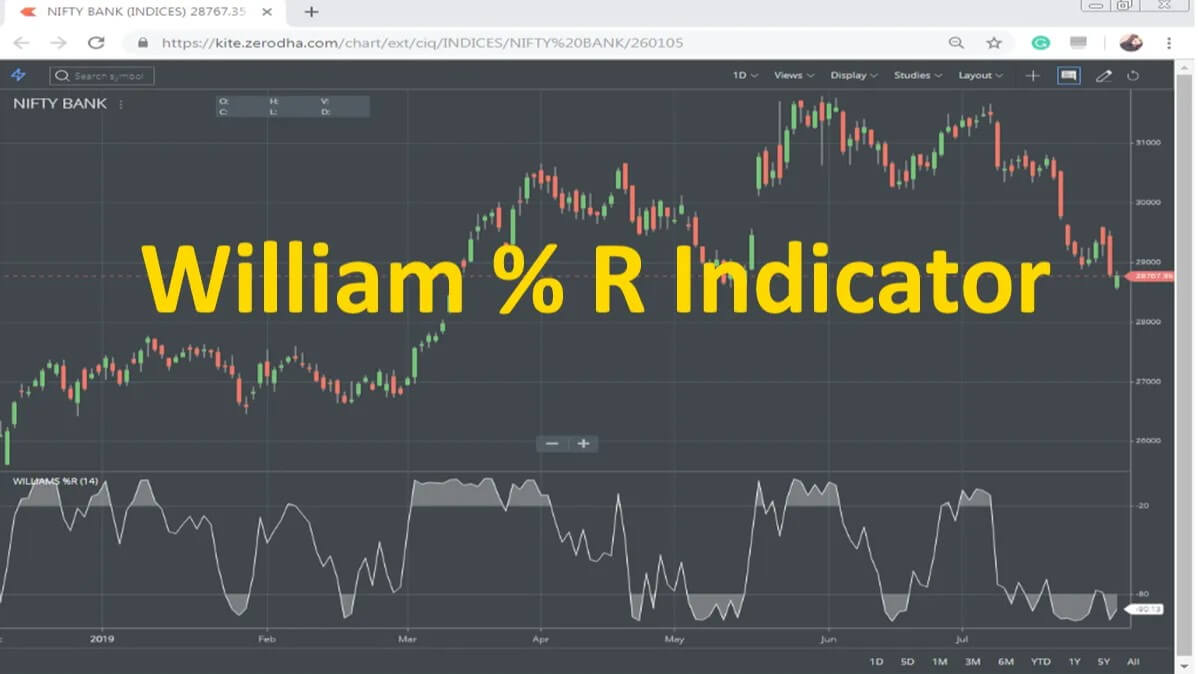
The Williams %R is an impulse indicator developed by Larry Williams. It moves between 0 and -100, providing information about the weakness or strength of a financial instrument, i.e., stocks, currencies, or commodities. It can be used as overbought/oversold levels, impulse confirmations, and trading signals. Readings from 0 to -20 are considered overbought. Readings from -80 to -100 are considered oversold levels.
Calculus
The formula used to calculate the Williams %R is:
% R = (Maximum – Closing) / (Maximum – low) * -100
Minimum = lowest minimum over the period analysed.
Maximum = highest maximum in the period analysed.
The default setting for the Williams %R is 14 periods. It can be days, weeks, months, or an intraday period of time. An R %of 14 periods would use the most recent closure, the maximum of the last 14 periods and the minimum of the last 14 periods. The Williams %R has only one line by default.
When the indicator is:
-Near zero shows that the price is quoted near or above the maximum during the period analysed.
-If the indicator is close to -100, the price is traded near or below the minimum of the analysed period.
-Above -50, the price is traded within the upper part of the period analysed.
-Below -50, the price is traded at the bottom of the period analysed.
If we look at the daily chart, AAPL shows overbought at the -4 level. Back sessions were at the -80 oversold level.
Interpreting
Williams’ interpretation of %R is very similar to that of the Stochastic Oscillator, except that %R is traced backward and the Stochastic Oscillator has internal smoothing. Williams’ interpretation of %R is very similar to that of the Stochastic Oscillator. Values in the range of 80% – 100% want to tell us oversold, while readings in the range of 0 to 20% suggest that it is overbought.
Like other overbought indicators – oversold, the most favorable thing will always be to wait for the price to change direction before trading. The over-purchase may remain for an extended period of time. For example, if an overbought indicator – oversold (such as Williams’ Stochastic Oscillator or %R) shows an overbought condition, it is advisable to wait for the price to fall, before selling if you already have a long position or a stop loss.
Often, the %R indicator helps to find a turnaround in the stock market almost at the right time. The indicator usually forms a peak and then turns offa few days before the value price turns. Similarly, the %R usually creates a drop and goes up a few days before the price resumes.
Like the vast majority of overbought indicators – overbought, it is much better that we wait for the price to change direction before trading.
Using the William %R Indicator Correctly
- To identify over purchases in an Index or stock.
- Centre line of the WILLIAMS %R indicator.
- Divergences
Let’s look at each of them in the most detail.
To identify levels of over-purchase:
The indicator ranges from 0 to -100. No matter how fast action moves or falls, the Williams %R indicator fluctuates in this range. Oversold and overbought levels can be used to make an identification price extremes, which appear to be unsustainable.
-Williams %R above the threshold of -20 is considered overbought.
-Williams %R below the threshold of -80 is considered to be oversold.
As is known, a market may remain overbought for an extended period of time. Trends with some strength usually present a problem in these oversold levels – overbought already classic. WILLIAMS %R can be overbought (> -20) and prices can simply continue to rise when the uptrend is strong. In contrast, the WILLIAMS %R may be oversold (-80) and prices may simply continue to fall when the trend is strong.
Amazon has a WILLIAMS %R at 14%, in a daily chart. Seeing, from left to right, Amazon came to overbought at -3 in early December, when it traded around 696. Amazon did not reach the peak level as soon as the overbought reading appeared. It took a few days but then we saw a drop of almost 149 points. 19%. From overbought levels of -3.1, the WILLIAMS %R moved around -98 in mid-January towards the oversold terrain. Despite this oversold reading, Amazon continued to fall to the ground on January 20. Traders must always confirm the WILLIAMS %R indicator with price action or price action. On 20 January a Hammer sail was formed with the oversold WILLIAMS %R. This confirms that the short-term soil was reliable and recovered up to $638 a share. The WILLIAMS %R indicator was overbought and again we saw drops. Overbought and oversold levels are marked on the charts.
Centre line of indicator WILLIAMS %R:
The WILLIAMS %R indicator detects bullish and bearish movements in the market by observing when crossing above or below the WILLIAMS% R-50 level. After being overbought and oversold, if the Williams %R crosses the -50 line, it usually indicates a change in movement.
If you can find the Microsoft chart from April 20, the DOJI formed by Microsoft suggests a trend change. It also broke -50 which also suggests a change. In the example illustrated above, the %R of MSFT was overbought, then the share price began to fall and the %R crossed below the -50 line quickly, before most of the bearish movement occurred.
It is advisable to use the price stock with this Williams-based %R strategy to increase the odds of success. . As you may have observed, in the above example, the bar that pushed the reading of the Williams %R, below -50, was a DOJI. This usually warns of a change of trend if the next candle is also bearish. Traders should open short positions in MSFT with Stop Losses just above the DOJI sail. The trader would have entered the market when the bearish momentum was at its highest. Therefore, you could have managed to place a tighter stop loss, which in turn would increase your risk/reward advantage in this particular operation.
It is possible to use this strategy to be able to open a long position when the %R is above -50after it has been oversold for a period of time.
It is highly recommended to use price action in combination with this Williams-based %R strategy to increase the odds of success.
Divergences:
The WILLIAMS %R divergence occurs when there is a difference between what the price action indicates and what the WILLIAMS %R indicates. These differences can be interpreted as a sign of an imminent turn. There are two types of divergences. Bearish and bullish.
Bullish divergence WILLIAMS %R:
A bullish divergence occurs when the WILLIAMS %R is oversold, below -80, increases above -80, remains above -80 in recoil, and then breaks over its previous reaction at a higher level. A bullish divergence forms when prices move to a lower minimum, but the indicator forms a higher maximum.
WILLIAMS% R bearish divergence: when the price reaches a new maximum, but the WILLIAMS %R reaches a lower maximum.
If you can see a Facebook chart, the price dropped to 77.22 on May 5. WILLIAMS %R went straight to the oversold area. It moved up and up even further, but the price dropped to 76.79 on May 12. Once the WILLIAMS %R moved above -80 and we had a bullish enveloping pattern, as shown above, we marked the turn. The price recovered up to $83.
Conclusion
The WILLIAMS %R index is a unique impulse indicator that has stood the test of time. The WILLIAMS %R is best suited to identify possible spins in overbought/oversold levels and bullish/bearish divergences. As with most indicators, WILLIAMS %R should be used in combination with another indicator or with the price action. It is possible and positive to perform the combination of using WILLIAMS %R with price patterns with the objective of increase signal robustness. If you operate intelligently, by combining price action, and use the Williams %R to confirm the momentum in the market, your likelihood of ending a profitable trade would greatly increase.