Indicators are a tool that Forex’s technical analysis, traders, and statisticians use in financial markets to take a statistical approach rather than a subjective approach to trading. They will use things like money flow, volatility, timing, and trends to get a better picture of the potential price movement. Thousands of indicators currently available, which means there is a lot of debate about which are the best.

Advanced Indicators
Advanced indicators are one of the two main types that are available to traders. They tend to anticipate any price movement and predict the future. They tend to be used for trading in ranges, as they may give signs of a potential break, which of course is very powerful information to have.
Some of the most popular forward indicators are the stochastic oscillator, and the relative force index RSI. The worst part of these indicators is that can pre-empt events and perhaps give false signals occasionally. This is because most people will use something more than an advanced indicator, using it as a secondary indicator in addition to simple price action. Just as with most indicators, there is a complex mathematical formula that shows the moment and where the market will go.
Back Indicators
In contrast, retrospective indicators tend to follow the movement of prices. They are much more useful in the course of a well-defined trend, as they tend to give signals after the most popular indicators. This, unfortunately, comes with the disadvantage of being less profitable, even though they are more reliable. Retrospective indicators have been popular for years and are still one of the most basic indicators that traders will use.
Two retrospective indicators would be Bollinger bands and moving averages. As an example, the moving average is the estimate of the average price of the last “N” candles, which by virtue of its definition excludes the current price. However, in a trend, this information can be very useful, as it shows that the average price is going up or down. Again, as we mentioned earlier, these indicators are typically part of a larger trading system.
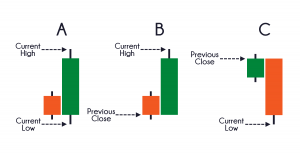
There are several types of indicators:
Oscillators
Oscillators are by far the most used technical indicator, usually subject to some sort of range. Generally, there is a complete range between two values that represent respectively the overplayed and over-bought conditions. Typically, there is some kind of line or indicator that lets you know when the market is going too far in one area or the other. A couple of examples could include the stochastic oscillator, the moving average convergence divergence, and the feedstock channel index. Even though these could measure the condition of over-bought and overbought with different formulas, in the end, they work in the same way.
Indicators with No Range
The non-rank indicator is much less common, but will usually be used to form signals in a trading system to show strength or weakness in a trend. Unlike oscillators, they generally do not have a set range. For example, the accumulation/distribution line indicator that measures the flow of money to a value is an example of an indicator without a range. However, in the world of Forex, you will realize that this is almost impossible to measure, however, some volume variations are going to be offered by forex brokers, using information from their own servers, which is only a part of the market.
The Use of Indicators
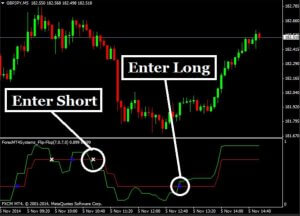
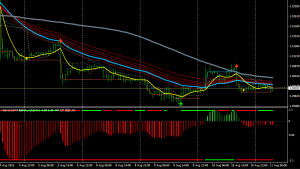
While there are some trading systems that use indicators only, these do not tend to be commonly used today. One of the most common systems that only use indicators is the system of crossed moving averages. This consists simply of graphing two moving averages on a graph, which (if you remember), are simply a mathematical average of a specific amount of prices over a certain amount of time, being one of the moving averages the slowest, and the other the fastest. The quickest is the one with the fewest candles, which will make you change direction faster. The less rapid one represents a more stable environment because it takes much more information to move around.
But if the fastest line crosses over the slowest line, this can mean that the moment is moving up, which is a sign of a buying opportunity. Otherwise, if the moving average falls below the fastest line, this is typically a signal to sell. With the system of crossed moving stockings, you are constantly on the market, buying and selling when these lines intersect. The biggest problem is that you need a strong trend to make profits. In a market that is not very active, you could be crushed.
As a general rule, the most beneficial thing is to combine support and strength with those indicators as it gives you different types of confirmation for your trade. A typical example would be to look for support, a particularly encouraging candle, and then buy a signal formed on the stochastic oscillator. The typical system will have a certain number of steps to go through to put money to work. Beyond that, you begin to pay attention to money management, and then before you realize you will have an entire system set up. You should think of the indicators as a tool, not the “holy grail” that so many traders are always looking for. As these increase your chances of success, nothing is perfect, and you should learn how they work and when they work if you are going to use them in your trades.
Since there are literally hundreds of indicators that can be used, preferences play an important role in selecting those who have more security for you. For what it’s worth, the more I trade, the less I use indicators to make decisions. When I use them, they are usually secondary and tertiary reasons.