30Test, test and test – the three most important things about choosing a new indicator. But can testing lead you down the wrong path?
Before you even think about introducing a new indicator to your forex trading system, you’re going to want to test it to death to make sure it works how you need it to work. Typically, that will mean backtesting it over a certain timeframe – up to and even over a year back in time if you’re trading on the daily chart – as well as forward testing it through a demo account. Now, for several reasons backtesting is your first go-to method of figuring out whether an indicator performs as advertised and as you need it to.
The main reason why backtesting is important and why you want to run that first is that it is so much quicker than forward testing – which you, of course, should also do. When backtesting you don’t need to wait for time to unfold at its natural rate – you can make things a great deal quicker.
Testing Trap
One potential pitfall or trap that an indicator testing process can lure you into – and that can be potentially dangerous if your testing regimen is not sufficiently robust – is the repainting indicator. What is a repainting indicator and why is it dangerous? Well, the short answer is that a repainting indicator is an indicator that moves the goalposts after the fact. It keeps changing its past values based on new candles and therefore makes it seem like it was more successful historically than it really was. This will, however, clearly be much easier through the use of a concrete example.
Backtesting an Indicator
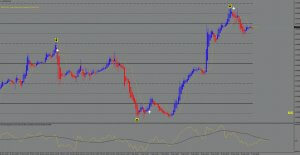
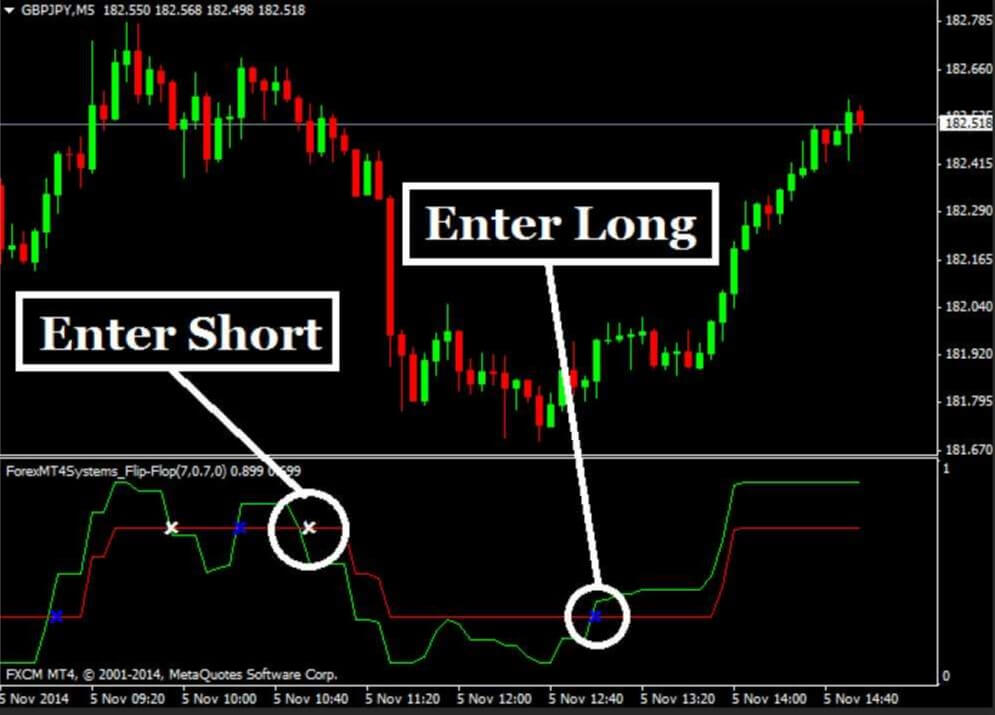
So, let’s say you’re taking apart a combination indicator (like, for example, the Traders Dynamic Index) in order to have a better look at its constituent elements. Combination indicators, like the TDI, are made up of a number of separate indicators that work in concert together to provide what is hopefully a more accurate picture. You can, of course, test combination indicators as though they are one unit simply by treating them as a whole made up of constituent parts. But with combination indicators, there is also another possible approach and that is to examine each of the elements that make them up as a separate indicator. In fact, this is a very important way to test combination indicators – because if someone has gone to all the trouble to wrap up what amounts to a whole trading system into one downloadable tool, you’re going to want to know that all the parts of that tool work, right? Whenever you encounter a combination indicator, make sure you take it apart and test all of its components separately, as you would any other indicator. You can, afterward, always go back and test the whole combination as one tool.
The way to isolate those elements you want to test is to turn off or blank out those parts that you’re not looking at. Sticking with the example of the TDI, you might want to focus on one of the moving averages and temporarily (for the purposes of the test) turn off the other moving average, the Bollinger Bands, and the RSI. If you do this with the TDI, for example, you might notice as other traders have too that there’s something kind of special about the yellow line indicator. It seems that every time the line changes direction it is indicating a price trend. Indeed, it seems to be predicting price trends with an astounding level of accuracy that goes far beyond anything most indicators are able to achieve. Sure, you can’t use that as a trade entry signal but boy is it useful to have an indicator able to predict trends with a level of accuracy that exceeds 80 or even 90 percent. That’s astounding!
Too Good to be True?
How often is it that you find an indicator that you can add to your system that can achieve such levels of accuracy? Just imagine how many bad trades that will cut down on and how many winners it could help you to find. Well, if an indicator does come around and it looks like that, that’s your first red flag. Consider it a shot across your bows that sets alarm bells ringing.
If you’re being thorough and backtesting across multiple currency pairs and over a significant time period and you still come across something that is this accurate, that’s your first warning sign that you could be dealing with a repainting indicator.
As we said before, a repainter is an indicator that will draw you into thinking you’ve found the holy grail of indicators but could be truly dangerous if you start using it without taking the proper precautions. For a start, if you don’t put it through a comprehensive forward test and just rely on your results from backtesting, you could end up losing serious money.

Recognition and Identification
So, how do you know if what you’re dealing with is a repainter? Well, the first part of the problem is to recognise that you have a problem. The first clue should be, as above, that it performs so well in backtesting that you begin to suspect it isn’t quite what it seems. That’s step one. The second step is to identify it as a repainter.
What a repainter will do is basically change shape once a few candles have passed to show an outcome that better reflects what happened with price movements. In other words, the indicator will go back in time and repaint itself to show signals where there were no signals. That is a huge problem you’re your backtesting process and will mess with your results. An indicator that doesn’t repaint will stay the same as the chart moves on and will faithfully record what it showed you as the candles close but a repainter won’t.
The way to see that is to run the indicator through a fast timeframe and essentially catch it in the act. Go to a fast chart, like the five-minute chart or the one-minute chart, and run it through to see if it changes the data. Here you might want to even grab screenshots along the way because those changes might be quite subtle as time rolls forward and you may not want to wait long enough for it to give off false signals. If not, then those false signals will be a sure-fire sign that something is off. A false signal, in this case, is where the indicator initially does not show up a signal but as the candles move on it repaints itself in hindsight and shows up a signal.
Another quick way of testing if an indicator is a repainter is using the MT4 Strategy tester module. Just set to work on a fast timeframe and look at how it behaves on the closed candles. Just bear in mind about the scale for that indicator. Sometimes when the value of the indicator pushes the window limits, or better to say higher or lower values which are not on the scale, the scale itself resizes to fit the representation. This can lead you into thinking the lines or historic values of the indicator repaints, but it is just because extreme values resize the scale and it may seem as indicator lines are reshaping.
Catching a repainter in the act is the best and surest way to know that this is an indicator to steer clear of. The reason to use a fast chart in order to do this is because things will happen quickly enough for you to catch it and also because you don’t want to waste your own time waiting for a slower chart to unfold. Part of the purpose of backtesting is to eliminate indicators that would otherwise be a waste of your time to forward test through your demo account so making the process unnecessarily long would kind of defeat its purpose.
If you’re running an indicator through this repainter test on a fast chart and you see any kind of movement at all a few candles back, in the region where the data is supposed to be fixed, that is already too much movement. This is why it is a good idea to shoot off a few screenshots as you’re doing this because even the tiniest amount of alteration of data that is supposed to be fixed because it’s in the past is too much.
In addition to screenshots, another thing that will help you to identify a repainter is larger price movements. If you’re running an indicator through a one-minute chart but the price is not moving much, you will have a hard time catching any unwanted changes to the indicator’s history but if the price is moving up and down more drastically, those changes are likely to be more visible. Also, make use of the drawing tools in your platform to mark signals the indicator gives off as you go along. If you look back and signals you marked turn into non-signals or if new signals appear where you didn’t mark them, then you’re dealing with a repainting indicator.
![]()
Repainter Alert
So what can you do if you run a repainter check and the indicator you had such high hopes for because it looked so good in backtesting turns out to be repainting? The short answer is there is nothing you can do. Just steer clear of it like it’s the plague. Bin it and never think another thing about it.
The long answer is also there is nothing you can do. To change the indicator you would have to break into the code and start messing around in there to reprogram it. Now, some of you may feel that this is something you’d be good at and that’s fine as far as it goes. Just be aware that the reprogrammed indicator is going to essentially be a whole brand new indicator that you have to run through the full gamut of testing from scratch. None of the backtesting you’ve done on it so far will apply. However, even if you reprogram an indicator so that it no longer repaints, you now have to start wondering what else might be wrong with it.
Therefore, the best option remains scrapping it and continuing your search for indicators elsewhere.
Protecting Yourself
So, what can you do about repainters if you can’t fix them? Well, you can identify them and avoid them. Expand your testing regime to include a repainter check as described above – especially for indicators that seem to be too good to be true. Although you should really do this with every indicator before you introduce it into your system.
The second thing to do is to make sure you run proper forward testing and cross-reference this with results you expected to get on the back of backtesting you did. These will never precisely match up, of course, but there is a chance that this will help you catch out a repainter.
The last thing you want to do is introduce a repainting indicator into your system and use it to trade in the real world. It will throw your results off and it will require time and effort to identify the problem – hopefully before you lose too much money.
Finally, never get so hopeful or sentimental about any aspect of your trading system – whether it’s an indicator, a process or an approach – that you can’t ditch it the moment you discover it isn’t working for you.