Instead of using your own judgment, some statistical measures of price volatility are available. One of the most popular is the ATR indicator (Average True Range), which measures the average movement for a given exchange torque ( or action, raw material, etc.) for a given period.
What Is the ATR Indicator?
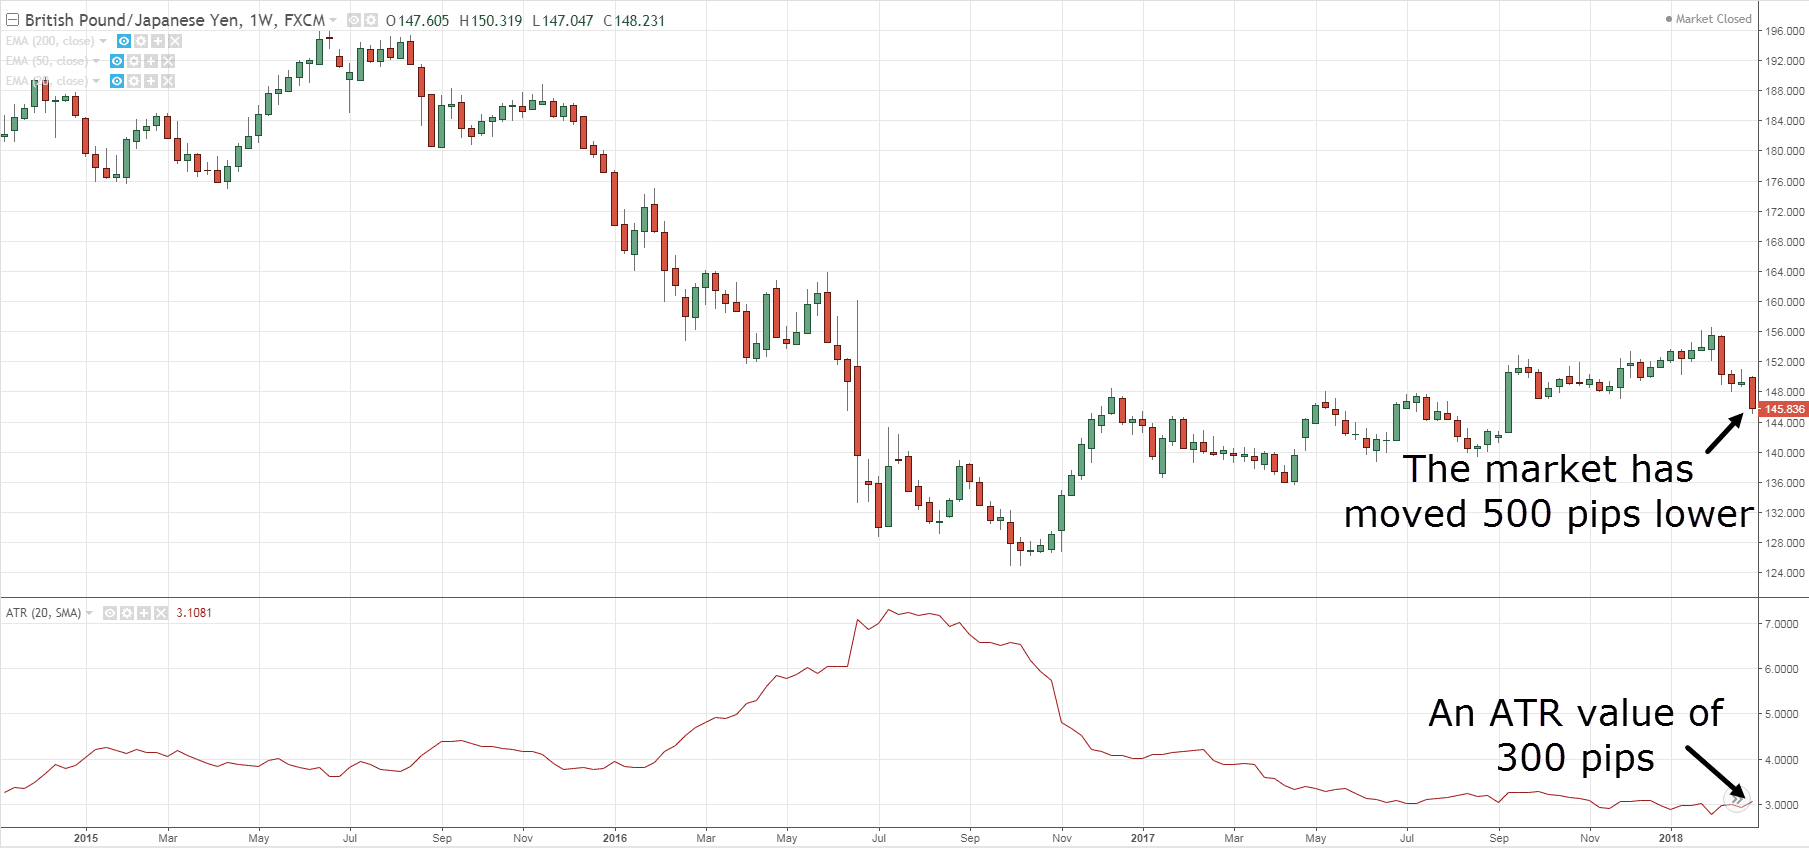
The ATR indicator moves down and up as the price of an asset becomes larger or smaller. This indicator is based on price developments, so the reading is in dollars. For example, in share trading, a reading of 0.23 of the ATR means the price ranges from $0.23 on each price bar. In the currency market, the ATR will show you pips, then 0.0025 is the same as 25 pips.
A new reading of the ATR indicator is calculated as each period passes. On a one-minute graph, a new ATR reading is calculated every minute. In a daily graph, a new ATR reading is calculated every day. All these readings are plotted as a line continues, so traders can see how the volatility has changed as time goes on.
Since the ATR is based on how much an asset moves, the reading of an asset is not comparable with other isolation assets. To better understand the indicator, here is how we calculated it.
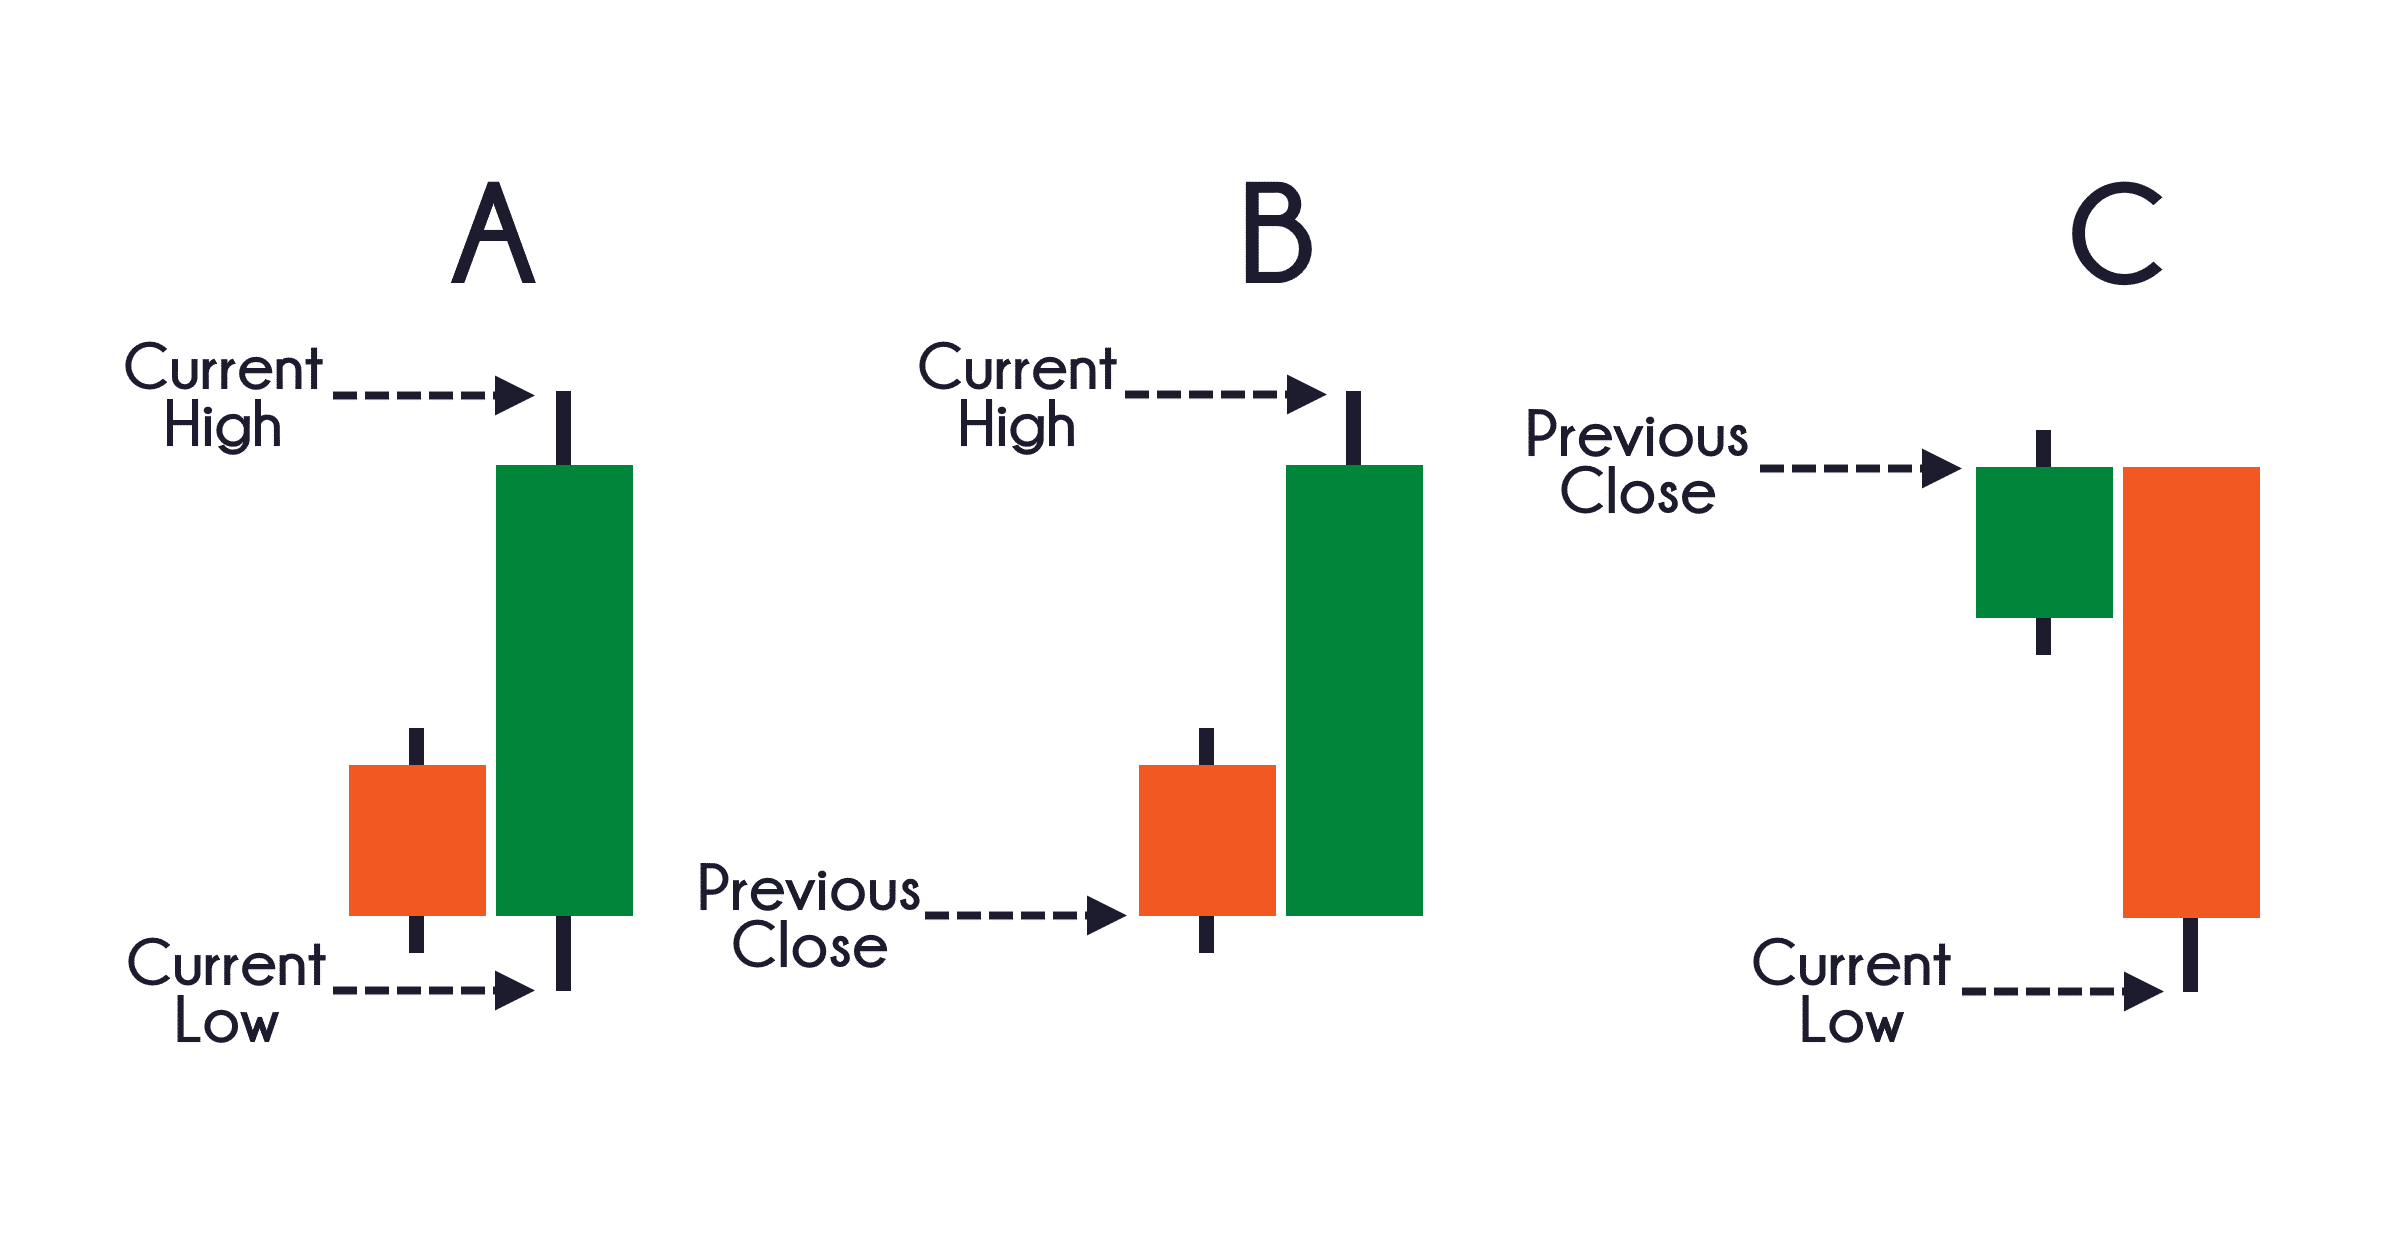
Finding the A, or average first requires finding the true range (True Range TR).
The TR is the largest of the following:
- The current maximum less previous closure
- Current minimum minus previous closure
- Current maximum minus the current minimum
Whether the number is positive or negative, it doesn’t matter. The highest absolute value is the one used in the calculation.
The values are recorded every day, and then you get an average. If the ATR is averaged over the previous 14 periods, then the formula is as follows:
ATR = [( ATR Previous x 13) [ TR Current] / 14
Continue reading about the ATR or start playing a little with a risk-free demo account and see for yourself how the ATR indicator works in real-time.
Setting the ATR Indicator
Typically, the default parameter is 14 periods, that is, 14 days on the daily graph, 14 hours on the hour graph, and so on, but as time goes on you want to experiment with the parameters. Knowing the ATR for a certain period, traders can choose to place a stop loss at a certain percentage of that range, based on the entry point. Let’s take an example, traders with confidence in the trend direction who want to prevent their stop loss from being reached would place the stop loss at 80 or 100 percent of the ATR away from the entry point near strong support. They will accept the long loss if that stop is reached because they believe that the probability of that happening is slim.
Traders with lower confidence and greater risk aversion that they want less loss (even if there are more of them because the stop is reached) can place their stop closer, perhaps 50 percent or less from the ATR indicator outside the point of entry. When you know the usual volatility for a given period of time through ATR, you have a better idea of how far you want your stop loss fixed or dynamic to prevent a random movement from reaching it.
Let’s use an example of how to use the ATR indicator to measure volatility and place a fixed or dynamic stop loss command.
Measuring Volatility
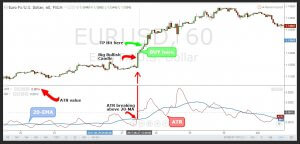
We refer to the example above. In the figure below, we show the same daily graph EURUSD showing the daily candles for the transaction’s entry date on August 11, but this time we include the ATR, which shows that for the past 14 days or candles daily, The average price range was around 210 pips. Those interested in how the ATR is calculated can view it online.
However, if we wanted to decrease the chances of reaching a stop loss in exchange for a risk of further loss if the transaction turned against us, we could have established the stop loss at a distance of 50 percent or more from the ATR, 105 pips, below the point of entry or some different percentage of the ATR.
The point here is that there are two different ways to determine how far you are going to establish your stop loss. In this example of fórex trading, we use the most recent minimums as a guide while we could have used the ATR. Much depends on factors such as your appetite for risk, market conditions, and confidence in the transaction. For example, if you caught a retraction to strong support in a strong general trend, you may be more confident that that upward trend will return and allow a wider stop loss to prevent it from being triggered by random price movements. When you have less confidence, you can keep the stops tighter.

Setting an ATR Indicator in MetaTrader 4/5
This section shows how to configure the ATR indicator in MT5. Assume that you have opened a graph.
Adds an ATR indicator and sets the parameter for this indicator:
- Click on Insert and move your mouse over Indicators and Trend
- Click ATR indicator
- Configuring the common parameters
After you have completed the above step, the settings menu appears. Most indicators can be controlled by many common parameters.
There are two types of parameters:
- Indicator calculations: e.g. the number of periods used by the ATR indicator (you don’t need to worry about this much in the beginning)
- Display of an indicator: e.g. How will it look? The thickness and colour of the lines, etc.
To change the indicator settings directly on the graph a while later: Right-click on the ATR indicator (you will have to be very exact on the indicator line to see the menu below)
Choose the ATR Properties: The menu parameter appears again where you can change the indicator.
To delete the ATR indicator: Right-click on the indicator you want to delete (you will have to be very exact on the indicator line to get the menu below). Click ‘Delete Indicator’ and the indicator will disappear from your chart.
Final Words
The ATR indicator is not directional like the MACD or RSI, rather as a unique indicator of volatility that reflects the degree of interest or disinterest in a movement. Strong movements, in either direction, are usually accompanied by long ranges, or long and true ranges. This is really true at the beginning of a movement. Not-so-inspiring movements can be accompanied by relatively narrow ranks. As such, the ATR can be used to validate the enthusiasm behind a movement or a rupture. An upward reversal with an increase in ATR would show a strong buying pressure and the reinforcement of a reversal. A break in bearish support with an increase in the ATR would show strong downward pressure on sales and reinforce the break-up of the support.
Understanding how to read the ATR indicator is important, but if you want some help, Metatrader offers a very useful indicator toolkit. Play a little on a demo fórex account and see for yourself how the ATR indicator can give you a lot of money.


