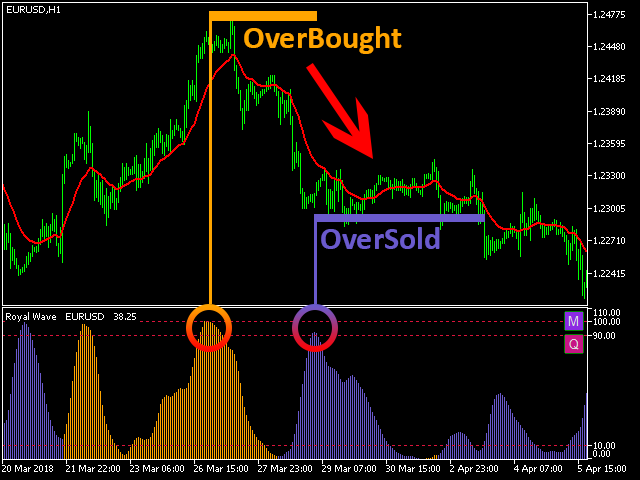
Royal Wave is a Trend-Power tool based on a price adjustment algorithm that performs statistical analysis of price movement to predict and locate low-risk entry and exit areas. This alert system generates well-timed trading signals that give the trader enough time to make the most appropriate trading decisions.
Features of the Royal Wave Pro:
- Algorithm of trend power.
- Low-Risk Entry and Exit Zones.
- Predictions for areas where the asset is overused and oversold.
- Rich Alerting System (these are sound alerts, SMS notifications, Zone Flasher, etc.)
- The oscillation range from 0 to 100 facilitates the understanding of the signal.
- Analysis of various terms and currencies.
Areas of Entry:
Once the value of the oscillator is almost zero it means that there will be a significant movement in the price shortly because traders in most installments agree on the current price and have come together to move the price of a big step in one direction. Therefore, this indicator predicts entry areas with a low risk where the price only seems to move in one direction until the moment the oscillator reaches the exit zone. The entry zones are always going to be the beginning close enough to a big move in price.
Zones de Salida (Exit Zones):
When the oscillator reaches the output area in the 100 environments, it is predicting an overbuy when the color is yellow, or an excess when the color is blue. This zone can be used to exit an operation or update a stop loss level due to the high probability of reversals in these areas.
The exit points of the zones are potential candidates to be points of reversal in a trend. By using the real-wave signal array, some of these areas can be identified as low-risk to enter a reversal trade.

Trend and power supply:
The oscillator value represents the current power of the trend ranging from 0 to 100. When energy is rising, a yellow color indicates a steady upward trend, and blue color indicates a strong downward trend. A decreasing power shows consolidation, which means that there is no trend in price, and the trader must wait for the entry zone.
Signal Matrix:
Gives an informative view of various symbols against all time frames in a matrix. Each cell in this matrix is a brief representation of the price behavior of a symbol from a single time frame.
Transversal Window:
View and compare data from an arbitrary symbol and time frame within a graph with a different symbol and time frame. This tool can be used to develop multiplayer and multi-timeframe strategies.
In short, we are talking about a reasonably comprehensive indicator. Created in May 2019, it has already had some updates from its developer Ehsan Tarakemeh. At the moment, you don’t have any comments from users, but personally, we think it is an indicator that can be very useful in our trade, and we would put this indicator on the waiting list so that it can be added over time.
It would be advisable to use the free trial version to get to know it better. Its selling price on the MQL market is 129 USD, or 69 USD if you prefer to rent it for 3 months.


