Categories
Forex Service Review

Sigma Pro Indicator Review

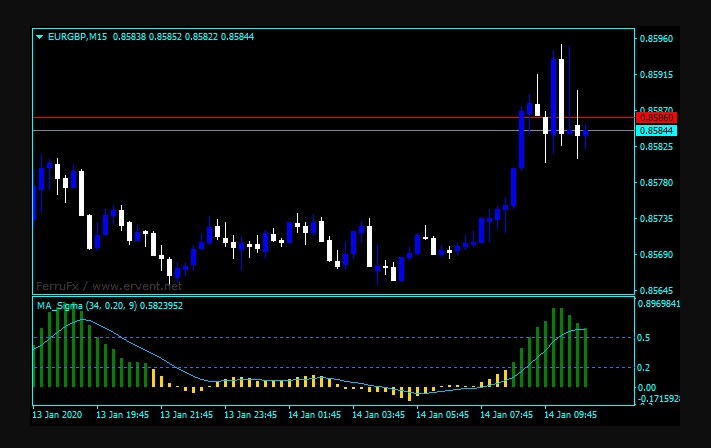
Sigma Pro is an indicator created in October 2019 by developer Reza Yavari Chahar Mahal Bakhtiyari. Basically, the Sigma Indicator is an indicator that can identify market caps and funds. It works very well in the trend market and the no trend market.
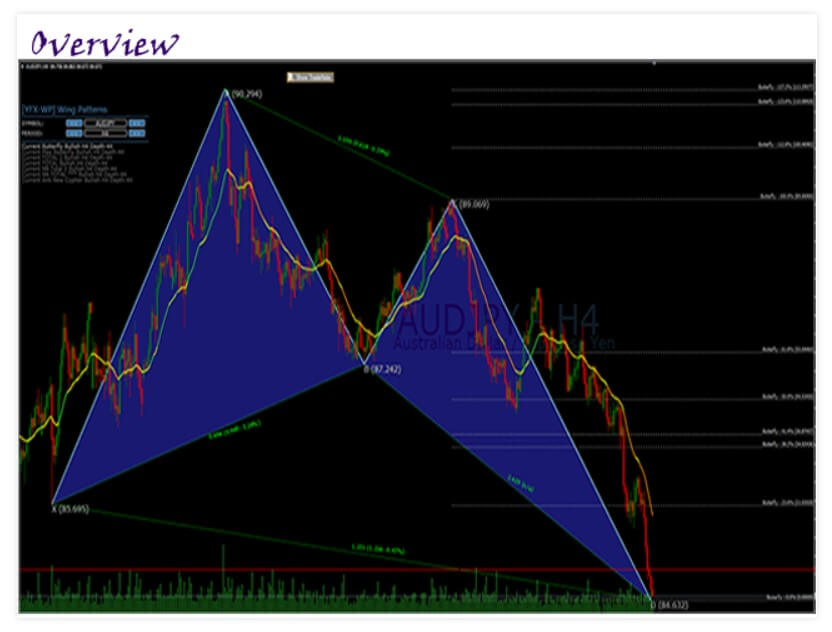
Overview

This indicator is useful for oscillating exchanges as well as scalping. It works in all markets, including currencies, futures, stocks, and commodity markets. Sigma Pro is a system with an input and an output point.

The creator claims that a fully mechanical system with a clear entry and exit point is needed to succeed. So you can control your emotions and this can make your trading easier. This indicator is free for a limited period of 4 weeks, and you can test and take evidence without paying any money and without risk.

Basically, there are three strategies can be developed with this indicator…

The first is as follows:

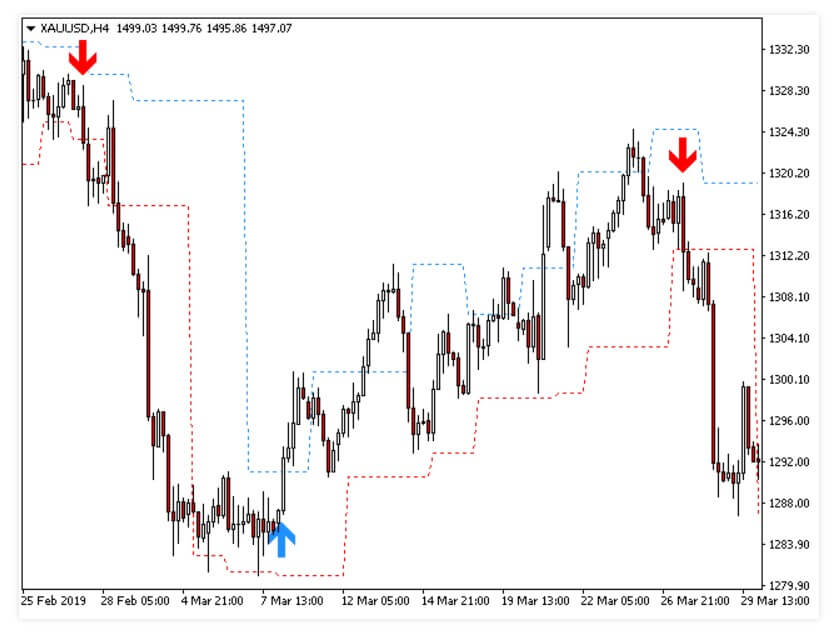
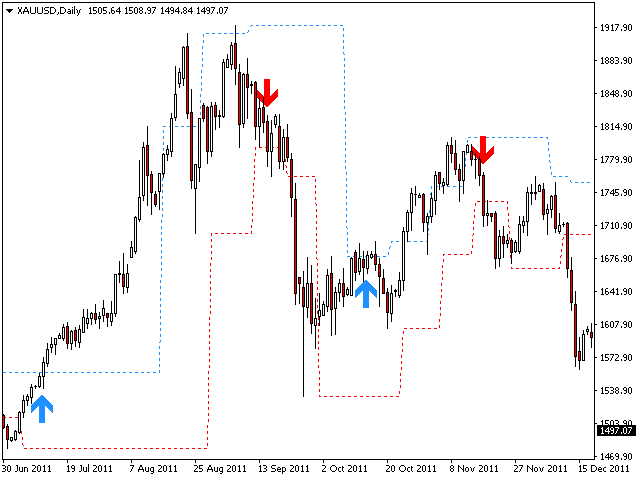
Step 1: Determine the trend

  • Higher and higher lows = Uptrend.
  • Low and low = Down Trend.

Step 2: Take the sign

  • If the market is uptrend just take a bullish signal.
  • If the market is Downtrend it only takes a low sign.

Step 3: Determine your Stoploss.

  • Between 1 and 3 percent of the account (or your personal preference).

Step 4: Exit point

  • Set the period 30 to 70 for the Buy Out signal and the Sell Out signal.

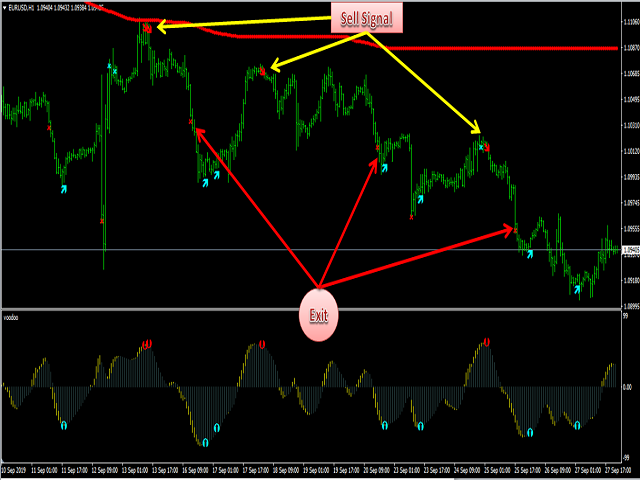
The second strategy involves:

Purchase Mode: If the signal arrow is to buy, you buy and if the next purchase of the signal is lower than the previous buy signal, it is added to the volume of the position.

Mode of sale: If the arrow is a sign of sale, you sell and if the following sales signal is higher than the previous sales signal, it is added to the volume of the position.

Output point: When you see the output signal. (You can also use the RSI or Bollinger band indicator).

The third strategy:

Purchase Mode: If the arrow sign is bought and price lower than Bollinger band (deviation = 1, period = X), you buy and if the next purchase signal is lower than the previous purchase signal, add to the position volume.

Selling Mode: If the arrow sign is for sale and price higher than Bollinger band (deviation=1 , period=X), you sell and if the next selling signal is higher than the previous selling signal, it is added to the position volume.

Output point: When you see the output signal. (You can also use the RSI or Bollinger band indicator).

Sigma Pro Characteristics:

  • Very simple and usable for all traders.
  • Capacity works in any time frame and any MT4 pair.
  • Do not paint (The indicator does not change the signals after the candle closes).
  • Notification and sound alerts function.
  • The ability to use as an input signal for your strategy.

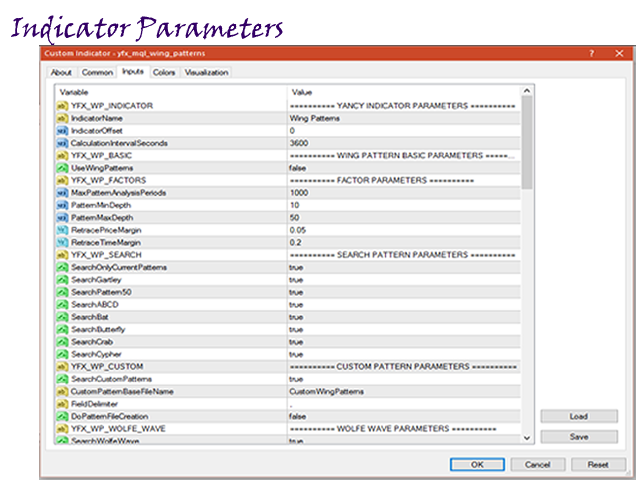
The main parameters are as follows:

  • Exit buy signal
  • Output signal
  • Sound alert

Service Cost

The indicator you can find in the MQL market and its selling price is 39 USD, which we consider to be a pretty attractive price. As mentioned above, it can be tested at no cost for a period of four weeks. Obviously, most if not all will want to take advantage of that free trial. 

Conclusion

In short, we are talking about an indicator that indicates the levels of over-purchase and over-purchase of assets. A straightforward indicator that can be used by all types of traders. We also have the advantage that we can use it for free for a period of 4 months, long enough to know if the indicator is of our use and we want to acquire it or not.

There are no user comments about this tool but we know that the developer is a very attentive person and will answer any questions or questions you have very quickly.

Categories
Forex Service Review

True Currency Strength Meter Indicator Review

The True Currency Strength meter can be found in the Indicator section of the MQL5 marketplace. The indicator was first uploaded on the 15th of August 2017 by its creator Emir Revolledo, there have been a number of updates since its release, the most recent update was on the 13th of April 2018, which brought the indicator up to version 1.9.

Overview

The True Currency Meter is an indicator designed to be used with the MetaTrader 4 trading platform, it does not appear to be available for any other platforms. This indicator claims to be different from any other currency strength indicator as it looks at the currencies’ true strength.

The majority of strength indicators out there will look at the currency strength based on its pip movements, however, the True Currency Strength Indicator Meter understands that different currency pairs have different value pips, so it uses additional calculations to work out the strength based on the movements, but also the pip values, so a movement of 100 pips on a high-value pip pair will be stronger than a 100 pip movement on a lower value pip pair.

There is also an addition of both SMS and Email alerts available with this indicator. The indicator comes with a whole host of parameters that can be altered to change the way the indicator functions, this allows you to adapt it to more suit your own trading style and requirements. Some of these parameters include the time frame, the color of the currencies, fonts, sounds for alerts, whether to use email or SMS alerts, alert intervals, alert levels, and many more.

Service Cost

The True Currency Strength Meter will cost you $35 to purchase, this will give you full access and unlimited usage of the indicator. If you do not wish to buy it, you are also able to rent it, there is a monthly rental of $19 that you will need to pay for each month that you wish to use the indicator. There is a free demo version available, this will have some limitations but they are not stated on the page, we believe that the free version of the indicator may only be able to be used on a demo account and not a live trading account.

Conclusion

There are 25 reviews at the time of our writing, these reviews have given the indicator an overall rating of 4 out of 5 stars. 

Great product and great seller. Seller will go out of his way to reply. Support is 1st class, A++++++++++” – A 5-star review.

Indicator is very good but the Author doesn’t answer me on message. I asked several times to make one alert push alert system not only interval alert… but he doesn’t want to make it… I have been asked him for a long time ago! Pretty bad support.” – A 1-star review.

Very good signal and easy to use. Just put a little logic to it and can be used on a wide range. Can be used either as a fast signal for scalping or can do for long signals for day trading. User-friendly indicator. Very good support too. And usually replies in less than an hour. (I actually wonder why it got a bad review. lol) Overall, it’s a good job!” – A 5-star review.

So there is a mix of ratings, however, even the lower score ones are stating that the indicator works, it’s more the support from the creator that is lacking. There are 151 comments for the indicator, the creator does seem to be replying to them quite quickly which is, of course, a positive sign and goes against what the 1-star review mentioned. Even with so many positive reviews, we would highly recommend that you download and try out the free version, at least then you can make sure that it works for you and that it provides you with what you need prior to making a purchase or rental.

Categories
Forex Service Review

Ultimate Double Top Bottom Reversal Scanner Review

The Ultimate Double Top Bottom Reversal Scanner is an indicator that can be found within the indicators section of the MQL5 marketplace. The indicator was uploaded to the MQL5 marketplace on the 13th of February 2018 by FXsolutions, it was most recently updated on the 6th of October 2019 and is currently at version 1.11.

Overview

The Ultimate Double Top Bottom Reversal Scanner is an indicator, it can be used with the MetaTrader 4 trading platform and has been designed to scan up to 30 trading instruments over 8 different timeframes for the probabilities of reversal patterns.

The indicator only needs to be placed on one chart and it will function over the 30 different currencies, the indicator will send you alerts that you can customize whenever a signal is created. The indicator will use the Double Top/Bottom formation to create its signals.

There are a number of parameters that you can change, these will slightly alter the functions and display of the indicator. Some of the settings include alerts for various things such as for long or short signals, how the alert will be given (MT4, email or push), which timeframe to use, the template name, how often to check, and a few other options are also included.

Service Cost

The Ultimate Double Top Bottom Reversal Scanner can be purchased outright for $199, this will give you unlimited and unrestricted access to the indicator. There is also an option to rent the indicator, you can do this on a monthly basis which will cost you $49 per month, you are also able to rent it for a three month period that will cost you $89 for that timeframe.

There is a free demo version available, this will come with some limitations, unfortunately, the site does not indicate what the limitations are, we just know there will be some. It is always worth downloading and trying out the free version of the indicator or expert advisor.

Conclusion

At the time of writing, there were 8 user reviews, they have given the indicator an overall rating of 5 out of 5.

The scanner is very accurate and it is better to couple it with the Ultimate Top and Bottom Indicator.But where the scanner is incredible is that you can have until 30 custom pairs to be scan, on 8 timeframes !! No lag and easy to configure. Good good.“ – A 5-star review.

No repaint. And when used properly, this Double Top/Bottom Scanner proves itself to be a very effective and most helpful tool! Takes away the need to be glued to the monitor, flipping charts around different pairs and time frames hunting and waiting for Double Top/Bottom signals to appear. Great job!” – A 5-star review.

Points out exactly what it says it will. Masterfully done. Don’t think twice, the effort put in shows.” – A 5-star review.

The reviews are all very positive which is a great sign, there are also over 50 comments, the developer of the indicator is replying to the majority of them in a friendly manner and within a short period of time, this is a great sign as to the sort of customer support that you will receive should you purchase it. Even with all of these positives, we would suggest that you download and try out the free version, this will allow you to test it out and make sure that it functions the way that it is meant to and that you are able to get it set up and working before you make a purchase or rental.

Categories
Forex Service Review

Wolfe Waves Builder Indicator Review

Wolfe Waves Builder is currently located within the indicators section of the MQL5 marketplace. It was created by Mihail Moroz and was first uploaded on the 10th of April 2015. It has had a number of updates, the most recent update was completed on the 18th of February 2020 and is currently at version 3.2.

Overview

Wolfe Waves Builder is an indicator that can be used with the MetaTrader 4 trading platform, it will automatically plot Wolfe Waves onto the charts which will help to show trend reversals.

Some of the main features of the indicator:

  • It shows trend reversals, as well as the overbought and oversold zones on wave 5.
  • Automatically plots models and finds the Wolfe waves.
  • Price movement forecast.
  • Arrow and alert on wave 5 for novices, which prevents missing entries.
  • Efficient trading strategy.
  • Easy to use.
  • ZigZag is not used.
  • No redraws, no lags.
  • At the moment, this is the most perfect indicator of that sort.

There are also a bunch of settings and parameters available to alter, these include things like forex cleanup, enabling alerts, high and low periods, the draw channels, maximum bars to count, pivot points, and more.

Service Cost

Wolfe Waves Builder can be purchased with a single payment of $30, this will get you 5 software activations and no other limitations, If you would prefer to rent the indicator, this can be done on a monthly basis for $10 per month, or there is a three month period which will cost you $20 for the three months.

There is a free demo version available, the MQL5 site does not indicate what the free version offers, this normally means that it is only usable with the strategy tester but we cannot say that for sure.

Conclusion

The Wolfe Waves Builder currently has five reviews, these reviews have given the indicator an overall rating of 4.5 out of 5.

“An email alert on the formation of the 3rd point on the wave would make it a five-star product” – A 4-star review.

“This is a good indicator, does the job well.” – A 5-star review.

“This tool is undervalued!! must have” – A 5-star review.

The reviews are all very positive, which shows that the indicator is functioning the way it is meant to. There are also a number of comments, the developer has been putting their own information as well as replying to comments from people who have purchased or rented the indicator which is a great sign as to the kind of support you would receive should you decide to purchase or rent the indicator.

Categories
Forex Service Review

Trend Prediction i-Regression Channel Indicator Review

Trend Prediction is an indicator created in September 2015 by developer Hoang Ngoc Thach. The indicator is based on the detection of linear regression channels, which are a well-known chartist figure and often used by beginner traders.

The linear regression channel consists of two parallel lines located at the same distance from the linear regression trend line. The distance between the channel edges and the regression line is equal to the value of the highest deviation from the nearby regression line price.

  • grade – degree of regression, changes from 1 to 61;
  • kstd – regression channel width;
  • bars – here are detailed the number of bars for the calculation of the channel;
  • shift – the horizontal change of channel into bars.

Trend Prediction uses the Quinn Fernandez algorithm to find harmonic frequencies. It adjusts to the harmonics of the trigonometric series one by one until the specified total number of harmonics H is reached. After installing a new harmonic, the coded algorithm calculates the residue between the updated model and the actual values and adjusts a new harmonic to the residue.

The indicator has the following input parameters:

  • Npast – number of bars passed, to which the trigonometric series is adjusted;
  • Nfut – number of planned future bars;
  • Nharm – total number of harmonics in the model;
  • Freq tol – tolerance of frequency calculations.

The indicator shows two curves: the blue curve indicates modeled past values and the red curve indicates modeled future values.

It has an alert configuration function: Send an email, send a notification to Metatrader 4 mobile terminal, Pop-up alert when the price touches the top or bottom line, and you can perform a trade.

  • Send mail mode: Send email.
  • Send notification mode: Send Notification.
  • Alert mode: Emerging alert.

In summary, we are talking about a straightforward trend indicator based on the trend channels and the calculation by the indicator of the breaks of that channel to know the opportunities to make a good trade. As always, we recommend the use of several indicators so that the signals of several of them give us a much more secure input signal.

We consider that Trend Prediction is a suitable indicator for beginner traders, due to its simplicity of use and its easy understanding. In addition, the comments we have found, made by real users of this indicator, are quite positive, so we think it is a useful and reliable indicator.

There is a free demo version to familiarize yourself with this indicator, but if you want to buy it, you can do it in the MQL Market Indicators section at a price of 59 USD.

Categories
Forex Service Review

PZ Lopez Trend Indicator Review

PZ Lopez Trend is an indicator that was created in December 2013 by developer Arturo López Pérez. Arturo López Pérez is a private investor and speculator, software engineer, and founder of Point Zero Trading Solutions. This creator has developed for the MQL market several trading tools, both paid and free.

This indicator follows the market trend fairly reliably, ignoring sudden fluctuations and market noise. It has been designed to trade trends in smaller intraday strategies and time frames (M1, M5, M15, and M30). His profit ratio is about 85%.

Main Features of the PZ Lopez Trend Indicator
  • It’s an incredibly easy tool to negotiate.
  • Its basic principle is to find situations of oversold or oversold.
  • It is prepared for noise-free trade at all times.
  • Avoid being whipped in intraday letters.
  • The indicator analyses its own quality and performance.
  • Implements a dashboard of several times.

The indicator is suitable for low-term trading, as it ignores sudden price increases or corrections by reducing market noise around an average price. The indicator does not need any optimization, as it is already optimized after multiple upgrades. It implements a multi-time dashboard. Implement email alerts – sound – push. The indicator is no painting and no repainting.

This indicator implements a trend tracking orientation suitable for small time frames that can penetrate very long trends in higher time frames, amplifying their gains.

Anatomy of PZ Lopez Trend indicator

This indicator shows a color line surrounded by a price band. The color line is the average price of security, and the price band represents the levels of oversold and oversold. If the average price is blue you should be looking for long trades (buyers) when the market is not overbought, and if the average price is red, you should be looking for short trades (sellers) when the market is not oversold.

A change in trend in the indicator is not a signal to negotiate or close opposing transactions immediately. The bands are used for this, for synchronization.

Technical Information:

  • The indicator evaluates each bar, not each tick.
  • The indicator has only one dropdown parameter with four possible values.
  • Implement visual, audio, email, and push alerts.
Conclusion

In short, we are talking about an EA that works by looking for trends, but with filters to avoid market noise and sudden price fluctuations. It works on all time frames, although its behavior is better in intraday operating time frames.

We have detected that the robot does not have good ratings from the users, so we cannot recommend this EA, due to this and the lack of a little more detailed information about the robot.

This robot is for sale on the MQL market at a price of 149 USD. You can also rent 1 month for 49 USD and 3 months for 99 USD. It is advisable to download the demo version available for free in order to know the behavior of this EA better and to be able to make a purchase decision or not.

Categories
Forex Service Review

Pin Bar Indicator (Free Version) Review

Pin Bar Indicator Free is a free indicator created in March 2019 by developer Luca Pulito. The MT4 Pin Bar Indicator Free identifies Pin Bars, and will even give you sound or email alerts if you want them. The pin bars are based purely on the price action reflected by the candle formations created by the Forex price movements.

The main parameters of the Pin Bar Indicator are:

  • The maximum permitted body/length ratio for nose bar.
  • The body of the nose should be the position on the top of the nose bar.
  • Left eye bar should be bearish for the bullish Pinbar, bullish for the bassist Pinbar.
  • Nose bar should be in the same direction as the pattern itself.
  • It indicates that the body of the nose must be inside the body of the left eye.
  • The minimum size of the body of the left eye in relation to the length of the bar.
  • Minimal protrusion of the nose bar relative to the length of the bar.
  • Maximum size of the body of the nose in relation to the body of the left eye.
  • The minimum length of the nose relative to the length of the left eye.
  • Minimum depth of the left eye relative to its length. Depth is the length of the part of the bar behind the nose.

How to use the Pin Bar Indicator

The best way to use the pin bar pattern as an indicator of early investment in conjunction with support/resistance or relative maximum or minimum. The pin bar should be used to identify a strong supply/demand zone. It is best to use the pin bar in M15 or higher time frames (M30, H1, or H4). Avoid trading on any pin bar if not in conjunction with support/ resistance.

The stop loss is placed 10 to 15 pips above the pin bar. To take advantage of a final stop can be used as this type of pattern can identify long movements. Transfer pairs like EUR/USD or USD/JPY are generally a good choice for the pin bar pattern.

In short, we are talking about a very simple and easy to understand indicator, which can be suitable for all types of traders, even beginners. This would be a tool to be combined with other indicators and thus try to have better-filtered inputs and outputs.

Despite being a free tool, we can see that its users, in general, convey very positive opinions of this indicator, and even the developer himself is very active in the comments giving advice and answering all the doubts and questions that any user asks him. As a free indicator, it can be downloaded and tested directly.

Categories
Forex Service Review

PZ Fractal Channel MT4 Indicator Review

PZ Fractal Channel MT4 is an indicator created in August 2019 by developer Arturo López Pérez. Arturo López Pérez is a private investor and speculator with years of experience in the markets, software engineer, and founder of Point Zero Trading Solutions. It is a very active creator of products for the MQL community and has several free and paid tools.

PZ Fractal Channel MT4 is a very simple but very effective indicator for trading breakdowns of variable fractal periods. A fractal is a price formation within an odd number of bars, finding in the middle bar the higher or lower price pivot of the formation. These prices are as short-term support as well as resistance levels, which PZ Fractal Channel uses to form a pricing channel and teach the shoots.

Some features of this indicator are:

  • Easy to use and easy to understand.
  • Fractal shoots can start long tendencies.
  • The fractal channel is a great stopping method.
  • It’s no painting and no repainting.
  • Implements alerts of all types, email, Smartphone, and PC.
  • Customizable colors and sizes.

The developer says that if we consider higher periods, this will lead to more reliable outbreaks, although these types of signals will appear less frequently. This indicator must be confirmed by a higher time-frame analysis. In general, you will want to increase the fractal period for shorter periods and reduce it for longer periods.

PZ Fractal Channel MT4 input parameters:

-Period: Number of bars from which fractals are calculated. It must always be an odd number.

-Shoots: Activate or deactivate the shoots.

-Colors: Customize arrow colors and size.

-Alerts: Enable or disable alerts of all types.

In short, we are talking about an indicator that takes into account the price movements in a given time-space in which fractals are calculated. Less experienced traders may not be familiar with fractals, so we advise you to study their performance beforehand so you can understand how this indicator works.

There are no previous comments or experiences with this indicator, there are no users who have advised or counted their experience with it. In any case, we are certainly talking about an ancillary indicator to others that we already have, because in itself it is not a reliable trading system. We always recommend using 3 or more indicators to calculate market inputs or outputs better.

PZ Fractal Channel MT4 is for sale on the MQL market at a price of 30 USD, not being available the rent, but the free demo version that will serve us to know the indicator, it’s functioning better, and assess if it brings us anything to our trading style.

Categories
Forex Service Review

YFX Wing Patterns Indicator Review

The Wing Patterns indicator will look for many different pattern types using a structure called XABCD. When we speak of “Wing Pattern” we use this term to refer to all kinds of patterns based on a general XABCD structure, which is drawn in an extreme high-low alternative form.

In other words, let’s assume that point X starts at a low point in the table. Point A is drawn at the next highest score within a certain number of bars. This specific number of bars is called the depth level. Point B would be drawn at the next lowest point for a particular depth. Following the flow, point C is the next high, and point D is the next low. If we connect these points in a graph, it usually looks like the wings of a butterfly, that’s why we call it “Wing Pattern”.

The harmonious wing pattern strategy will teach you how to negotiate such a pattern and start making money with an exciting new approach to technical analysis. The market strategy of the wing pattern is part of the harmonic pattern trading system. You need to read introductory articles on harmonic patterns as this will give you a better understanding of how to negotiate the wing pattern.

The wing pattern is similar to the Cypher harmonic pattern but follows different Fibonacci relationships. One of the most accurate ways to differentiate a wing structure from a cypher pattern is the B point, which, if it does not go beyond 50% Fibonacci leg XA recoil, then is a wing. Otherwise, it can become a Cypher structure, which is a different indicator.

The market strategy of the wing pattern is suitable for all time frames and for all markets, but we have to take into account that in the lower time frames if we use the wing pattern strategy, we will see how the market comes with its own challenges because the wing pattern has the tendency to appear less frequently in the lower time frames.

Before we dive deeper into the harmonic wing pattern strategy, let’s see what indicators we need to negotiate this strategy successfully. The setback and relations of Fibonacci are at the center of harmonious trade. Thanks to the rapid progress in the field of technical analysis we can find some very useful indicators to really help us plot the harmonic patterns and these Fibonacci ratios.

You can find the harmonic wing pattern indicator in the most popular Forex trading platforms, such as Tradingview and MT4 in the indicators section. Its price is 30 USD, although you can get a free trial version, or if you don’t want to buy it, you can rent it for 3 months at a price of only 10 USD. We recommend this indicator to advanced traders as strategies with harmonic patterns are not easy to understand for a beginner, who should read about this topic to understand it well.

Categories
Forex Services Reviews-2

TIPU Parabolic SAR Dashboard Indicator Review

The Tipu Parabolic SAR Dashboard was published in June 2016 by the creator Kaleem Haider. Haider has a number of Tipu Indicators available for purchasing and his main aim is to make trading easier for traders around the world. Currently, Haider is offering version 2.10 of this indicator, with the latest update being made a couple of years ago in October 2018. Take a look at this review as we highlight the main features of this indicator and how it can be used during your trading.

Overview

The Tipu Parabolic Dashboard is a multi-timeframe, multi-currency indicator that can help traders to analyze markets in a quick and efficient manner. The SAR (Stop and Reverse) is a method developed J. Welles Wilder that is a trend-following indicator that is used mostly for trailing stop (a type of stop-loss order that moves relative to price fluctuations).

Using the Tipu Parabolic SAR Dashboard, users can swiftly change the periods and symbols through this dashboard, so this indicator is ideal for those traders that tend to miss out on great trade opportunities whilst going through browsing charts manually. Another cool feature of this indicator is that it adds alert features on email, on-screen, and even on mobile so you’ll always be informed on time.

The two main features of this indicator are; a number of customizable alerts including buy/sell alerts, push alerts, email alerts, or visual on-screen alerts and a very customizable panel that can be moved on any place on the chart or minimized to de-clutter your screen.

Service Cost

The Tipu Parabolic SAR Dashboard can be purchased for $30 or it can be rented for $10 yearly. For those traders that would like to test it out before spending money on it can do so by downloading the Free Demo.

Conclusion

This indicator seems to be quite well received by users however some did encounter issues with the indicator resetting the currencies chosen by them back to default, and unfortunately, this seems to be an ongoing issue.

If missing out on trades is something that you experience often, download the free demo available and check if this indicator and its alerts can help you in making the right decisions at the right moment.

This Forex Indicator is currently available in the MQL5 marketplace: https://www.mql5.com/en/market/product/16139