Categories
Forex Basic Strategies

Most Profitable Ways To Trade The Triple Top Chart Pattern

Introduction

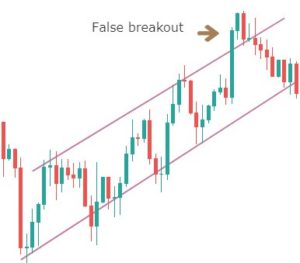
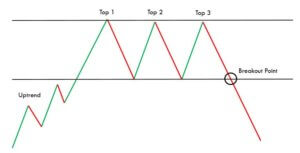
The Triple Top is a bearish reversal pattern that helps traders in identifying the peak areas of the market. This pattern occurs when the market prints three consecutive tops nearly at the same price level of any underlying asset. The areas of the touchpoints are the resistance levels, and the pullback between these points is known as the swing lows. After the third high or third touchpoint, if the price breaks the support and goes below, the pattern is said to be complete.

Traders can then activate their positions on the sell-side. Most of the traders try to be extra conservative and wait for the exact pattern to occur. But it can be challenging to find the Triple Top Reversal pattern with all the three highs at the same in size. We should always remember that the technical analysis is more of art and less of science. So even if 80% of the pattern rules are met, we can take the trades by confirming those signals with other credible technical indicators.

The Psychology behind the Triple Top Pattern

The appearance of a Triple Top Pattern implies that the buyers are slowly losing momentum in the market. It might also mean that the buyers are not willing to push the price higher. At the same time, the sellers are interested in taking the price lower. The Triple Top pattern is a way more powerful pattern than most of the other credible patterns in the market. This is because the third failed attempt of the buyers implies that the sellers are way too aggressive than the buyers. Hence we can expect stronger downward moves.

Triple Top Pattern – Trading strategy

The Triple Top pattern occurs very rarely on the higher timeframe. Even if it occurs, this pattern often takes a lot of time to develop fully. However, on an intraday timeframe, this pattern can be observed quite often.
Step 1: Identifying the TTP on a price chart

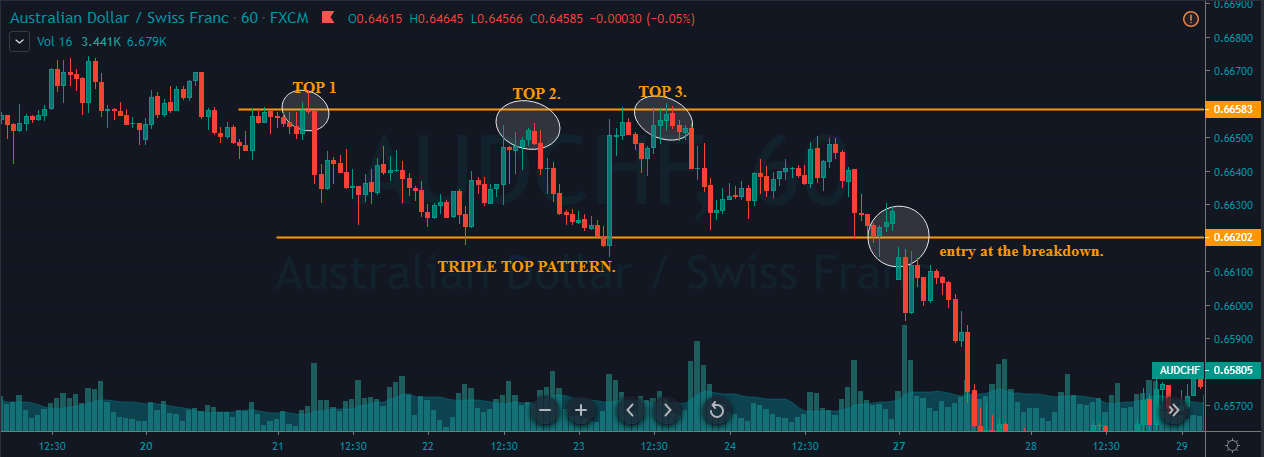
In the below AUDCHF Forex chart, we can see the market printing a clear Triple Top chart pattern.

Step 2: Entry 

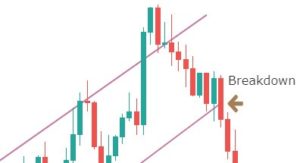
The strategy is to wait for the breakdown to happen so that we can activate our short positions. On the 27th of January, we can observe the breakdown that occurred in this pair, and that can be considered as a clear Sell Signal.

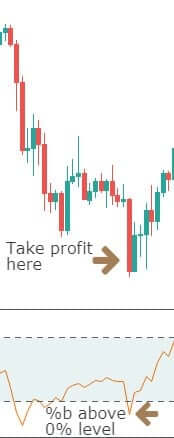
Step 3: Stop-loss & Take Profit

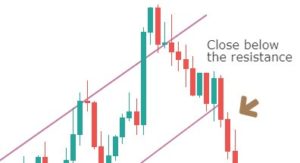
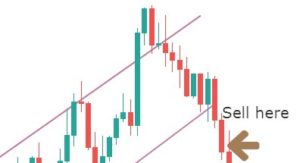
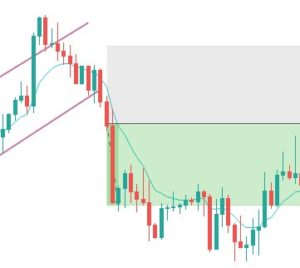
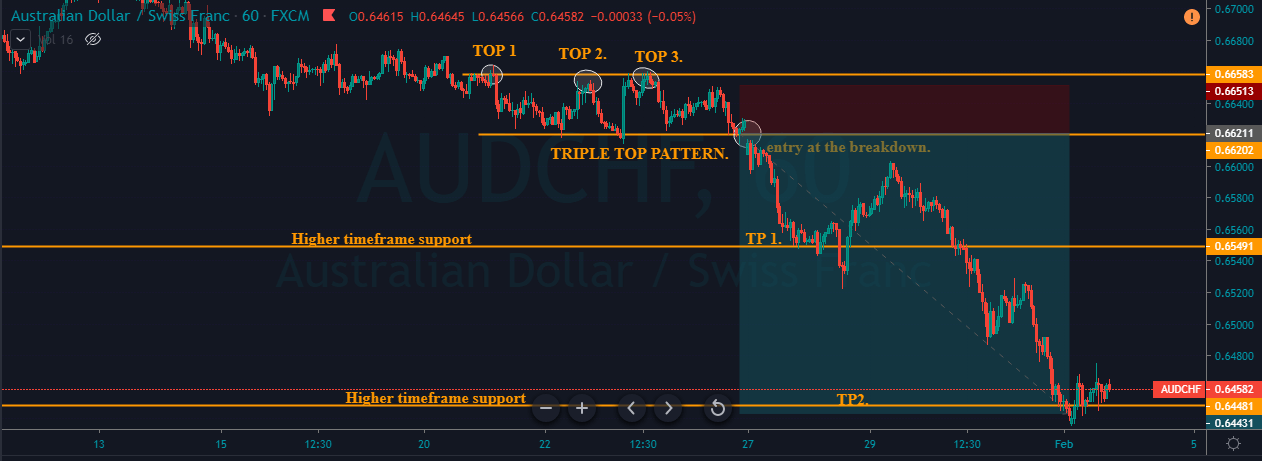
We can activate our sell positions as soon as we see a bearish confirmation candle. We can go for two different targets in this trade. Both are at the higher timeframe’s support area. Most of the traders believe that their target must be double as compared to the size of the Triple Top pattern, but it’s just a myth. Always book the profit according to the market circumstances.

If the trend is super strong, go for the deeper targets. Contrarily, if the market momentum is fading, book the profit at any significant area. Traders who are well versed with pattern trading can add positions when the market goes back to the entry point so that they can ride the whole show again. While trading the breakout or break down patterns, always place the stop-loss near the recent low.

Triple Top Pattern + Double Moving Average

In this strategy, we have paired the Triple Top pattern with the Double Moving Average to identify accurate sell signals. A moving average will help us in identifying significant trends, trading opportunities, and entry/exit levels. Many traders believe that if they find the magic number of the period, then they can easily beat the market, but it’s not true. There are infinite numbers of periods available, and traders should practice only 3 to 4 periods, to use this indicator effectively.

Step 1: Identifying the TTP on a price chart

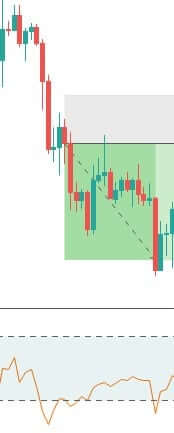
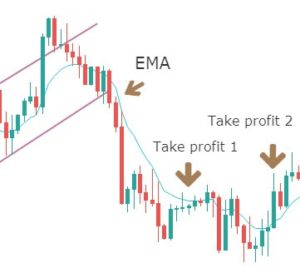
In the below chart, we can observe the market printing the Triple Top pattern on the NZD/JPY 60-minute Forex pair. We have applied the double MAs on to the price chart.

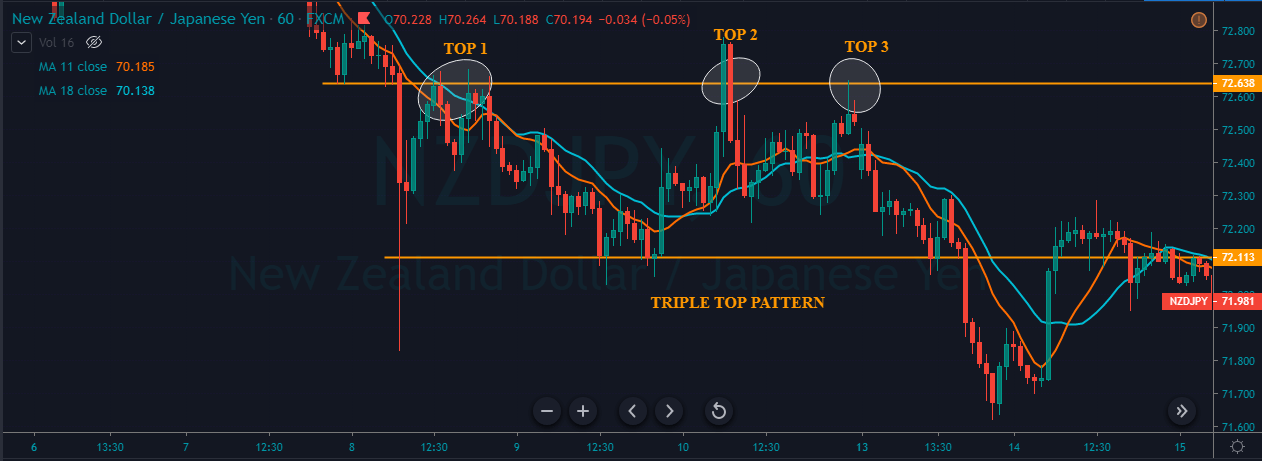
The traditional way to trade this pattern is to wait for the break down to happen and then go for sell just like we did in the above example. But in this strategy, let’s tweak things a bit by adding the double moving average to the plot. In this strategy, we are using the 14 and 9-period average. This strategy is purely for the intraday traders only.

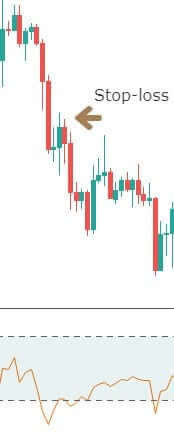
Step 2: Entry, Stop-loss & Take Profit

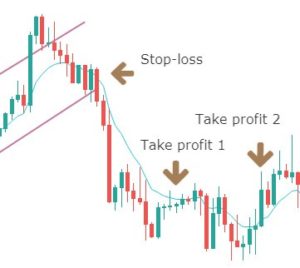
After price action printing the third top, if we observe an MA crossover happening, we can activate our sell positions even before the breakdown. By following this approach, we get to enter the trade ahead of time, while the breakdown traders wait for the break down to activate their position. Most of the professional traders use this approach to maximize their profits.

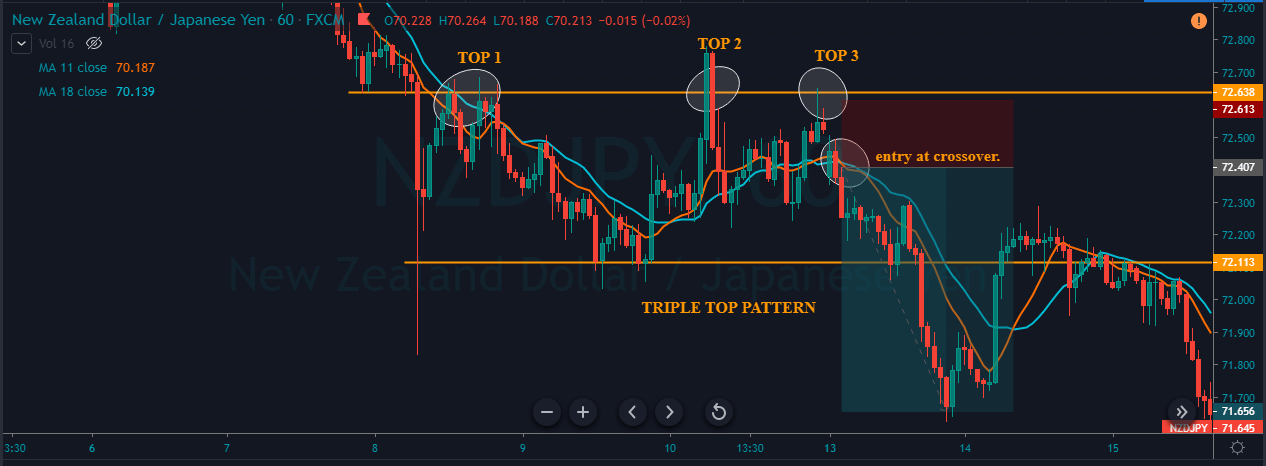
There are many ways to close our positions. We can book profit at a significant support area. The placement of stop-loss depends on the trader’s trading style. If you are an aggressive trader, the smaller stop-loss is good. But expect more hits before the trade performs. If you are a conservative trader, use an extra spacious stop-loss.

Bottom line

A pattern is said to be paramount when it offers the best risk-reward ratio trades. Also, the pattern must have a higher probability of occurring in intraday timeframes. The Triple Top is one such pattern that offers both of these demands to every trader. Also, remember that the Triple Top is a bearish reversal pattern, so only take short positions when you see this pattern on the price charts. Apart from the ones mentioned above, there are different other ways to activate our position in the appearance of this pattern. But the above ones are the safest and most profitable ways to trade.

Try identifying and trading this pattern on a demo account before trading on the live charts. We hope you find this article informative. If you have any questions, please let us know in the comments below. Happy Trading.

Categories
Forex Basic Strategies

How To Trade The ‘Three Black Crows’ Pattern Like A Professional Forex Trader

Introduction

Three Black Crows is a bearish candlestick pattern that consists of three consecutive red candles. This is a visual pattern and can be identified easily on the price action charts. The Three Black Crows pattern essentially indicates a shift in control from bulls to bears. In the book known as ‘Candlestick Trading Technique,’ Steve Nison says that this pattern is one of the most useful ones for longer-term trades.

In an uptrend, this pattern consists of three consecutive bear candles that have large bodies of roughly the same size. The Three Crows pattern confirms the strength of the sellers.

Each candle should be open and close lower than the previous candle.

Each candle should mark a successive decline in price action and should not have long shadows or wicks. Using this trading pattern in conjunction with other technical indicators will enhance the probability of winning the trade.

Trading Strategies With Three Black Crows Pattern

TBC Pattern + Bollinger Bands

In this strategy, we have paired the Three Black Crows pattern with the Bollinger Bands to identify accurate trading signals. The Bollinger Bands indicator is developed by the technical trader John Bollinger. It consists of a centerline and two bands above and below the price chart. The bands of the indicator contract and expand according to the different market conditions. In a volatile market, the bands of the indicator expand and in a dying market condition the bands’ contract.

Step 1 – First of all, find the Three Black Crows Pattern in an uptrend.

Step 2 – Take a sell-entry when the Three Black Crows pattern hit the upper band of the Bollinger Bands Indicator.

In the above chart of the NZD/USD forex chart, we can see that the pair was in an overall uptrend. Around the 4th of November, price action prints Three Black Crows, which is an initial clue to go short. Furthermore, price action also respects the Bollinger upper band, which is a sign to go short on this pair.

Step 3 – Stop-loss & Take Profit

Placing accurate Stop loss is one of the most critical aspects of successful trading. Some of the novice traders never use stop loss, and it is the biggest mistake they do. We always suggest the traders use the stop-loss order in every trade they take. If you have the fear that your trade might hit the stop loss, then use a deeper stop loss and expect only 1R trades. If you are an aggressive trader, then stop loss above the Bollinger bands is the safest idea.

The basic idea most of the traders have is to exit their positions when price action hits the lower band of the Bollinger band indicator. If you follow this strategy, there will be fewer chances of you making money. Because price action moves in cycles, and prices often hit the upper and lower bands. We suggest you always use the higher timeframe major support area for booking your profits. You can also close your position when the market prints the Three White Soldiers pattern, which is quite the opposite of the Three Black Crows pattern.

In the above example, we have closed our full position when the market reached a previous major support area. Most of the time, price action always reacts from a significant support area. In our case, when we closed our position (yellow dotted line), price action immediately changed its direction.

TBC Pattern + MACD Indicator

In this strategy, let’s learn how to trade the Three Black Crows pattern by combining it with the MACD indicator to identify reliable trading signals. MACD is a trend following indicator, and it stands for Moving Average Convergence and Divergence. This indicator consists of a histogram, moving averages, and a centerline. Traders use the MACD moving average crossovers to identify the trading signals. When the moving averages of the indicator go above the zero-line, it indicates a buy signal. Likewise, when it goes below the zero-line, it indicates the sell signal.

Step 1 – First of all, find the Three Black Crows Pattern in an uptrend.

Step 2 – The strategy is this – when market prints the Three Black Crows pattern, see if there is a crossover happening on the MACD indicator at the overbought area. If there is a crossover, it is a clear sign to go short in any underlying currency pair and vice-versa to go long.

In the image below, GBP/CAD was in an overall uptrend. When price action prints the Three Black Crows pattern, it indicates the ongoing trend reversal in the near future. Furthermore, when crossover happened on MACD, it’s a clear signal that the GBP/CAD is ready to start a downtrend afresh. After our entry, price held for a bit at the support area and dropped to print a brand new lower low.

Step 3 – Stop-loss & Take Profit

Put the stop loss above the first candle of the Three Black Crows pattern and close your whole position when price action reached a significant support area.

As you can see in the image below, we closed our full position at the major support area. Overall it was not a smooth ride, but our position didn’t go into loss even for a single time. Traders can also close their positions according to market situations, or according to their trading style.

Bottom Line

Three Black Crows pattern is one of the most famous and popular trading patterns out there. This pattern can be used to identify the trend reversals in an upward market. Whenever you find a Three Black Crows pattern on the price chart, we suggest you sit up straight and understand if this pattern has the potential to reverse the market or not. It is always advisable to pair this pattern with other trading tools to confirm the indication. Traders can also use this pattern to enter or exit a trade. Some traders use this pattern with the combination of other trading tools in order to close their full position. The end goal is to use this pattern to identify trading opportunities and trend reversals more accurately. Cheers!

Categories
Forex Basic Strategies Forex Trading Strategies

Trading The Morning Star Candlestick Pattern Like A Pro!

Introduction

Morning star is a bottom reversal pattern, and it primarily consists of three candlesticks that indicate the bullish sign. This pattern warns the weakness in an ongoing downtrend that, in turn, suggests the start of an uptrend. Traders observe the formation of a Morning Star pattern on the price chart, and then they can confirm it with other technical tools.

The Three Candlesticks Of Morning Star Pattern

  • Large Bearish Candle
  • Small Bullish or Bearish Candle
  • Large Bullish Candle

The most fundamental thing to remember is that the market should be in a downtrend to trade the Morning Star pattern. To confirm the downtrend, mark the lower lows and lower highs.

Large Bearish Candle is the first part of the Morning star reversal pattern. The bearish candle indicates the bears are in complete control, which means the continuation of the selling pressure. At this point in the market, we should only be looking for the sell trades as there is no sign of reversal yet.

Small Bullish/Bearish Candle is the second candle that begins with a bearish gap down. This candle indicates that the sellers fail to push the price lower, despite trying really hard. The price action ends up forming a quite small bullish/bearish or Doji candle. If this candle is a small bullish candle, it’s an early sign of trend reversal.

Large Bullish Candle is the third candle that holds the most significance because the real buying pressure is revealed in this candle. If this candle begins with a buying gap, and if buyers can push the prices higher by closing the candle even above the first red candle, it is a definite indication of a trend reversal.

Trading strategy – Morning Star Candlestick Pattern

As we know by now, the Morning star is a reversal pattern. It mainly indicates the bulls taking over the trend while the bears lose the grip. Most of the beginners tend to trade the Morning Star pattern stand-alone. But we do not recommend this as it is not reliable enough. Always pair this pattern with some other credible indicators, support resistance levels, or trend lines to make profitable trades.

Morning Star Pattern + Volume

In this strategy, we have paired the Morning Star pattern with the volume. The volume plays a significant role in pattern formations. If the first red candle shows a low volume, it is a good sign for us. Then, if the second candle is green and the volume rises, it indicates the buying pressure. Lastly, the long green candle’s volume must be high. The high volume on the last candle shows the confirmation of the upcoming buy trend. If the third bullish candle has low volume, then try avoiding that Morning Star Pattern because the volume is not indicating the bullish reversal. If you observe the third candle closing with high volume, take up the buying position and ride the uptrend until there are any indications of a trend reversal.

Confirm the downtrend on the trading timeframe

Confirmation is very important because, if there is no downtrend, there’s no point in trading the Morning Star pattern. You can confirm the downtrend on a higher timeframe or on your trading timeframe. As you can see in the below image, the overall trend of the CAD/CHF Forex pair was down.

Find out the Morning star pattern on your trading timeframe

As you can see in the below CAD/CHF chart, the market prints the Morning Star pattern by following all the rules of our strategy. The first red candle was with low volume, and the second one was a small red candle. Hence there is no indication to go long in this pair yet. The very next was a long green candle with high volume. This is a strong indication of a trend reversal.

Entry, Take Profit and Stop Loss

We should be entering the trade when the next green candle closes. There are so many different ways to book profit. We can close the position at any resistance area or supply-demand zone. In this trade, we hold our positions because we took the trade from the beginning of a new trend. You can also close your positions when the price goes near the higher timeframe’s significant resistance level.

Pairing this pattern with volume makes it more reliable to trade. So it is a good idea to place the stop loss just below the second candle. In the above picture, you can see that we have put the stop loss just below the second candle, and we have also booked the profit at the higher timeframe’s major resistance area.

Reliability of Morning Star Pattern

This pattern is very easy to identify on the price chart if you are an intermediate trader. Even novice traders can easily spot it on the chart with little practice. Morning Star pattern often gives us well-defined entries and good risk-reward ratios. The only limitation of this pattern is that, if the sellers are strong enough, the prices could go further down despite the formation of the Morning Star Pattern. Hence it is always recommended to combine this pattern with some other trading tools rather than trading it stand-alone.

We hope you find this article informative. Try trading this pattern when you see a perfect downtrend next time. Let us know how the results have been in the comments below. Cheers!

Categories
Forex Basic Strategies

Trading With The Bollinger Band %B Indicator

Introduction

If you have experience trading with the Bollinger Bands indicator, you will find it easy to trade with the Bollinger Band %B indicator. The only difference is that, in this indicator, you can identify the relationship between the price and the bands with at most clarity.

What is the Bollinger Band %B indicator?

It is basically a technical indicator that quantifies the price of an asset with respect to the upper and lower limits of Bollinger Bands. We have derived 6 relations between the price and the indicator.

  • The %B is at zero when the currency pair is at the lower band.
  • % B will be at 100 when the currency pair is at the upper band.
  • The indicator is above 100 when the price of the currency pair above the upper band.
  • It is below zero when the price goes below the lower band.
  • The %B is above 50 when the price goes above the middle band.
  • And it is below 50 when the price goes below the middle band.

The Bollinger band %B uses the 20-day simple moving average (SMA) as the default parameter, just like the Bollinger Bands. This indicator is available on most of the trading platforms and terminals.

Bollinger Band %B formula

%B = (Price – Lower Band) / (Upper Band – Lower band)

Things to know

Before understanding the strategy, it is necessary to know a few things about the indicator as these concepts will be used in every step of the strategy. Below is the chart of a forex pair with the Bollinger Band %B indicator plotted to it.

  • The upper dashed line represents the 100% level of the %B indicator also known as the upper band.
  • The lower dashed line represents the 0% level also known as the lower band of the indicator.
  • The area in between the two dashed lines is known as the middle band.

These bands help us in identifying different trading opportunities. Hence, one needs to know about it before knowing the strategy.

The Strategy

Step 1: Identify the major trend

To identify the overall trend of the market, the trader needs to shrink the chart and determine the trend.

An uptrend is defined as a series of higher highs and higher lows, while a downtrend is defined as a series of lower lows and lower highs. In this strategy, we have taken the example of a downtrend, as shown in the figure. One can also see lower lows and lower highs in the above chart.

Let us see how the strategy works.

Step 2: Find the price where %B is above 100 or below 0 in the currency pair.

In this step, we are looking for the price where the indicator is above the upper band or below the lower band. This extreme price action is said to continue for long after taking a suitable entry.

A sell setup is formed when the indicator crosses below the lower band, and a buy setup is formed when the indicator crosses above the upper band. This strategy is almost reverse of other strategies (as oversold indicates buying in other strategies).

The above chart shows the crossing of the indicator below the lower band, which is apt for a sell trade. Just because the price is below the dashed line, we cannot take an entry immediately.

The next step is to find a pullback and then make an entry. We will then see how and where to take profits.

Step 3: Take an entry only at a suitable pullback.

By suitable pullback, we mean the opposite color candles should not be swift candles and should not make higher highs. If this happens, the current trend can be weak and may not sustain. The %B indicator can also assist us with the same, as the indicator should move slowly after crossing the lower band. If the indicator reacts and moves fast, it means the pullback is strong and could also result in a reversal. Finally, an entry can be taken after the close of at least two pullback candles.

The below figure explains the above paragraph clearly.

Step 4: Determining how to take profit

In this strategy, we follow a rule-based system for making profits which are again based on our indicator. A trader needs to cover his position after the indicator crosses the lower band once again and goes above the dashed line. This style of taking profit is different than in other strategies where it is based on a fixed percentage. This way of taking profits ensures that a trader is trading based on rules and guidelines which is a disciplined approach.

The below figure explains how profit is taken and the position is covered.

When the indicator goes above the 0% (lower band) level after crossing below, it means profit can be taken now and the trade can be closed.

Step 5: Place a protective stop

Stop-loss is a mandatory and essential part of risk management, hence it needs to determined before entering a trade. For this strategy, stop-loss is placed above the high of the pullback which makes it an optimal place. The stop-loss, in this case, is very small which increases the risk to reward ratio (RR) considerably.

Here is exactly where it is recommended to put the stop loss.

The final trade setup would look something like this 👇

This results in a minimum of 2:1 RRR.

Final words

This is one of the easiest strategies which can be learned by new and experienced traders. It makes use of simple Bollinger bands added with a %B indicator. This indicator can also be combined with several other technical indicators and trading systems, but this alone, too, has a very good level of accuracy.  Now, we have to follow the money management principles to take the best trades and make huge profits from the same strategy. For this, you can also refer to our money management article series, which talks on various risk management topics. Cheers!

Categories
Forex Basic Strategies

Trading Price Channels Like A Professional Forex Trader

Introduction

One of the most important characteristics of price in the Forex market is that it moves in the form of channels 20-25% of the time. So it is crucial to learn how to trade the market when it is in this state. The price channel strategy that we are going to discuss is intuitive and most straightforward. In this article, we will see how to implement this strategy and take profitable trades while reducing risk at the same time. Let’s get right into it.

What is the price channel pattern?

Before exploring the strategy, we need to know what a price channel means and the different types of channels. The price channel represents two trend lines drawn above (channel resistance) and below (channel support) the price. The price moves within these two trend lines.

The width of the channel should be big enough if you want to trade inside it. In this case, a simple trade would be to buy at channel support and sell at the channel resistance level.

However, the most significant opportunity is to trade the channel breakout.

We can distinguish the channel into two types:

  • Upward price channel
  • Downward price channel

An upward price channel occurs when price makes higher highs and higher lows. More the number of touches the price makes to channel’s support and resistance, stronger is the channel.

A downward price channel occurs when the price makes a series of lower lows and lower highs. The trend line should be able to connect to these points; only then we can call it a channel.

This represents the consolidation or ranging zone. Here the market bounces on and off between the two support and resistance lines.

If you understand the psychology and reason behind the formation of a price channel, it can save you a lot of losing trades. The reason why channel breakout is so significant is that many traders trade inside the channel. They place their stop loss above or below the price channel pattern.

As more and more traders start placing their stops, they will eventually be targeted by smart money. One needs to remember that a price channel won’t last forever. Breakout in any form is inevitable.

So, now, let’s see what the price channel strategy is and how to trade it effectively. This strategy is independent of technical indicators and does not make use of it (except for taking profits). Hence, there is no prior knowledge of technical indicators is required.

Price channel strategy

Recognize the early signs of a price channel breakout, as this will help you make better decisions. This strategy is based on such breakout signs, so knowing about them in advance is an advantage.

Here are the various steps involved in the strategy. We will be taking the example of a sell trade.

Step 1: Draw an upward channel

The upward channel should be constructed in such a way that it should connect at least two higher highs and higher lows. You can also make use of the price channel tool, which is provided by most trading platforms to connect the highs and lows.

Before the breakout, we need to make sure of an important rule, which brings us to the next step.

Step 2: For an upward channel, look for a false breakout above the channel resistance.  

In the case of an upward channel, the first warning would be the price failing at the resistance and giving a false indication that the price has broken above resistance.

Only this strategy makes use of this powerful price reading technique. It is in this unique style that we have developed this strategy. The failed attempt at the top is a sign of ‘stop-loss hunt’ by large players, which is confirmed when the price comes back to the channel support.

Note – The more times a ‘swing high‘ tries to get violated and fails, the stronger will be the breakdown.

Step 3: Wait for the breakdown and confirmation

A mistake that most traders do is that they don’t wait for a confirmation signal after the breakdown happens. For this strategy, the confirmation is to wait for the breakdown candle to close below the channel support. Before this, wait for the breakdown and then look for confirmation.

The closing of the candle should be like one in the below figure.

So, don’t just sell after the support is broken. Instead, see that the breakdown candle closes below the price channel. This is an effortless way to avoid false breakdown signals.

Note – If the breakdown candle is decisive, it’s good, but not mandatory.

Then what is the exact point of entry? This brings us to the fourth step of the strategy.

Step 4: Sell right at the closing candle

The entry technique of the strategy is quite simple. A sell order can be executed at the breakdown candle closing price.

Now you can be confident in taking the trade, as you have done everything right until now. The next logical thing to do is to determine where to take profits and place the protective stops.

Step 5: Take 50% profit at consolidation near EMA and rest 50% after price crosses above the EMA. The stop loss has to be placed above the channel support.           

We will be taking profits based on EMA plotted on our chart. Our first potential take profit zone is when the price starts to consolidate near the EMA and touches the line multiple times, as this means that the trend might be coming to an end.

The second potential take profit zone is when the price crosses above the EMA, signaling a reversal of the current trend.

Next, we need to establish our stop-loss.

The stop-loss is placed right above the price channel support, which was broken. Stop-loss can also be extended up to price channel resistance to give more room for the price.

Finally, the trade would look something like in the below figure. This trade will result in a risk to reward ratio of 1:1 minimum. However, if you are patient enough to wait for the trend to continue, the RRR can be increased.

Note – The above trade is an example of a sell trade. The same rules apply for a ‘buy trade,’ but in reverse, as this time, you will be using a downward price channel.

Bottom Line

The price channel strategy can be used in any kind of market. It can also be incorporated into your current strategy to bring a new dimension to price action trading. If you are good at spotting price patterns and money management, this strategy can make huge profits. Happy Trading!