Introduction
Trying to pick the top or bottom is one of the favorite things a trader likes to do. We tried to do that using the ‘Dolphin Strategy.’ We did that with no indicator support. We are again going to unveil a strategy that does pick a top or bottom with no indicator support. This strategy is called the 7-Day period strategy. Let us take a step back and think, indicators are nothing but a mathematical representation of prices, which are calculated in different ways.
Therefore, sometimes it is important to look at prices alone. The 7-day period strategy is based on the idea that after every seven days of consecutive strength, a currency pair’s move is due for a retracement. The question arises, why seven days? This number is derived after constantly watching the market for years. Often, a new trend emerges at the beginning of the week, and if the trend is strong, it can last for several days with no retracement.
Many psychologists believe that human beings have the best retention rates on numbers that are in groups of seven or less. This is one of the reasons why phone numbers in the U.S. only have seven digits, aside from the area code. We have seen that the seven-day reversal pattern is more accurate in a trending market. We gave occasionally seen those periods when the market continues to move in the same direction after seven days of the exhaustive movement, i.e., from the 8th day onwards. Even though the setup is rare, when it does occur, it is significant.
Time Frame
As the name of the strategy suggests, it can be traded only in the daily time frame.
Indicators
In this strategy, no indicators are used. Simple Moving Average (SMA) can put on the chart to get a clear idea of the trend.
Currency Pairs
This strategy can be applied to all the currencies in the forex market. Exotic pairs should be avoided.
Strategy Concept
The basic idea of the strategy is that when the market is strongly trending on the hourly chart, the retracement does not last more than seven days and changes its direction at the sixth or seventh day. This retracement is considered to over-extended, which leads to a strong reversal in the pair.
If the sixth or seventh candle coincides with a key technical level, the ‘move’ may very well stall at that level and continue its major trend. To implement the strategy effectively, we need to know trends and trend retracement. Since this strategy is based on fixed rules and price action, it is not necessary to know about technical indicators. However, SMA and ATR can be used for trend identification and measuring the momentum of the market.
Trade Setup
In order to understand how the strategy works, we will apply it on the USD/CAD currency pair and execute a ‘short’ trade using the strategy.
Step 1
The first step is to identify the direction of the market. As this is a trend trading strategy, we should be able to identify the major direction of the market. If the market is making higher highs and higher lows, it is an uptrend, or if the market is making lower lows and lower highs, it is a downtrend. A trend can also be determined using the Simple Moving Average (SMA) indicator. Very simply, if the price is below SMA, we say that the market is in a downtrend, and if the price is above the SMA, the market is said to be in an uptrend.
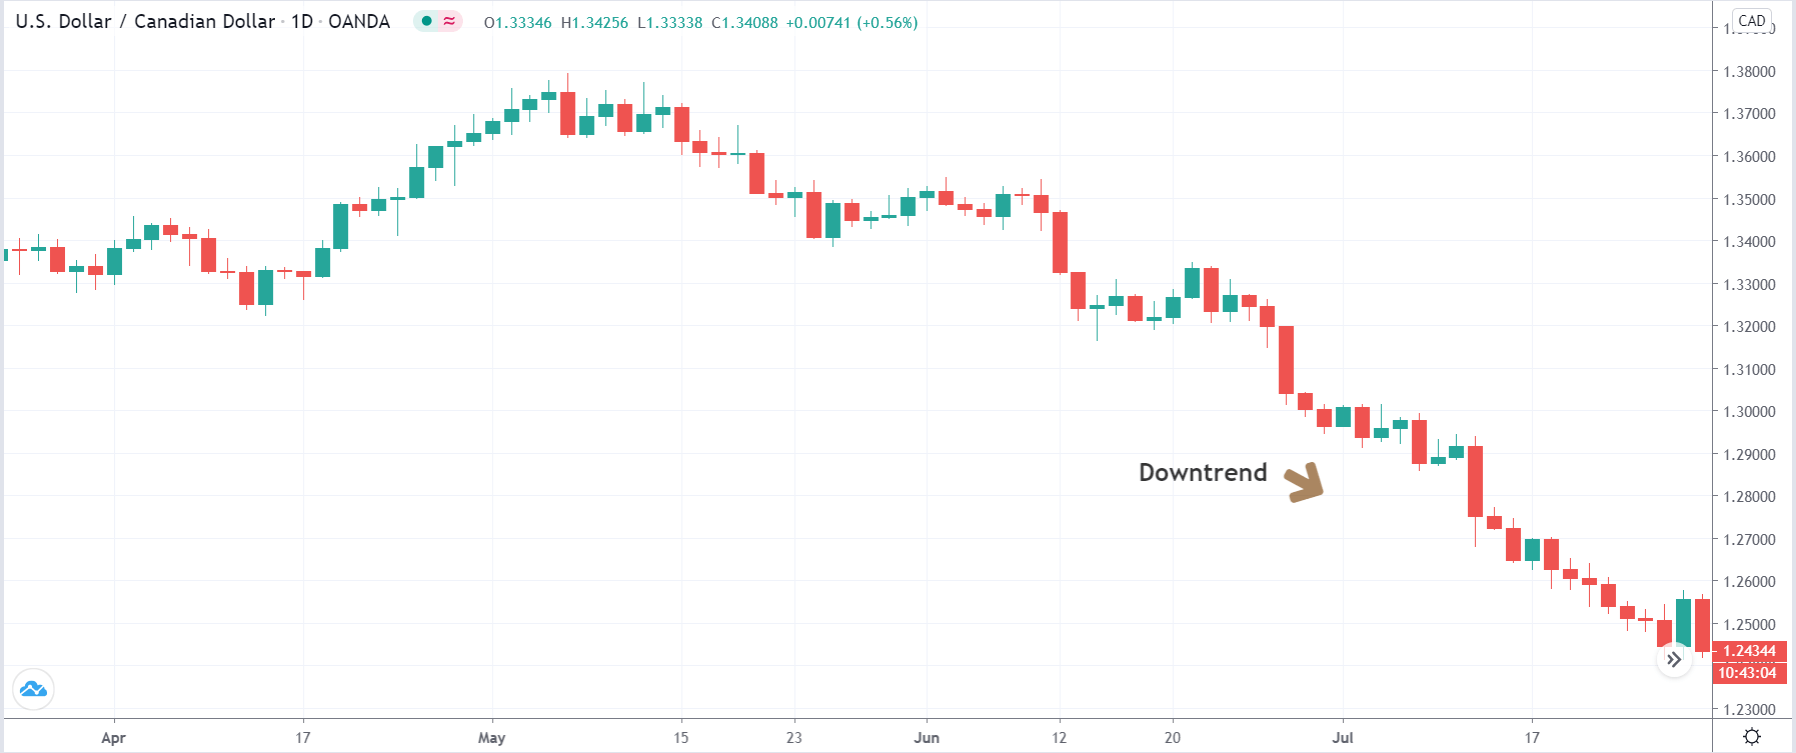
In the example we have considered, from the below image, it is clear that the market is in a strong downtrend.
Step 2
Next, wait for a retracement from the highest or the lowest point, which we will be evaluated based on our strategy rules. The retracement should be such that there are seven consecutive candles of the same color. One or two candles of the opposite color are okay, but we need to make sure that it does not impact the structure of the retracement. These seven candles represent an extended pullback, which can lead to reversal any moment.
In the below image, we can see seven days of the up movement, which is exactly the kind of retracement which we need for the strategy.

Step 3
In this step, we need to check the position of the price after seven straight days of the movement. The strategy works best if the price coincides with a key technical level of support and resistance. This is because, in these areas, the price action is very strong, and market moves as per expectations. But it is important to make sure that no step of the strategy is used individually. All of them need to be used collectively.
We enter the market once we get confirmation after the 7-day period. The confirmation is nothing but a bullish candle in case of a ‘long’ setup and a bearish candle in case of a ‘short’ setup.
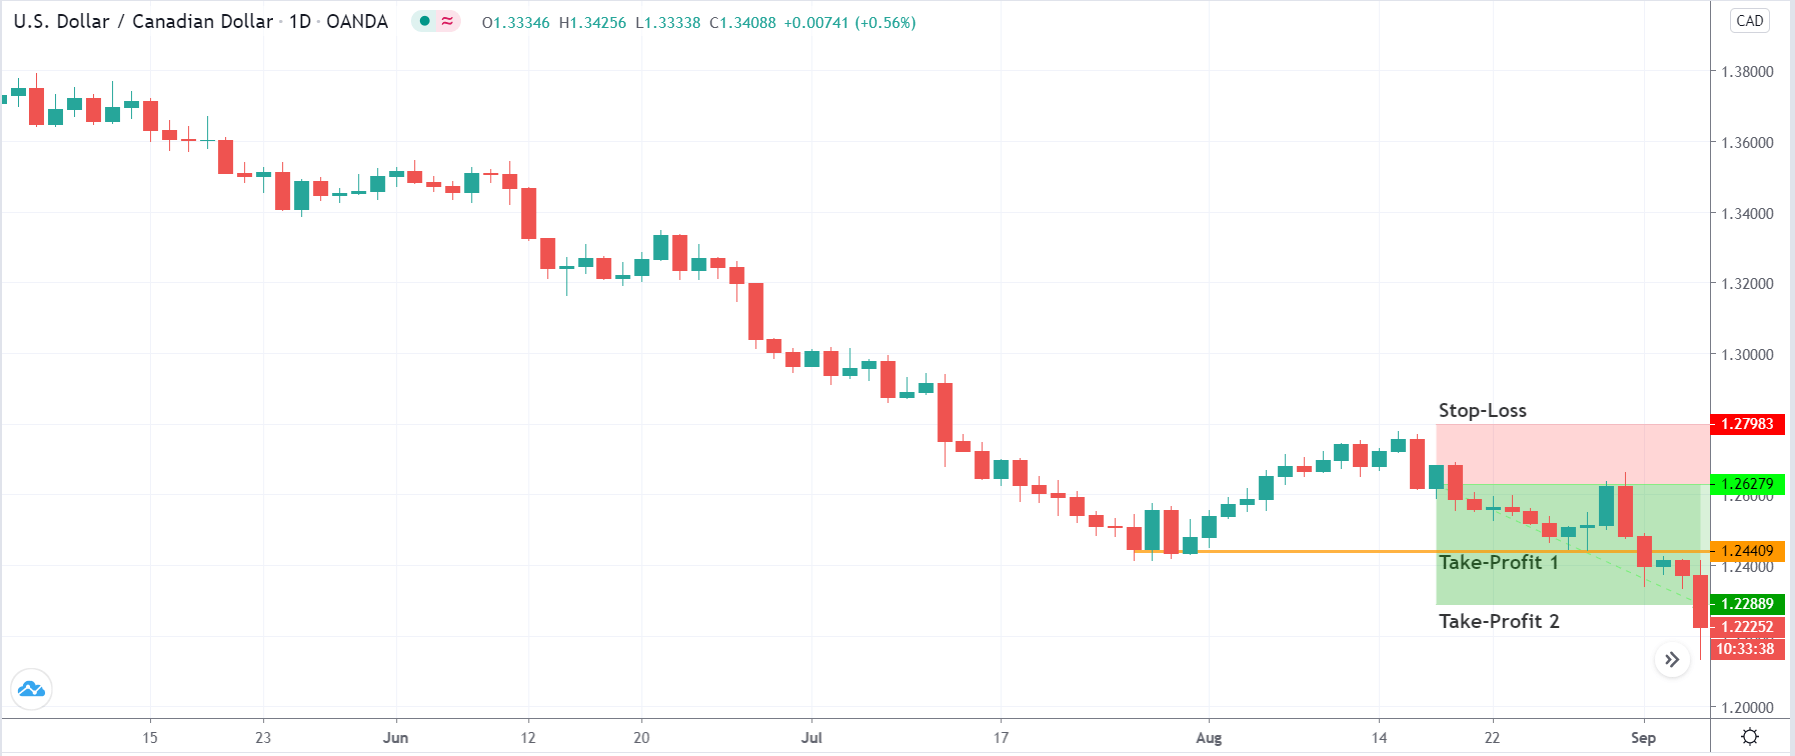
In our example, we see that the price has approached the previous ‘lower high’ of the downtrend. This is an area where we can expect sellers to get active and take the price lower.

Step 4
Finally, we need to determine the ‘stop-loss’ and ‘take-profit‘ for the strategy. We place the stop-loss a little higher than the bullish candle when entering for a ‘long’ and little lower the bearish candle if entering for a ‘short.’ We take profit at two places in this strategy. The first take-profit is set at the previous higher high or lower low, while the second take-profit is set at 1:2 risk to reward.
Strategy Roundup
As there are many conditions associated with the strategy, the setup might be rare, but when it does occur, it is significant. We have seen trends where the retracement occurs for just a few days before it starts moving in the direction of the major trend. But these setups are not reliable. The most important condition of this setup is the continuous appearance of bullish or bearish candles for seven days.