
Introduction
In the previous article, we discussed a strategy that was based on three indicators, namely the RSI, Stochastic, and SMA. It was not only a bit complex in nature but involved many rules that had to be fulfilled before we could make a ‘trade.’ Also, the probability of occurrence of the signal was lower as it involved many indicators.
In today’s article, we will discuss a setup that is observed more often in the market and has a higher probability of success. Again, the strategy may not be suitable for day traders as it used a longer time frame for analysis. In this strategy, we will be examining the 4-hour time frame chart of the currency pairs. This is simpler than the previous strategy.
Time Frame
As mentioned in the previous paragraph, the strategy yields the best results when applied on the 4-hour time frame. However, the ‘daily’ is also a suitable time frame for the strategy.
Indicators
We will be using the Relative Strength Index (RSI), with a 14-bar period. The overbought and oversold levels stand at 70 and 30, respectively. We also apply the Bollinger Band indicator with its default settings.
Currency Pairs
This is the best part of the strategy, where we can apply on all currency pairs listed on the broker’s platform, including few minor and exotic pairs.
Strategy Concept
The strategy is based on a simple concept that the RSI is a very powerful indicator of a trend. It can accurately identify the highs and lows that will give rise to a new trend. This is combined with the Bollinger Band indicator to generate exact entry points for the strategy.
The trend becomes especially reliable when the reading of RSI makes a swift jump from an oversold level to a median level (above 50) and vice-versa. The Bollinger Band indicates the formation of a ‘low,’ after which we can execute a ‘long’ trade. Similarly, when Bollinger Band pin-points a ‘high,’ we execute ‘short’ trades in the market. The exact rules of ‘entry’ will be discussed in the next section of the article.
The risk-to-reward (RR) of the trades done using this strategy is highly appealing. This is because it employs a small stop-loss with a much higher take-profit. If the market is in a strong trending state, traders can ride their profits as long as they see signs of reversal.
Trade Setup
In order to explain the strategy, we have considered the 4-hour chart of GBP/JPY, where we will be illustrating a ‘long’ trade. Here are the steps to execute the strategy.
Step 1
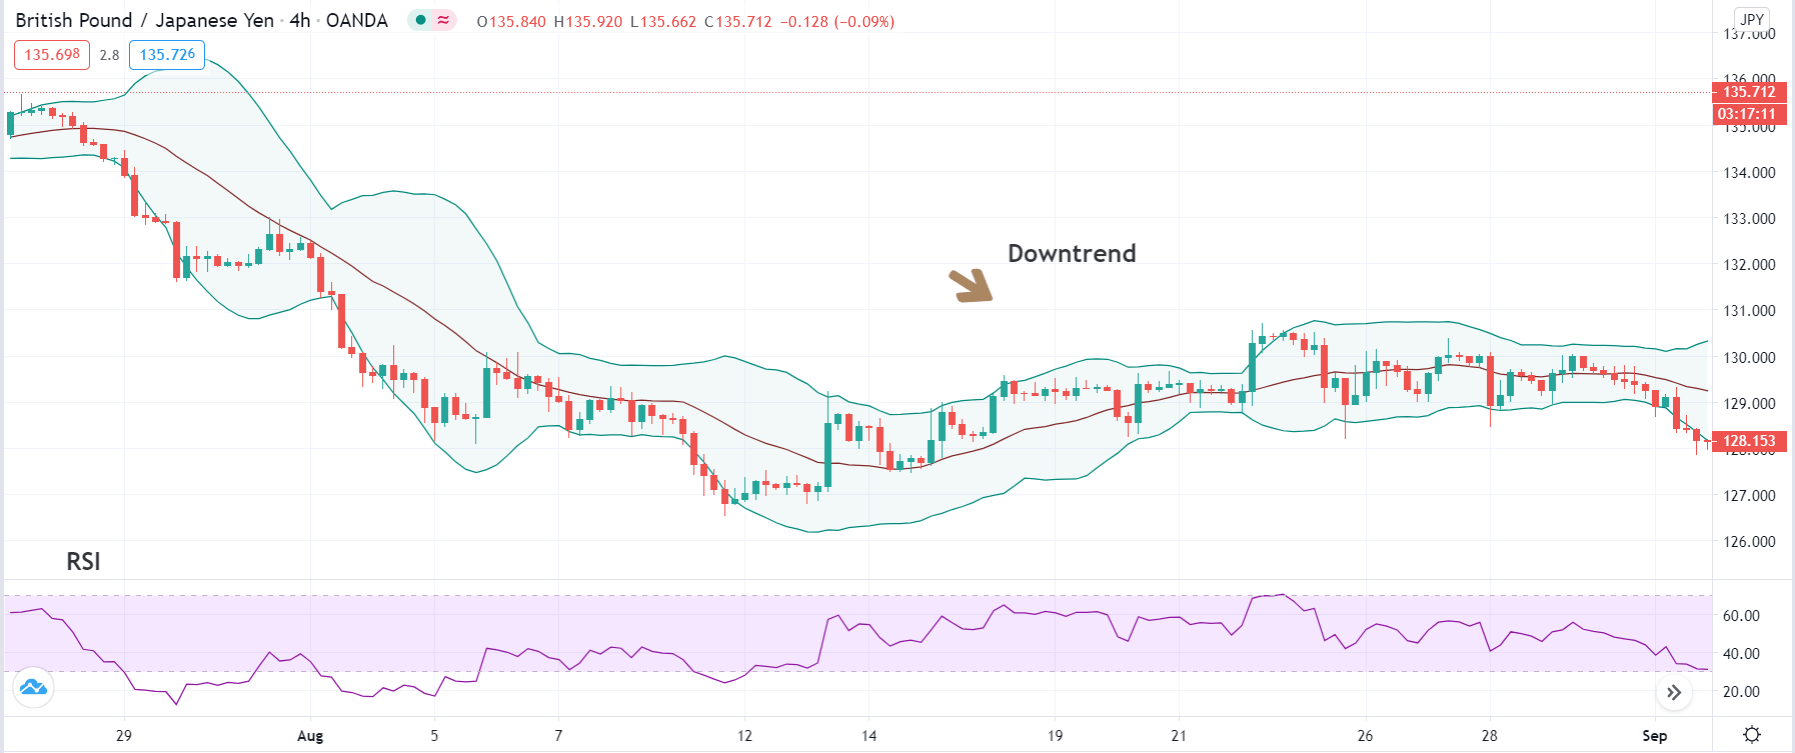
The first step is to open the 4-hour timeframe of the desired currency pair and plot Bollinger Band and RSI indicator on it. Just from the appearance and basic knowledge of trends, identify the trend of the market. This means if the market is making higher highs and higher lows, the market is in an uptrend. And if we see lower lows and lower highs on the chart, it is a downtrend. We can also take the assistance of a simple moving average (SMA) to get a clear picture of the trend.
In the case of GBP/JPY, it is evident from the below image that the market is in a strong downtrend.
Step 2
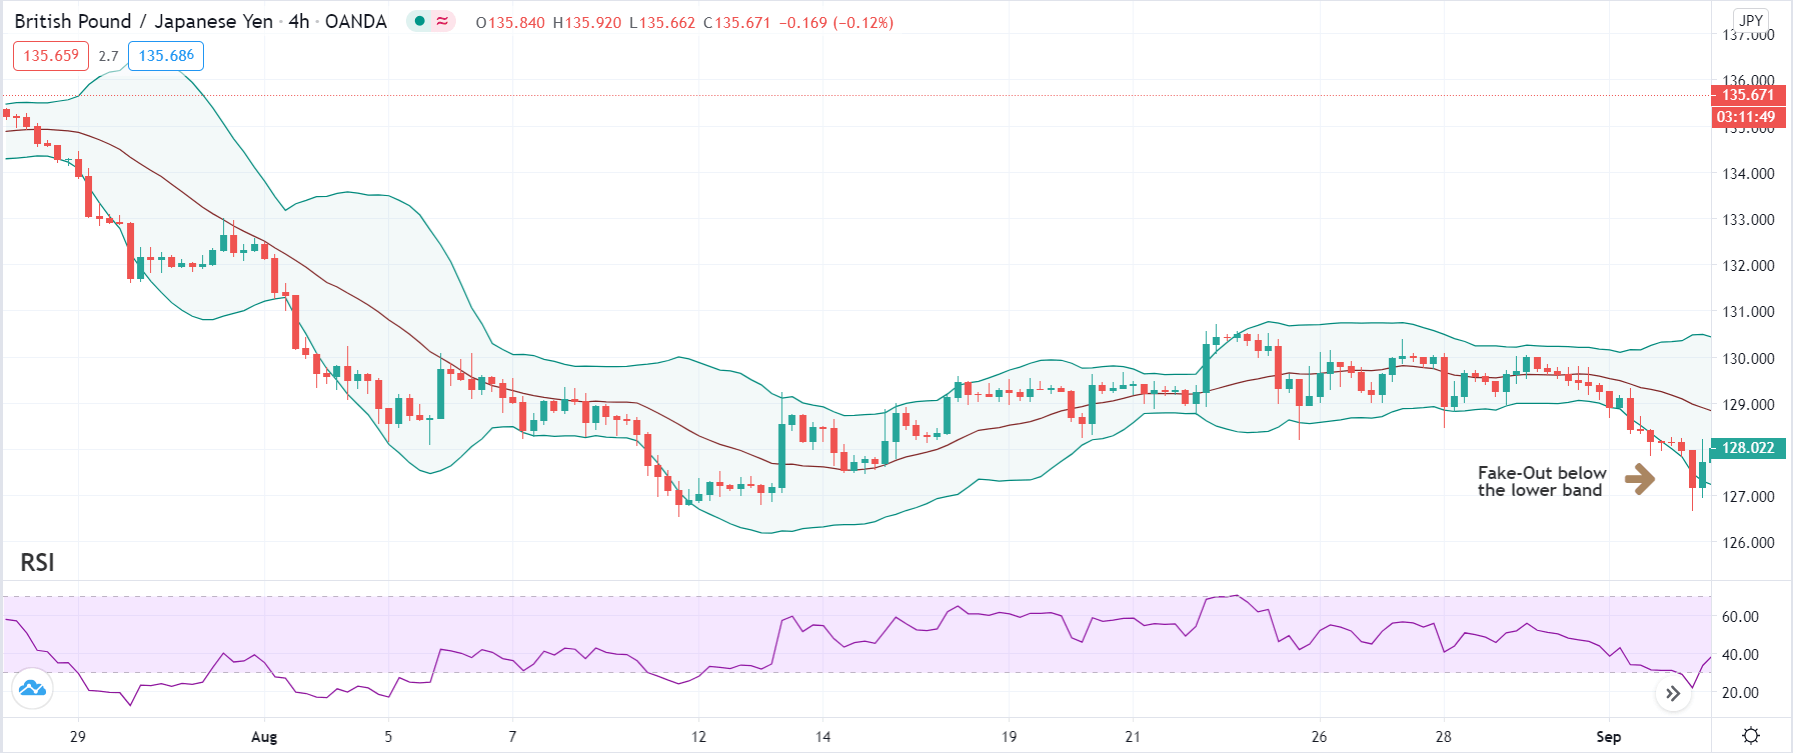
Next, we need to wait for the price to go above the highest point visible on the chart, where we will be analyzing signs of a reversal to the downside. Similarly, we need to wait for the price to go below the lowest point visible on the chart, where we will be analyzing the signs of a reversal to the upside. For example, suppose the price is near its lowest point visible on the chart. In that case, we say that market may be reversing to the upside if a bearish candle closes below the lower band of the Bollinger Band, and the immediate next candle is a bullish candle that closes above the lower band. This has to be accompanied by the RSI moving into the oversold zone (below 30).
In case of a reversal of an uptrend, a bullish candle should close above the upper band of the Bollinger band with a bearish candle that closes below the upper band. At this price, the RSI should indicate an overbought situation of the market (above 70).
Step 3
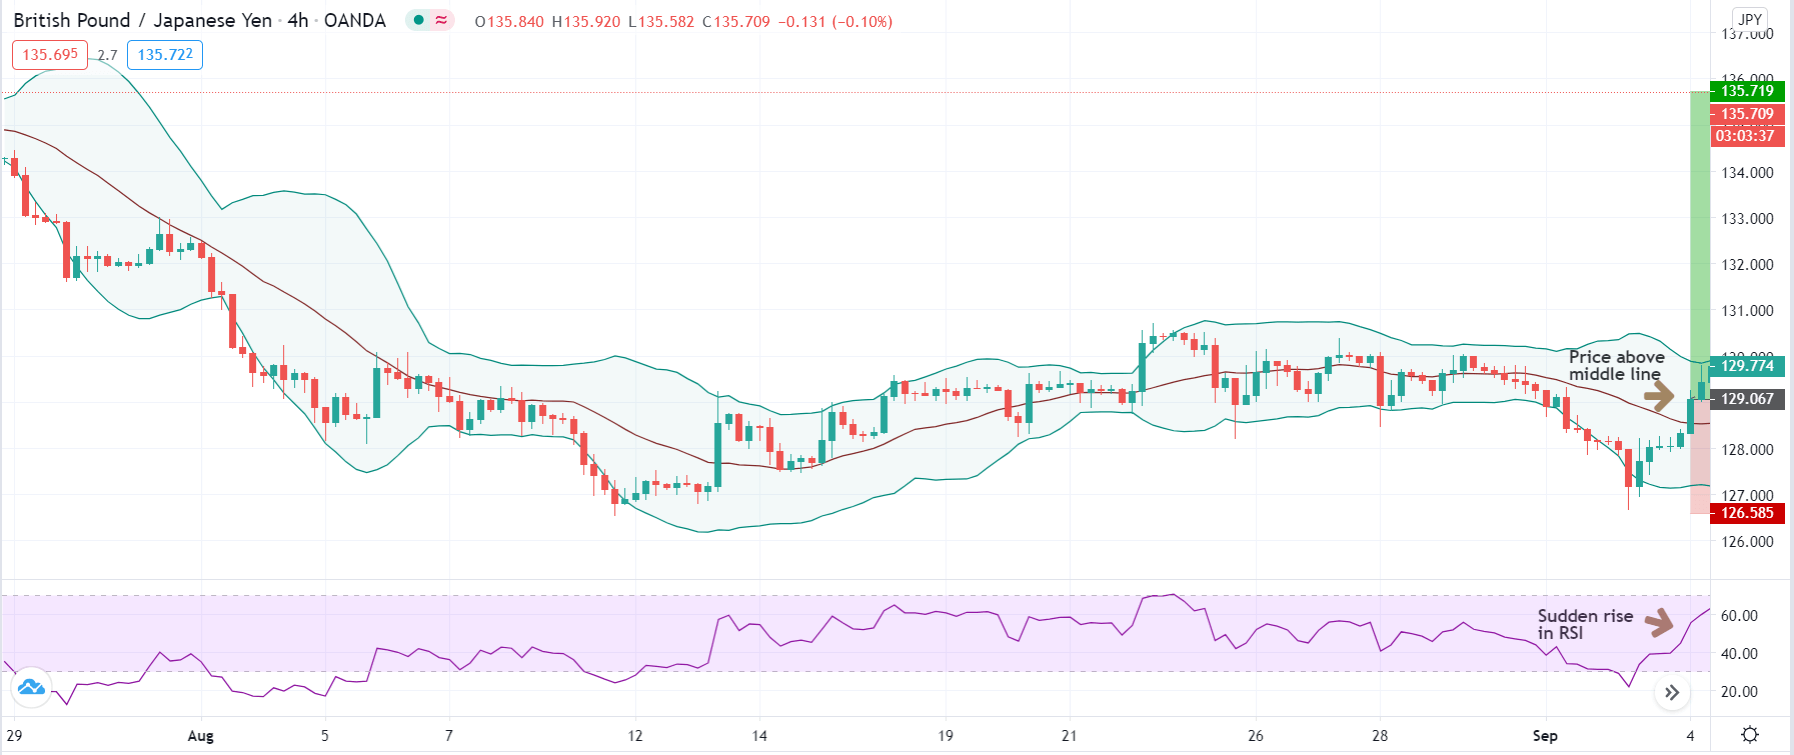
This is the easiest step of the strategy where we have to only observe the movement of price following the ‘two-candle’ pattern discussed in the previous step. Essentially, we need to see that the price starts moving in the direction of the reversal, i.e., above or below the median line of Bollinger Band. This should again be accompanied by a rising RSI for ‘long’ entry and falling RSI for a ‘short’ entry.
In the below image, we can see how the rise in price above the median line goes with a sudden rise in RSI.
Step 4
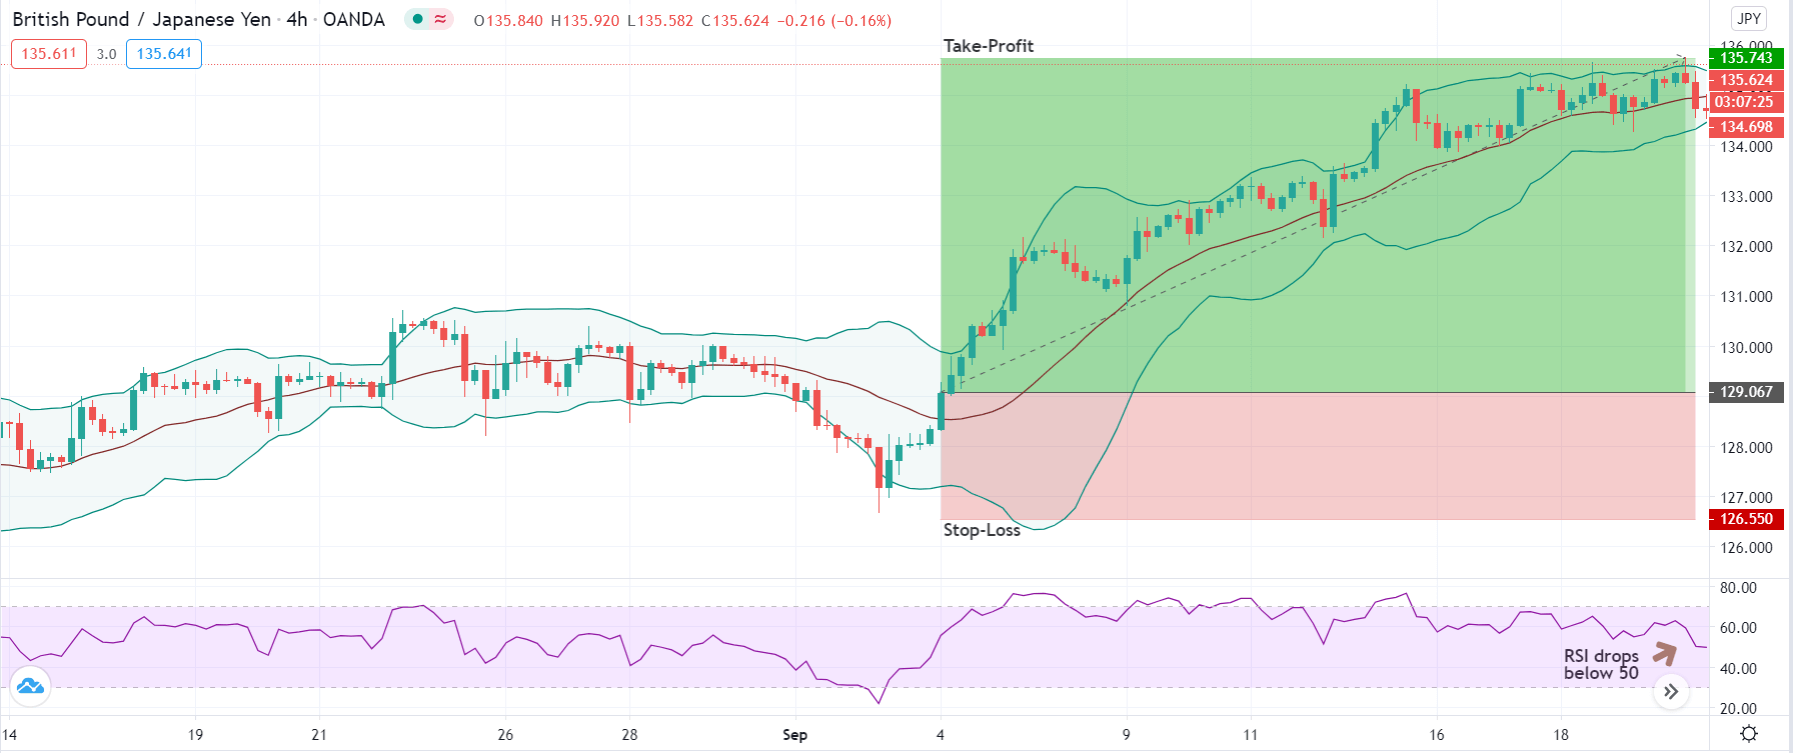
In this step, we determine the stop-loss and take-profit for the trade done using this strategy. The stop-loss is placed just below the ‘low’ or above the ‘high’ from where the market reverses. However, there is no fixed take-profit level here. We exit a ‘long’ trade once RSI goes below 50 and start moving lower. While a ‘short’ trade is exited as soon as RSI goes past the level of 50.
As we can see in the image below, the market reversed fully, and the trade turned to be extremely profitable.
Strategy Roundup
When Bollinger Band and RSI are combined to generate trade signals, we can accurately identify the market top and bottom where we take advantage of the reversal. But this can only be done efficiently after practicing well. The above strategy is suitable for swing and part-time traders.