Before talking about the indicator, it is important to remember that it is the RSI. The RSI measures the ratio of upward movements to downward movements and makes the calculation so that the index develops in a range of 0-100. It was developed by J.Welles Wilder. If the RSI is equal to or greater than 70, the instrument is assumed to be over-bought (a situation in which prices have risen more than expected on the market). An RSI equal to or less than 30 is considered to be a sign of asset overbooking (a time when prices have fallen more than expected on the market).

Contrary to popular opinion, the RSI is a primary indicator. The formula for the RSI indicator takes two equations that are involved in the formula solution. The first equation of the component obtains the initial value of the Relative Strength (RS), which is the ratio of the mean ‘Up’, is closed to the mean of ‘Down’, is closed during the periods ‘N’ represented in the following formula:
RS = Average of day closures ‘N’/ Average of day closures ‘N’
The real value of RSI is calculated by indexing the indicator to 100, using the following formula:
RSI = 100 – (100 /1 + RS)
After reviewing the operation of the RSI, we will say that this indicator is a traditional RSI update in MT4. You can alert and send notifications (if configured) when :
-RSI line crosses its MA line
-RSI Enter and Exit Overbought and Oversold Zone. These zones can be set by the entrance.
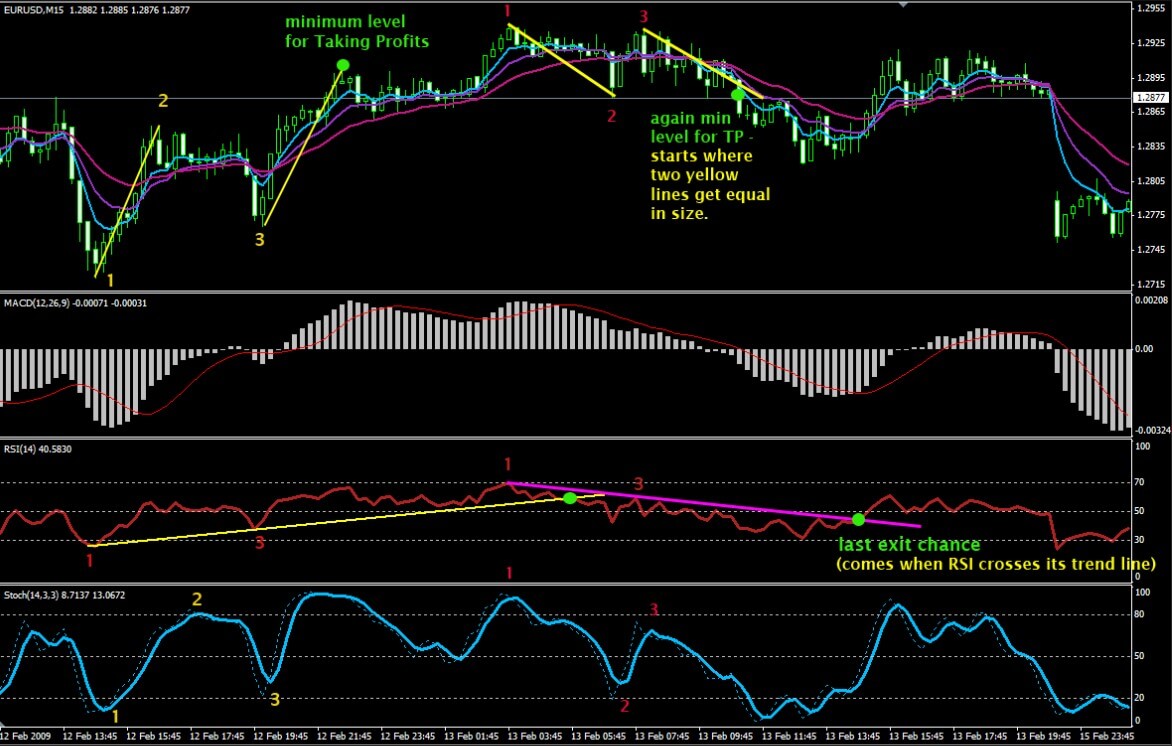
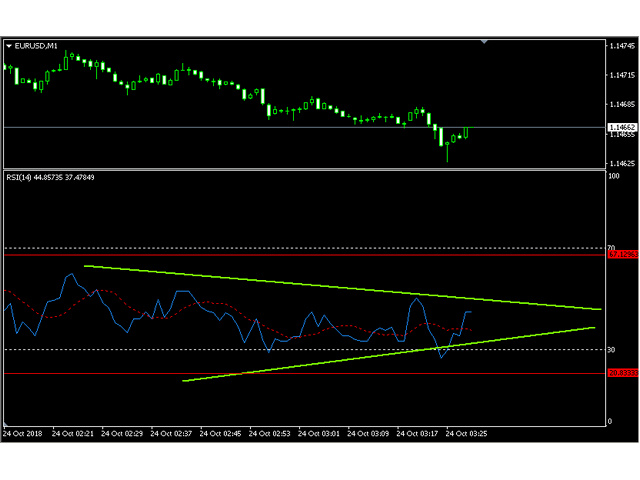
-RSI cross line for trend line and horizontal line.
It has two working modes: in Closed candle and Running candle. With Closed candle mode, it only alerts when a candle is closed. The trader will only have to draw a line (trend line) in the RSI indicator window, and the indicator will automatically find that line and check if it is crossed.
It is a straightforward and useful indicator. The line alert (trend line and horizontal line) is activated by default. The trader only decides to use or not the alert for MA cross or Overbought/Oversold zone enter/exit. It is so simple to jump to trading using the Forex RSI indicator, that novice traders often start trading without trying other parameters, or educate themselves on the proper interpretation of an indicator, due to the desire to earn money quickly.
As a result, the RSI has become one of the most poorly used MT4 indicators. Once correctly understood and applied, the RSI has the ability to indicate whether prices are trending, when a market is over-bought or oversold, and the best price to enter or exit a transaction.
It can also indicate which trading period is most active, and provides information to determine key price levels for support and endurance. The RSI can provide you with trend technical information as well as RSI buying and selling signals. It is crucial that you practice RSI trading strategies in a demo account first, and then apply them to a live account. In addition, RSI strategies can complement any Forex trading strategy you have already been using.
In short, we are talking about a primary and classic indicator, as many traders have started trading with its use. This indicator can help us in making buying or selling decisions and can be very useful in the beginning. This version of the indicator is available on the MQL market, in the indicators section, at a price of 30USD, or for rent at a price of 10 USD per month. It is an economic indicator as there are multiple versions of the RSI available on the market.