Categories
Forex Basic Strategies

Successfully Scalp Forex Pairs with these Two Tools

Introduction

Scalping is a short term trading style, and it is quite popular among professional Forex traders. This type of trading is more concise than day trading, which involves traders placing buy/sell orders throughout the trading day. But Scalping is different. Scalpers believe that making money from the small price action moves is easier than waiting for the considerable moves.

For scalping, our focus should be mostly on technical analysis rather than fundamentals.  By using technical analysis, traders use historical price information to predict the future price movement. To be successful in scalping, traders must have live feeds, direct access to the broker, and have the stamina & patience to sit in front of the computer and place as many trades as possible in smaller time frames to make money.

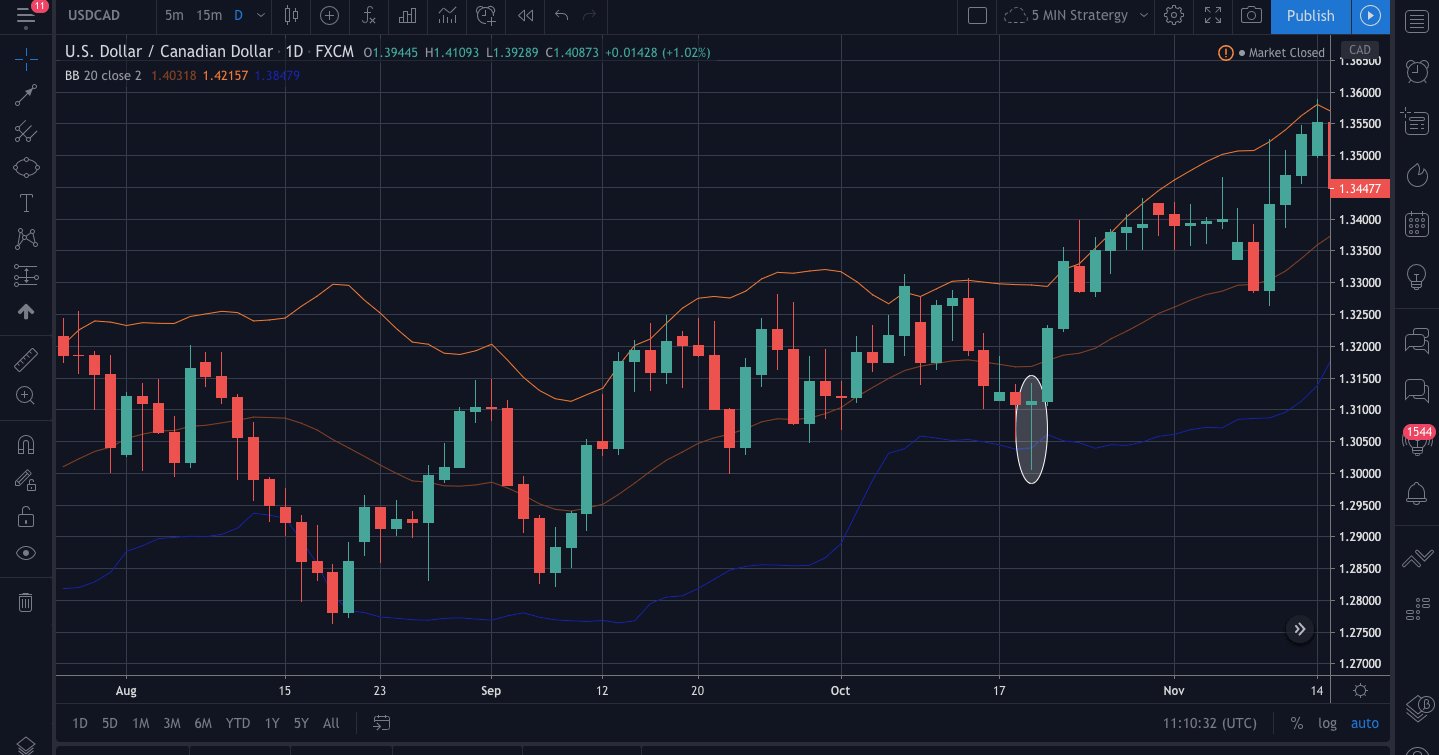
Scalping typically requires smaller timeframes such as a 5-minute, 15-minute, or even 1-minute charts. Some traders also use the tick chart or 30-seconds chart to scalp the Forex market. However, it requires an advanced skill set to be successful at this because the lower the timeframe is, the faster it moves. In this article, Let’s learn how to scalp the 1-minute Forex charts using Pin bars and Trend lines.

Pin Bars

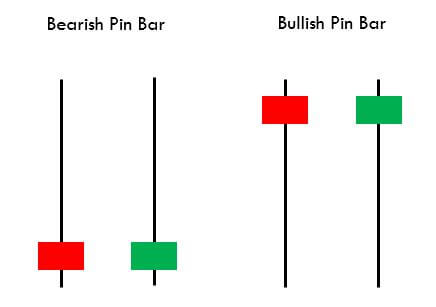
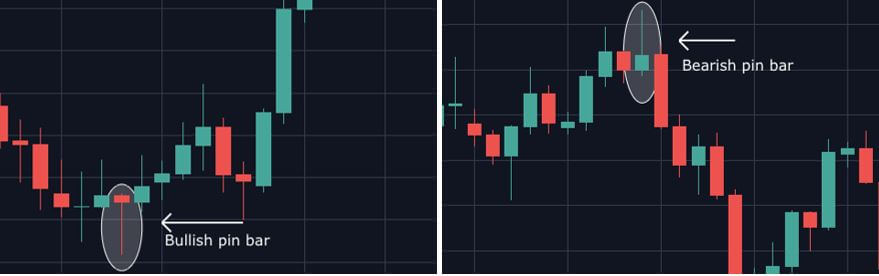
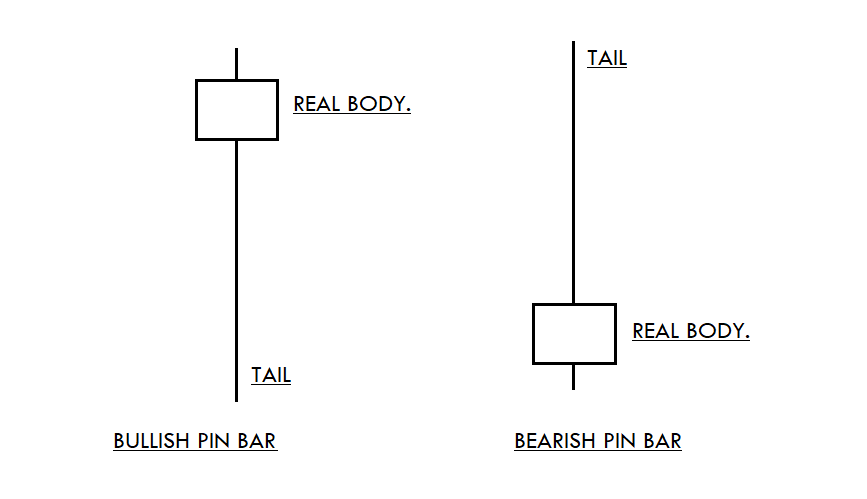
Pin Bar is a candlestick pattern that consists of only one candle, which represents a sharp reversal. There are two types of Pin Bar.

  1. The Bullish Pin Bar’s closing price is higher than the candle’s opening price, and the candle’s wick must be two to three times longer than the real body.
  2. The Bearish Pin Bar’s closing price is lower than the candle’s opening price, and the tail of the candle must be two to three times longer than the real body.

Trend Lines

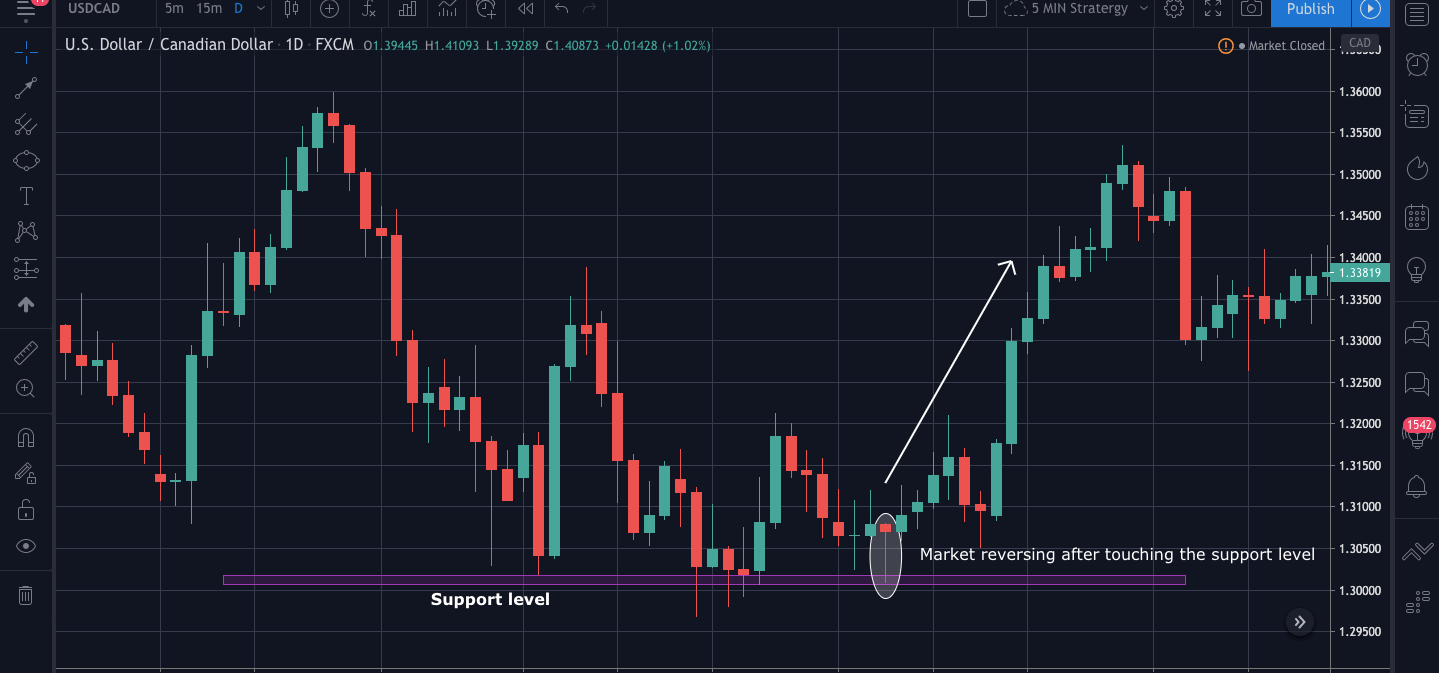
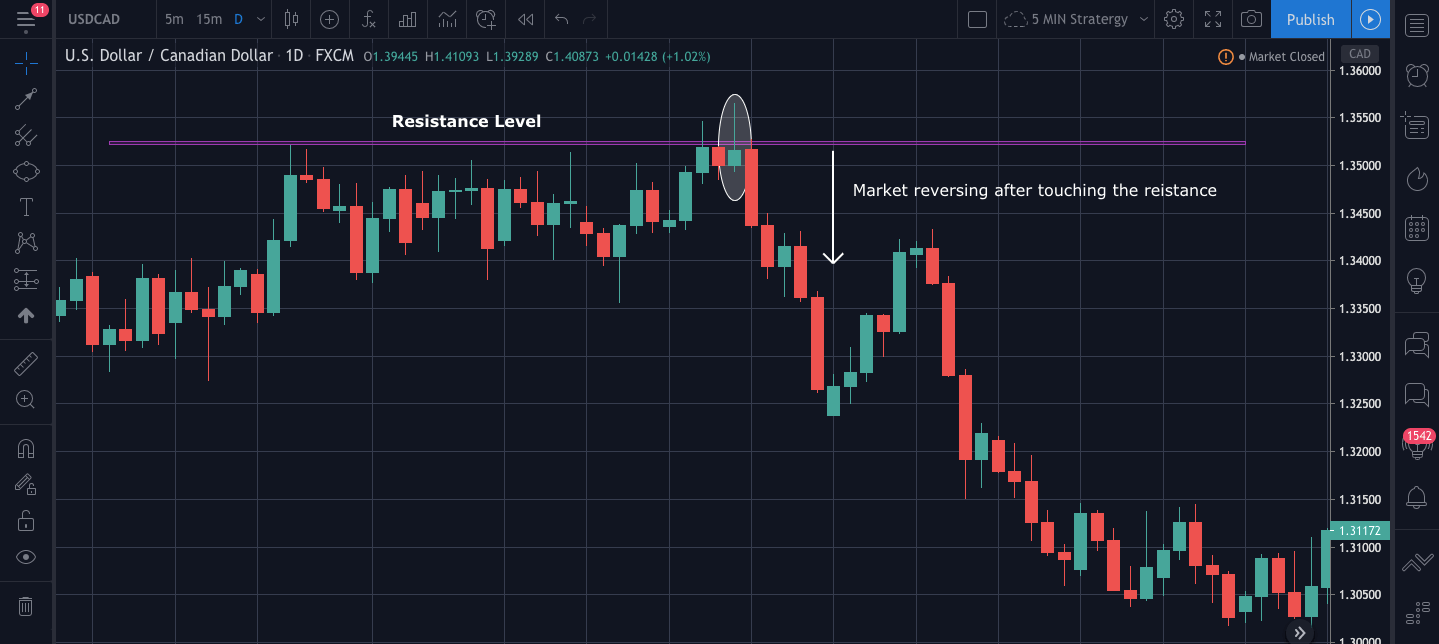
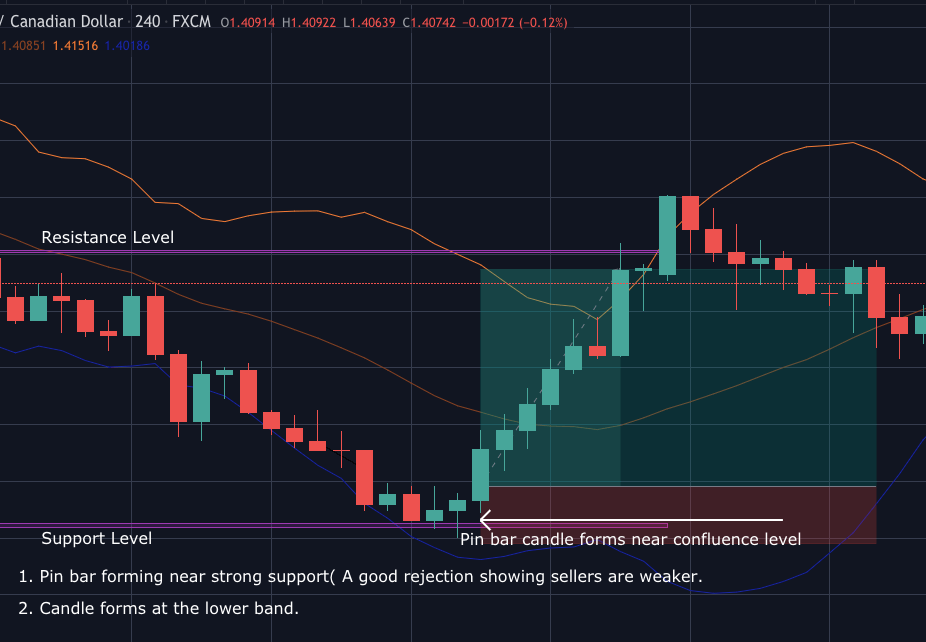
Trend lines act as an essential tool for analysts while performing technical analysis. These lines are a visual representation of support and resistance levels in any trading timeframe. Traders apply these trend lines on the price charts to get a clear picture of the ongoing trend to make an accurate trading decision. Also, the trend lines on the highs and lows of the price chart create a channel.

Trading Strategy – Pin Bars + Trendlines

The one-minute trading timeframe volatiles a lot, and this small timeframe never moves in a single trend. We will always see the transitions from buy trend to sell and sell trend to buy in less than a couple of minutes. This is the essence of trading the lower timeframes. Therefore, before trading the one-minute timeframe, it is advisable to let go of all of your rigid trading beliefs.

Most of the scalpers fall into their ego and deny to close their losing positions. If you fall into this trap, then scalping is not for you. You must have a strong mindset and follow the rules like world-class traders to scalp the Forex market successfully.

Buy Examples

As you can see in the below image of the GBP/CHF Forex pair, the price was in an uptrend. Whenever the price approached the trend line, buyers immediately came back and printed a Pin bar candle, which is an indication to go long.

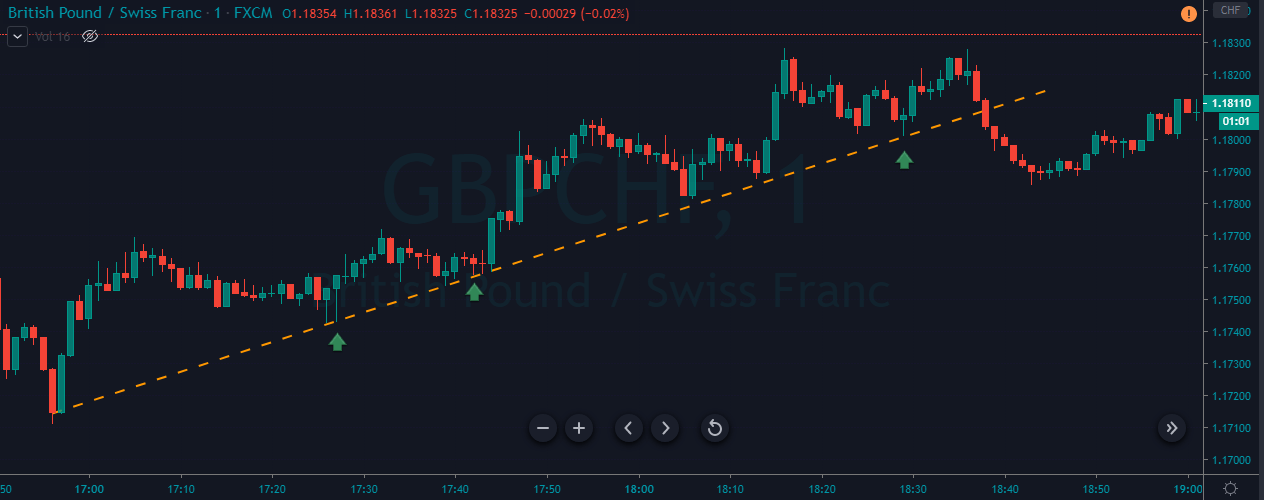
In this example, the market gives us three buying opportunities, and all the three trades performed well. When you take an entry at the pin bar formation, and the very next candle goes against you and closes below the pin bar, it is an indication for you to close your positions and wait for the next signal. On a one-minute time frame, always go for 2-3 pip stop loss and 6-7 pip targets only.

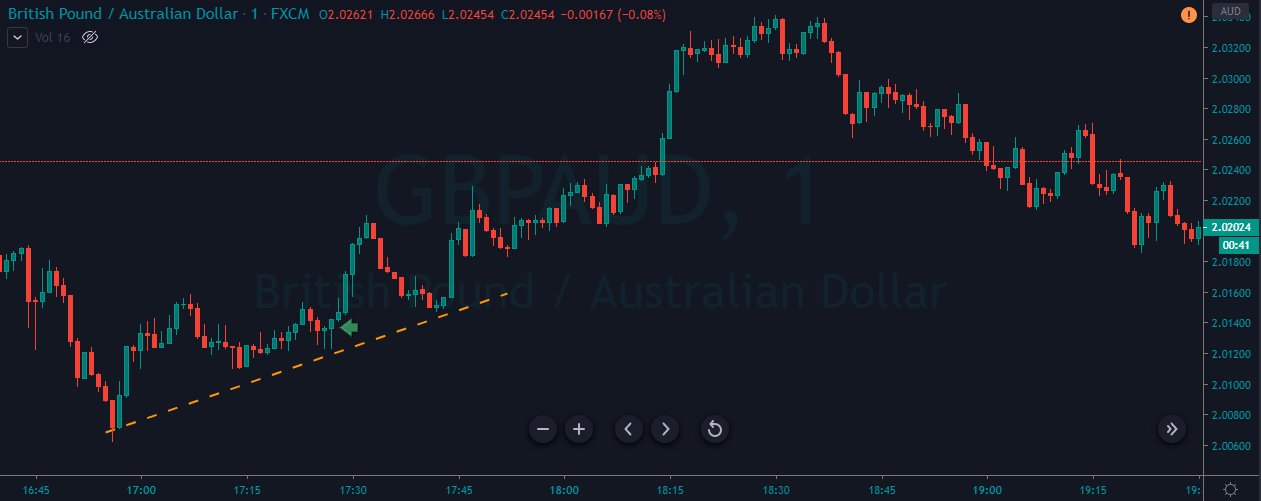
Below is another buying example in the GBP/AUD Forex pair. Here, the market gave us only one trading opportunity. As the price chart implies, the buyers were in complete control, and the price action is moving calmly. This means that there is a very less chance of spikes or fake outs. It is always advisable to find the less volatile currencies and try not to scalp the opening hours of the market.

Sell Examples

In the below USD/CHF 1-minute Forex chart, the overall trend was down. We can see the price printing the pin bars twice in a downtrend, which indicates us to go short. There are various ways to close your positions. We can choose any significant support/resistance area to book profit or close our positions when the price action starts to lose its momentum.

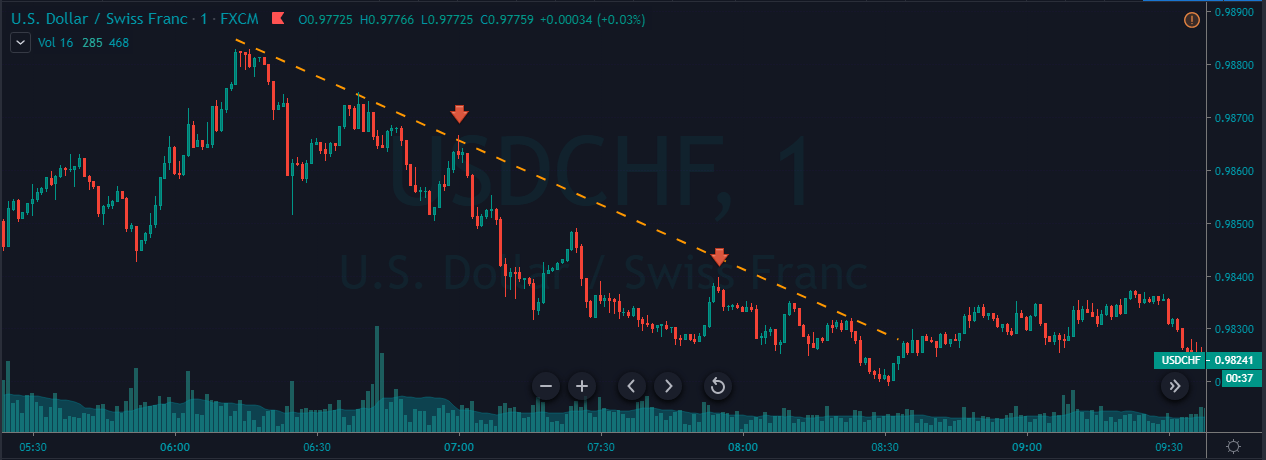
Some scalpers prefer to ride longer moves based on the market circumstances, while some like to close their positions after making 5 to 6 pips. So exiting completely depends on your trading style.

Below is another selling example of this strategy in the USD/CHF Forex pair. When price approached the trend line in a downtrend, we can see the market printing Pin Bars. This shows that the price action is ready to print brand new lower lows. Activate your trade when the market gives both the signals. In healthy market conditions, expect brand new lower lows or higher highs, and please avoid trading choppy market conditions.

Conclusion

Scalping proved to be a great way to make profits in a very short time. Make sure to understand that it requires a lot of hard work, patience, and dedication to master trading the lower timeframes. The more the trades you get into, the more the amount of money you will make. Scalping can be very difficult in the beginning, but with some practice and a right strategy, you will get the hang of it.

It is hard to scalp the 1-minute chart by using price action alone. Most of the highly successful scalpers use some indicators and candlestick patterns to confirm the market trend. Using the pin bars and trend lines on the 1-minute chart will help you filter out the bad trading signals, and this will drastically enhance the odds of your trades. Cheers!

Categories
Forex Basic Strategies

Best Way To Trade The ‘Pin Bar’ Forex Chart Pattern – The Pin Bar Reversal Strategy!

Introduction

Price action or Candlestick analysis combined with some of the factors and confirmations is more reliable as they work out even without using too many indicators on the price chart. Using many indicators on the charts makes it difficult for traders to see the bigger picture (opportunities) in the market. We have numerous candlestick patterns in trading, but there are few on which many traders have their eyes on. One of those is the Pin bar candlestick pattern.

The pin bar candle is mostly used as a reversal pattern. A pin bar typically consists of a price bar with a long wick or shadow. The region between the open and close of the pin bar is called its real body, and a long tail is known as the wick. Pin bars generally have small real bodies in comparison to their long wick. The body of the pin bar is one-third of the total size of the candle. The long wicks of the candle show the area of the price that was rejected and signifies that the price will now move in the opposite direction of the wick.

The psychology behind trading a pin bar candle is that when a price is moving in one direction and reaches significant support or resistance level, it gets rejections. Rejection in a downtrend signifies that the seller pressure (supply) in the market is decreasing, and the buyer pressure (demand) has started increasing and vice versa. The pin bar, either bullish or bearish, signifies that the price does not want to go more down or up and want to reverse from that strong support or resistance level.

Understanding The Bullish & Bearish Pin Bars

Every time a pin bar candle occurring at a strong level does not always mean that the market is going to reverse from that level. To make this valuable, we must see that the overall picture and not just a single candle. In this trading strategy, we will see how we can analyze the overall market near that confluence level. Before that, let’s understand the two types of pin bar candlestick patterns.

Bullish Pin Bar Reversal Pattern

The bullish pin bar candle occurs when the price comes near a strong support level; this leads to the formation of a long wick of the pin bar and shows rejection from that level. This candle usually forms at the end of a downtrend and signifies that there can be either a short-term uptrend or a full reversal forming a strong uptrend.

Bearish Pin Bar Reversal Pattern

The bearish pin bar candle occurs when the price comes near a strong resistance level; this leads to the formation of a long wick of the pin bar and shows rejection from that level. This candle usually forms at the end of an uptrend and signifies that there can be either a short-term downtrend or a full reversal forming a strong downtrend.

Trading Strategies

Pairing The Pin Bar candles With Support & Resistance Levels

As already mentioned, just finding a pin bar candle at the support and resistance level is just not sufficient to trade. We have to figure out what the market is exactly trying to show us. When we see the candles approaching a strong support or resistance level, we have to analyze all the previous candles carefully. If the candles are very big and the momentum is very high, it is less likely to bounce back from that particular level. So, what we have to do is carefully track the candles with wicks. Candles with wicks show that the particular trend momentum is getting weak, and the pressure is reducing as the level is approaching.

After we see candles with wicks and some weaker candles, we will wait for our pin bar candle. As soon as we see the pin bar candle, we have to wait for the next candle to close above the pin bar’s high. We can then buy or sell in the market and place our stop loss 2-3 pips below the pin bar’s low.

In the below USDCAD 1Hr chart, we can see that the market touches the support level 3 times, the first time the candle was a long and strong bearish candle, and so we must take trades as the picture is still not clear. The second time when the market reaches the support, we see the candles have small bodies and more wicks. This tells us that the seller pressure is decreasing. Finally, for the third time, the market started getting rejections even before touching the support level, and we can also see so many long wicks in the candles. Finally, we see a pin bar candle touching the support level and getting the rejection, and then we see so good bullish momentum.

Below is the chart of USDCAD 1hr, market getting a rejection from the resistance level.

Pin Bar Pattern + Bollinger Bands

We are already familiar with one of the famous indicator called the Bollinger band that is used to measure the volatility of the market. We will now use a pin bar with the Bollinger band and understand how we can find some good trades opportunities.

The below chart is USDCAD 1Hr time frame over here. We can see that the market has not pierced the lower band since a long time as mostly the price is between the upper and the lower band. Moving forward, when the candles come close to the lower band, we see a pin bar occurring after the market gets rejection. After the formation of a pin bar candle, we can see the market getting the buying momentum, and it becomes bullish.

Trading With The Confluence Level

As from the above strategies, we are clear how the market behaves when a pin bar occurs at strong support and resistance level and the extreme level of Bollinger band. Now we will see what happens when a pin bar occurs at confluence level. A confluence level is an area that is on the radar of many traders, and many technical indicators generate the same signal. This trading concept is used by price action traders to filter their entry points and spot high probability signals in the market.

The below example is the pin bar forming at the extreme lower band and a strong support level. We can see that as the market reaches the support level, the bodies of the candles get weaker and smaller, forming longer wicks. Also, the pin bar pierces the lower band near that support level giving us a better signal for a buy.

Talking about the entry and exit points, our entry will be the point when the next candle crosses the high of the pin bar candle. As we see, it is a bullish pin bar; we can be sure that our entry is good if it crosses the high with good momentum. Our exit here will be the next strong resistance level. If you use a trailing stop loss, then we can move the stop loss to breakeven and be in the trade as long as you see the higher high higher low as, after a trend reversal, the candles move very fast and gives more profit and risk to reward ratio.

Conclusion

Trading with a pin bar candle has been proven to be one of the most effective trading strategies. As we saw, we must have a watch on all the candles when it approaches a confluence level because a single candlestick will not give us much information about what market is going to do next. The reliability of these candles is more with the higher time frame as it omits the noises on the chart, and we can have a clear picture. If you are a day trader, then you can 30min or 1hr time frame for executing the trade. Cheers!