Categories
Crypto Daily Topic Cryptocurrencies

Introducing Newton (NEW)

In a world where everyone looks out for themselves, it’s a breath of fresh air when a project comes out to work for everyone to get their fair share.

Newton, which believes that “everyone should benefit from economic growth,” is that project. Through what it calls a “community-based economy,” Newton wants to facilitate an economy where all participants benefit on an equal footing. 

The project is named so as a tribute to ‘great scientist’ and ‘founder of the gold standard system,’ Sir Isaac Newton. 

Core Features 

Newton plans to put into effect various features to realize these achievements. Let’s go through each of these below: 

#1. NewChain

NewChain is a technology that will enhance the project’s scalability, performance, and privacy. NewChain comprises a main chain and multiple subchains. The main chain handles the following: managing accounts, managing tokens, overseeing the subchains, etc. For their part, the subchains run the network’s main operations, such as overseeing consensus mechanisms and staking. Third parties can create their own subchains after staking the network’s native token – NEW. Network users can exchange value between both the mainchain and subchains and between the subchains. 

The main chain utilizes a Delegated Proof of Stake consensus, with block producers being chosen through a voting process. NewChain features a virtual machine called NewVM, which is compatible with programming languages that developers across the globe are familiar with, such as Typescript, C/C++, Java, and Python. Newchain also features smart contract templates so developers can have an easier time developing DApps. The chain can process upwards of 5 thousand transactions per second and support high-frequency activities such as the internet of things (IoT), e-commerce, and more. 

#2. Atom hashing 

Before we talk about atom hashing, let’s do a refresher on non-digital assets. For one, these assets are registered manually in an unreliable and fraud-prone process, making it hard for them to be represented on the blockchain. Things like labeling of these products and authenticating rights are difficult to do. 

Atom hashing is a process that utilizes technology machine vision to identify several characteristics like weight, volume, shape, volume, and so on. Based on these metrics, things like the identification and the authentic rights of a non-digital asset are quickly established. For instance, before a commodity leaves a factory, the results of the atomic hashing process can be recorded on the blockchain. Customers such as online shoppers can use this info to confirm if a commodity is the one that they ordered indeed. 

#3. NewNet 

NewNet is a decentralized computing tool that supports functions such as computing and storage. On the network, developers can publish computing tasks while selected nodes choose those tasks based on their computing power and complete them, upon which they get rewarded for it. 

Users can access the network through their everyday browser. They can choose to run the network through their local nodes or proxy nodes. 

#4. NewIoT

This network will support blockchain gateways, communication channels for IoT devices, and so on. It features a very powerful computing capacity and supports several access methods, including Ethernet/fiber, 3G, 4G, 5G, IoT, and communication protocols such as Wi-Fi, ZigBee, and more. IoT devices will store their aggregated info on NewChain through these pathways. 

The NewIoT specification can support multiple IoT devices, including sensors for temperature, humidity, vibration, harmful gases, and more. Other devices that can be supported include sound and image collectors and GPS. 

#5. NewAI

This is an intelligence engine that supports decentralized data sources, computing resources, and more so that various tasks can be completed successfully. It features data, model, and execution protocols called NDData, NDModel, and NDEngine, respectively. NDData is the channel through which users can access data.

It facilitates data compression, data encryption, and so on. NDModel is a tool through which developers can define various algorithm models, operations, and storage. NDEngine is a tool for functions like deployment, operation, running calculation software, and so on. 

Newton Project’s Community Growth Strategies

The Newton project team intends to carry out the following activities in a bid to expand the brand: 

  • Cooperate with various partners such as Wanqi Group to bring more users to the platform
  • Launch a string of social media marketing events
  • Come up with and provide tutorials to the community
  • Provide community members with progress updates

In the future: 

  • Improve the developer experience by upgrading developer kits 
  • Launch a Blockchain Debate Podcast to increase awareness of the project
  • Release an ambassador plan to popularize the project further

The NEW Token

NEW is the native token of the Newton network. It is an essential part of the ecosystem and will play a key role in transactions and smart-contract execution. 

Token Distribution of NEW

The distribution of NEW was done in the following fashion:: 

  • Seed sale tokens – 7.59%
  • Private sale tokens – 6.07%
  • Public sale – 0.33%
  • Huobi IEO tokens – 2.02%
  • Community incentives tokens – 60.71%
  • Team tokens – 10.12%
  • Foundation tokens – 13.15%

Key Metrics of NEW

As of September 27, 2020, NEW traded at $0.000584, while it ranked at #443 with a market cap of 12 million. The coin has a 24-hour volume of $705,269, a circulating supply of 20,571,994,592, and a total and maximum supply of 98,823,661,261. NEW has an all-time high of $0.016538 (April 19, 2019) and an all-time low of $0.000271 (March 13, 2020). 

Where to Buy and Store NEW

You can find NEW as a market pair of USDT, ETH, BTC, BNB, and HT and more at exchanges like HotBit, MXC, Huobi Global, HotBit, BiKi, Binance DEX.

The Newton Project currently supports official wallets for Windows, MacOs, and Ubuntu. 

Final Thoughts

Through its core features of NewChain, atom hashing, NewNet, NewIoT, and NewAI, the Newton project is set to usher in an economic playground where all participants benefit directly from economic growth. Its unique atom hashing technology is ground-breaking, and depending on how the team nurtures it, NewChain could become a core feature of the blockchain world and the entire tech space. The project is one to keep an eye on.

Categories
Forex Fibonacci

Fibonacci Confluence Zones

Fibonacci Confluence Zones

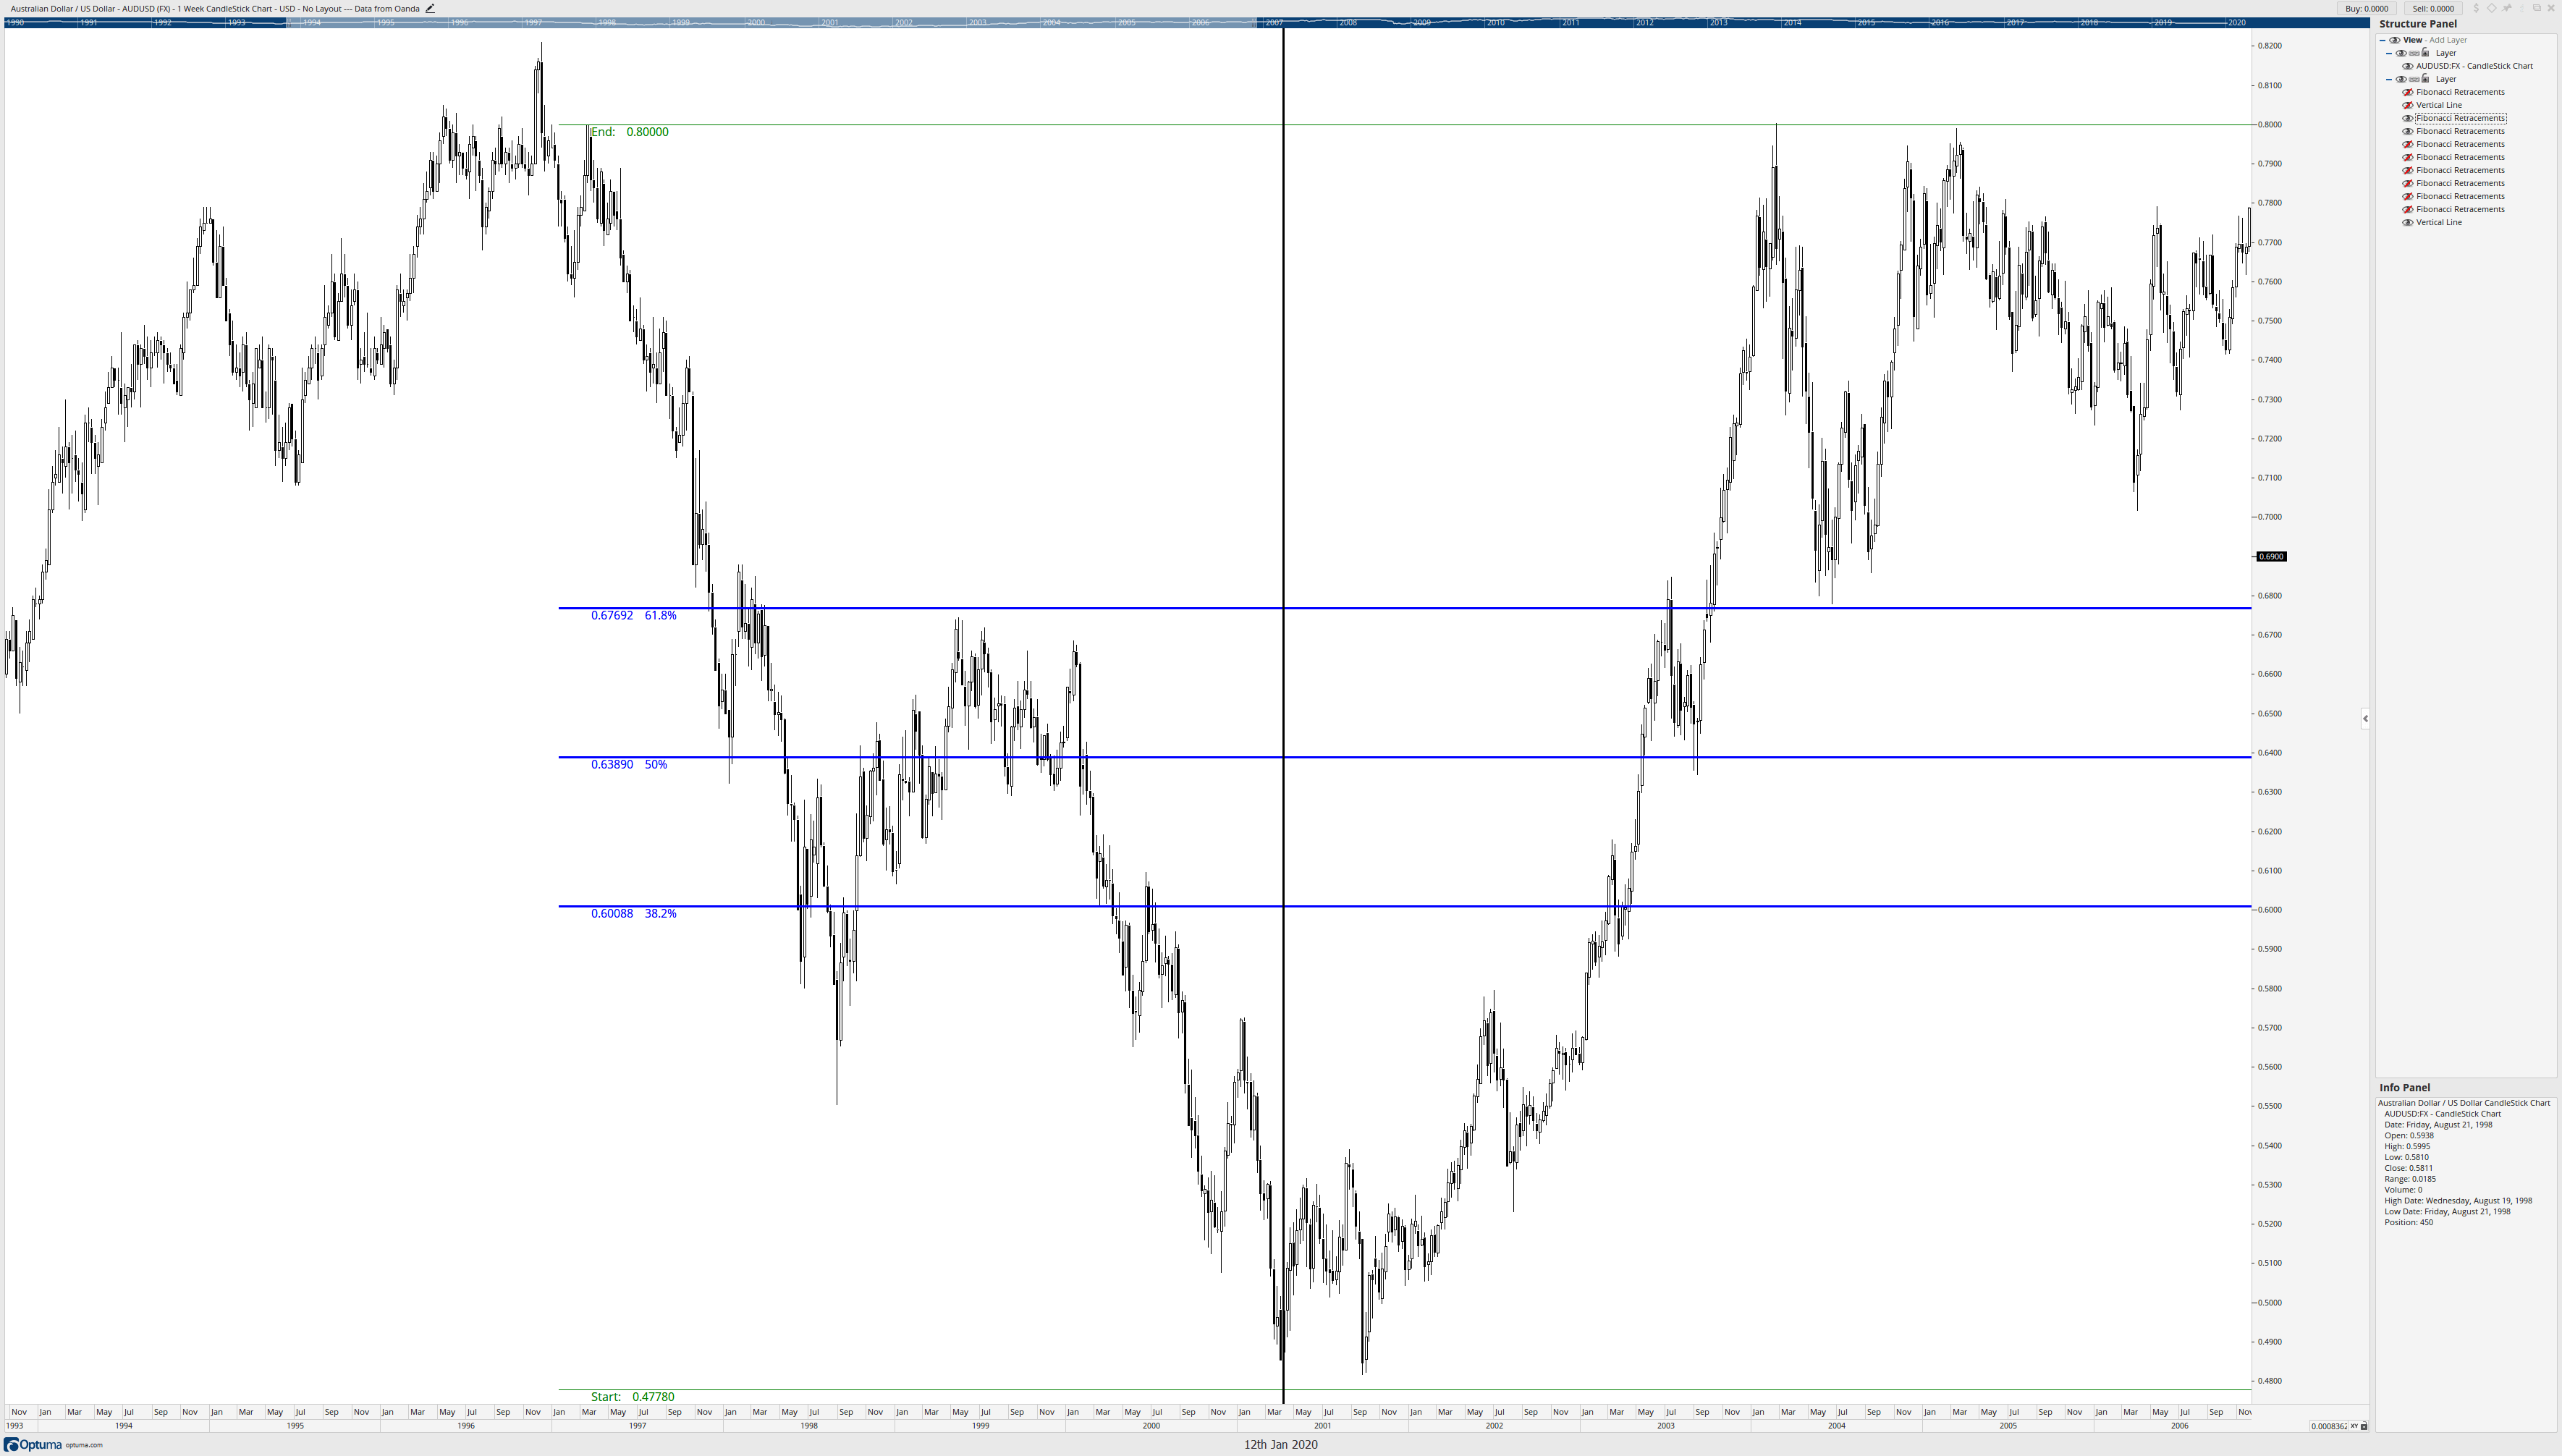
If you have not first read my article, ‘You’re still misusing Fibonacci retracements,’ please do so before reading this article. This article will continue where we left off in discussing the new and improved way of drawing accurate and efficient Fibonacci retracements using the Brown Method. I am going to use the same Forex pair that we used in the first article. The purpose of this article is to show you how you can create Fibonacci Confluence Zones to create natural price levels that act as future support and resistance. First, I am going to start my first swing using the March 2001 low and then retracing back to the confirmation swing high in March 1997. See below.

Fibonacci Retracement from low to confirmation lower swing high.

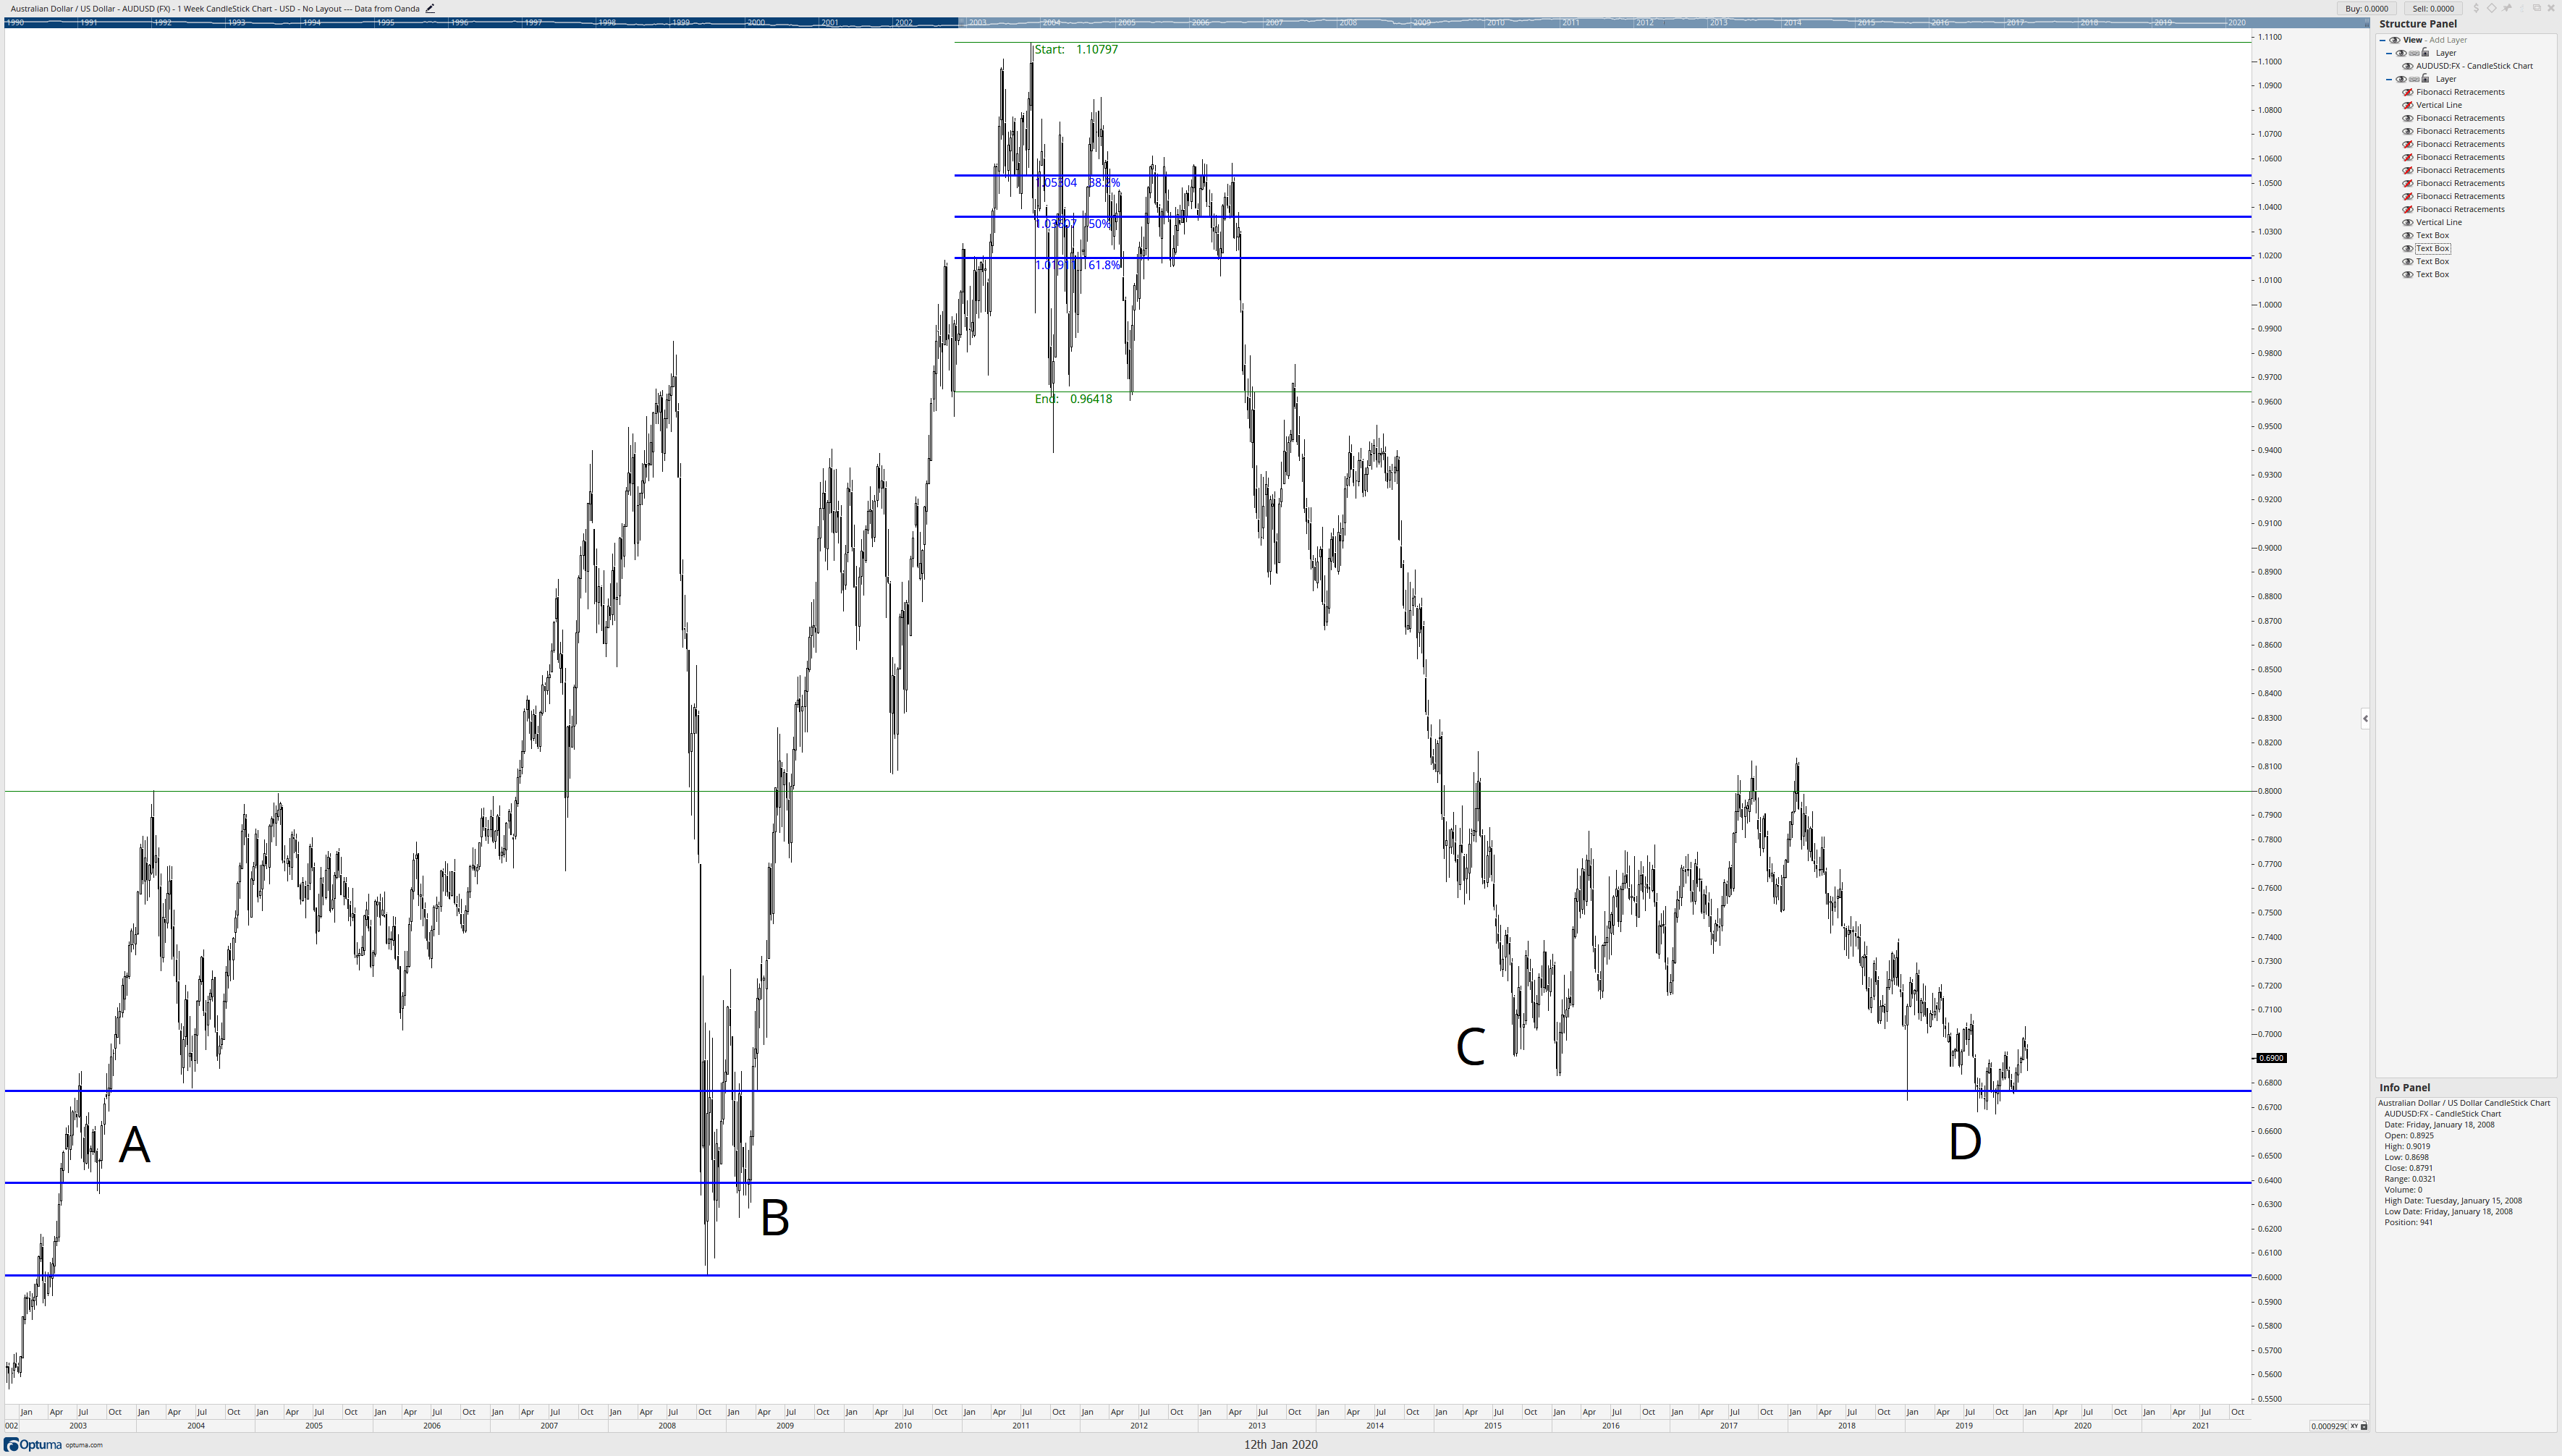
First, I want to know if this retracement is appropriate given how much time has passed – we’re 23 years from the March 1997 high and 19 years from the March 2001 low. Do these Fibonacci retracement levels still work? Do they remain valid? The black vertical line is the start of the retracement, so anything before the retracement is not used, it’s the data afterward that matters. Let’s look.

Fibonacci Retracement - testing of 20 year old retracement range.
Fibonacci Retracement – testing of 20 year old retracement range.

Are these Fibonacci retracement levels we drew still relevant? I would say so. A quick look at A, B, C, and D prove it. Especially for the most recent data at D on the AUDUSD weekly chart – seven-year lows bounce off of the 61.8% Fibonacci retracement level from 20+ years ago! But let’s look at some more Fibonacci retracements made off of other significant swings. Fair warning: there’s going to be several images here.

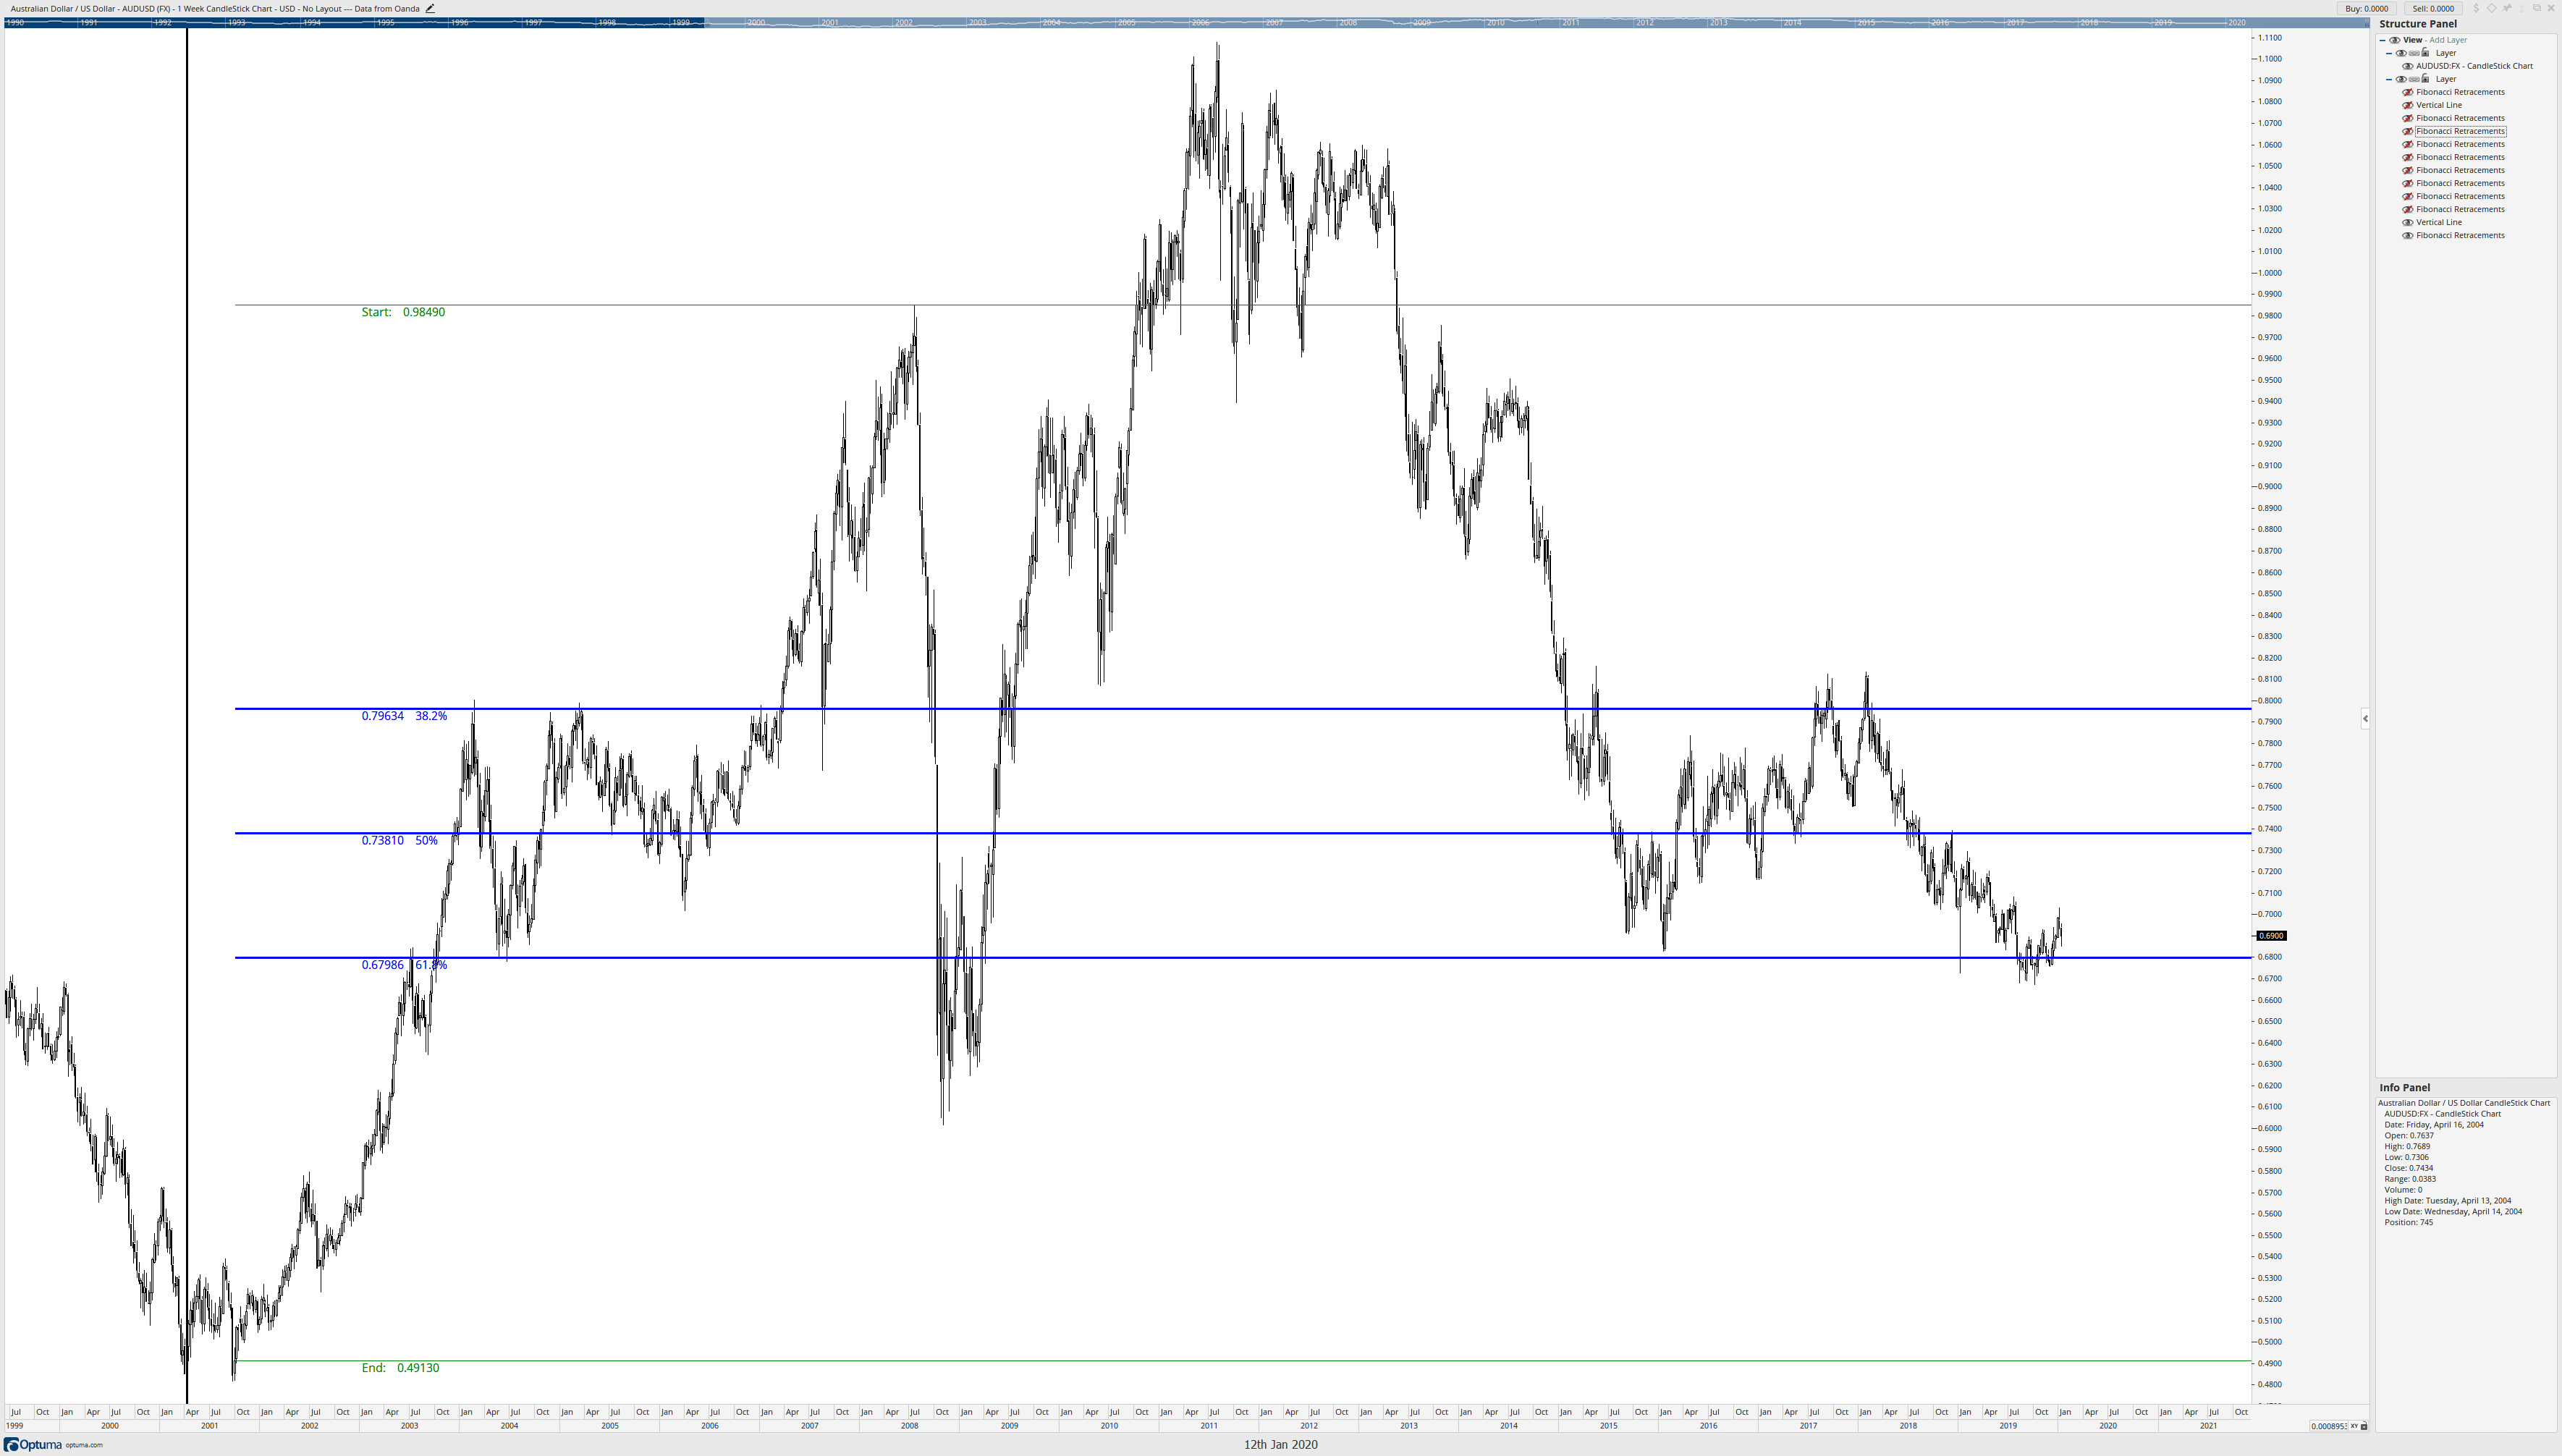
Fibonacci Retracement 2011 to 2008

The Fibonacci retracement above is from the swing high in July 2018 to the confirmation swing low in October 2001. Like the previous Fibonacci image, we can see that prices have respected the retracement levels even a decade after the retracements were established. But we’re not done.

Fibonacci Confluence Zones

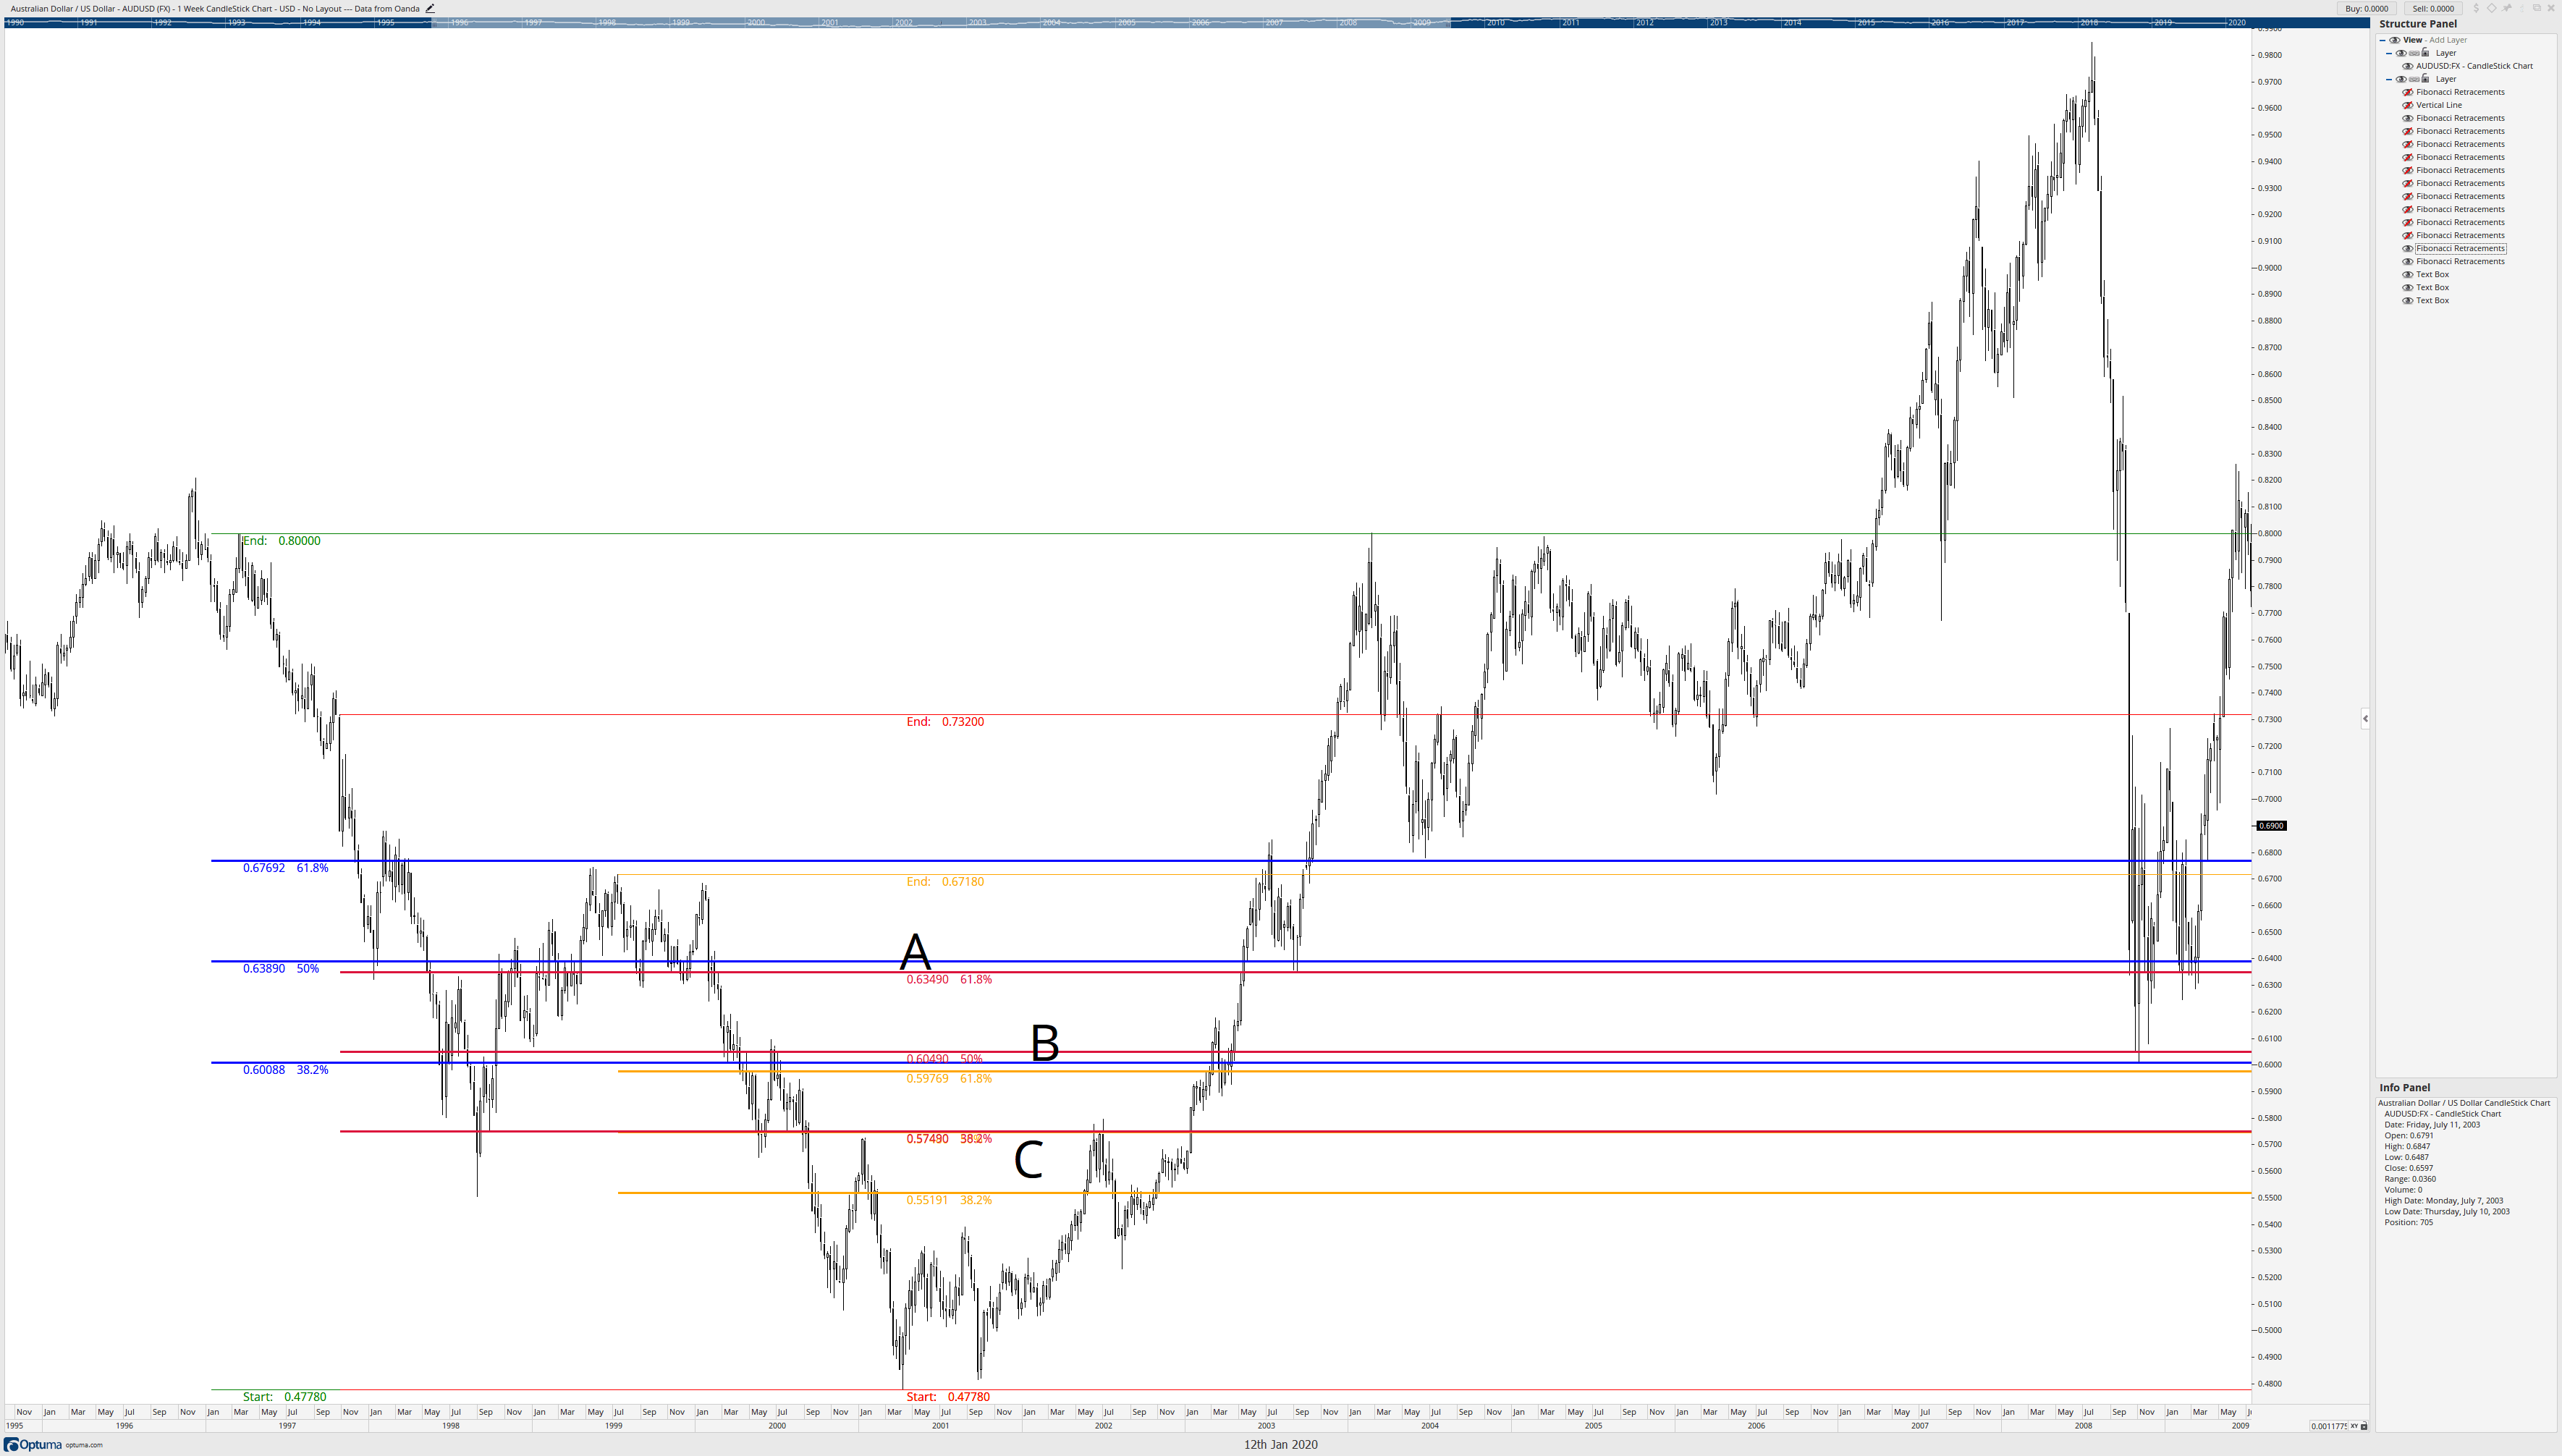
The above image is the first retracement we looked in this article (the same swing low in March 2001) using the same swing low; we draw more retracements to the next confirmation swing lower highs. I’ve drawn two additional Fibonacci retracements in Red and Orange. Notice how some of the Fibonacci retracements occur within proximity of one another. Letter A is shared retracement zones of the 50% and 61.8% of two different retracements. B has a confluence zone of three Fibonacci retracement levels, 50%, 61.8%, and 38.2%. And C has two overlapping retracements of 50% and 38.2%. Now let’s get to the fun part.

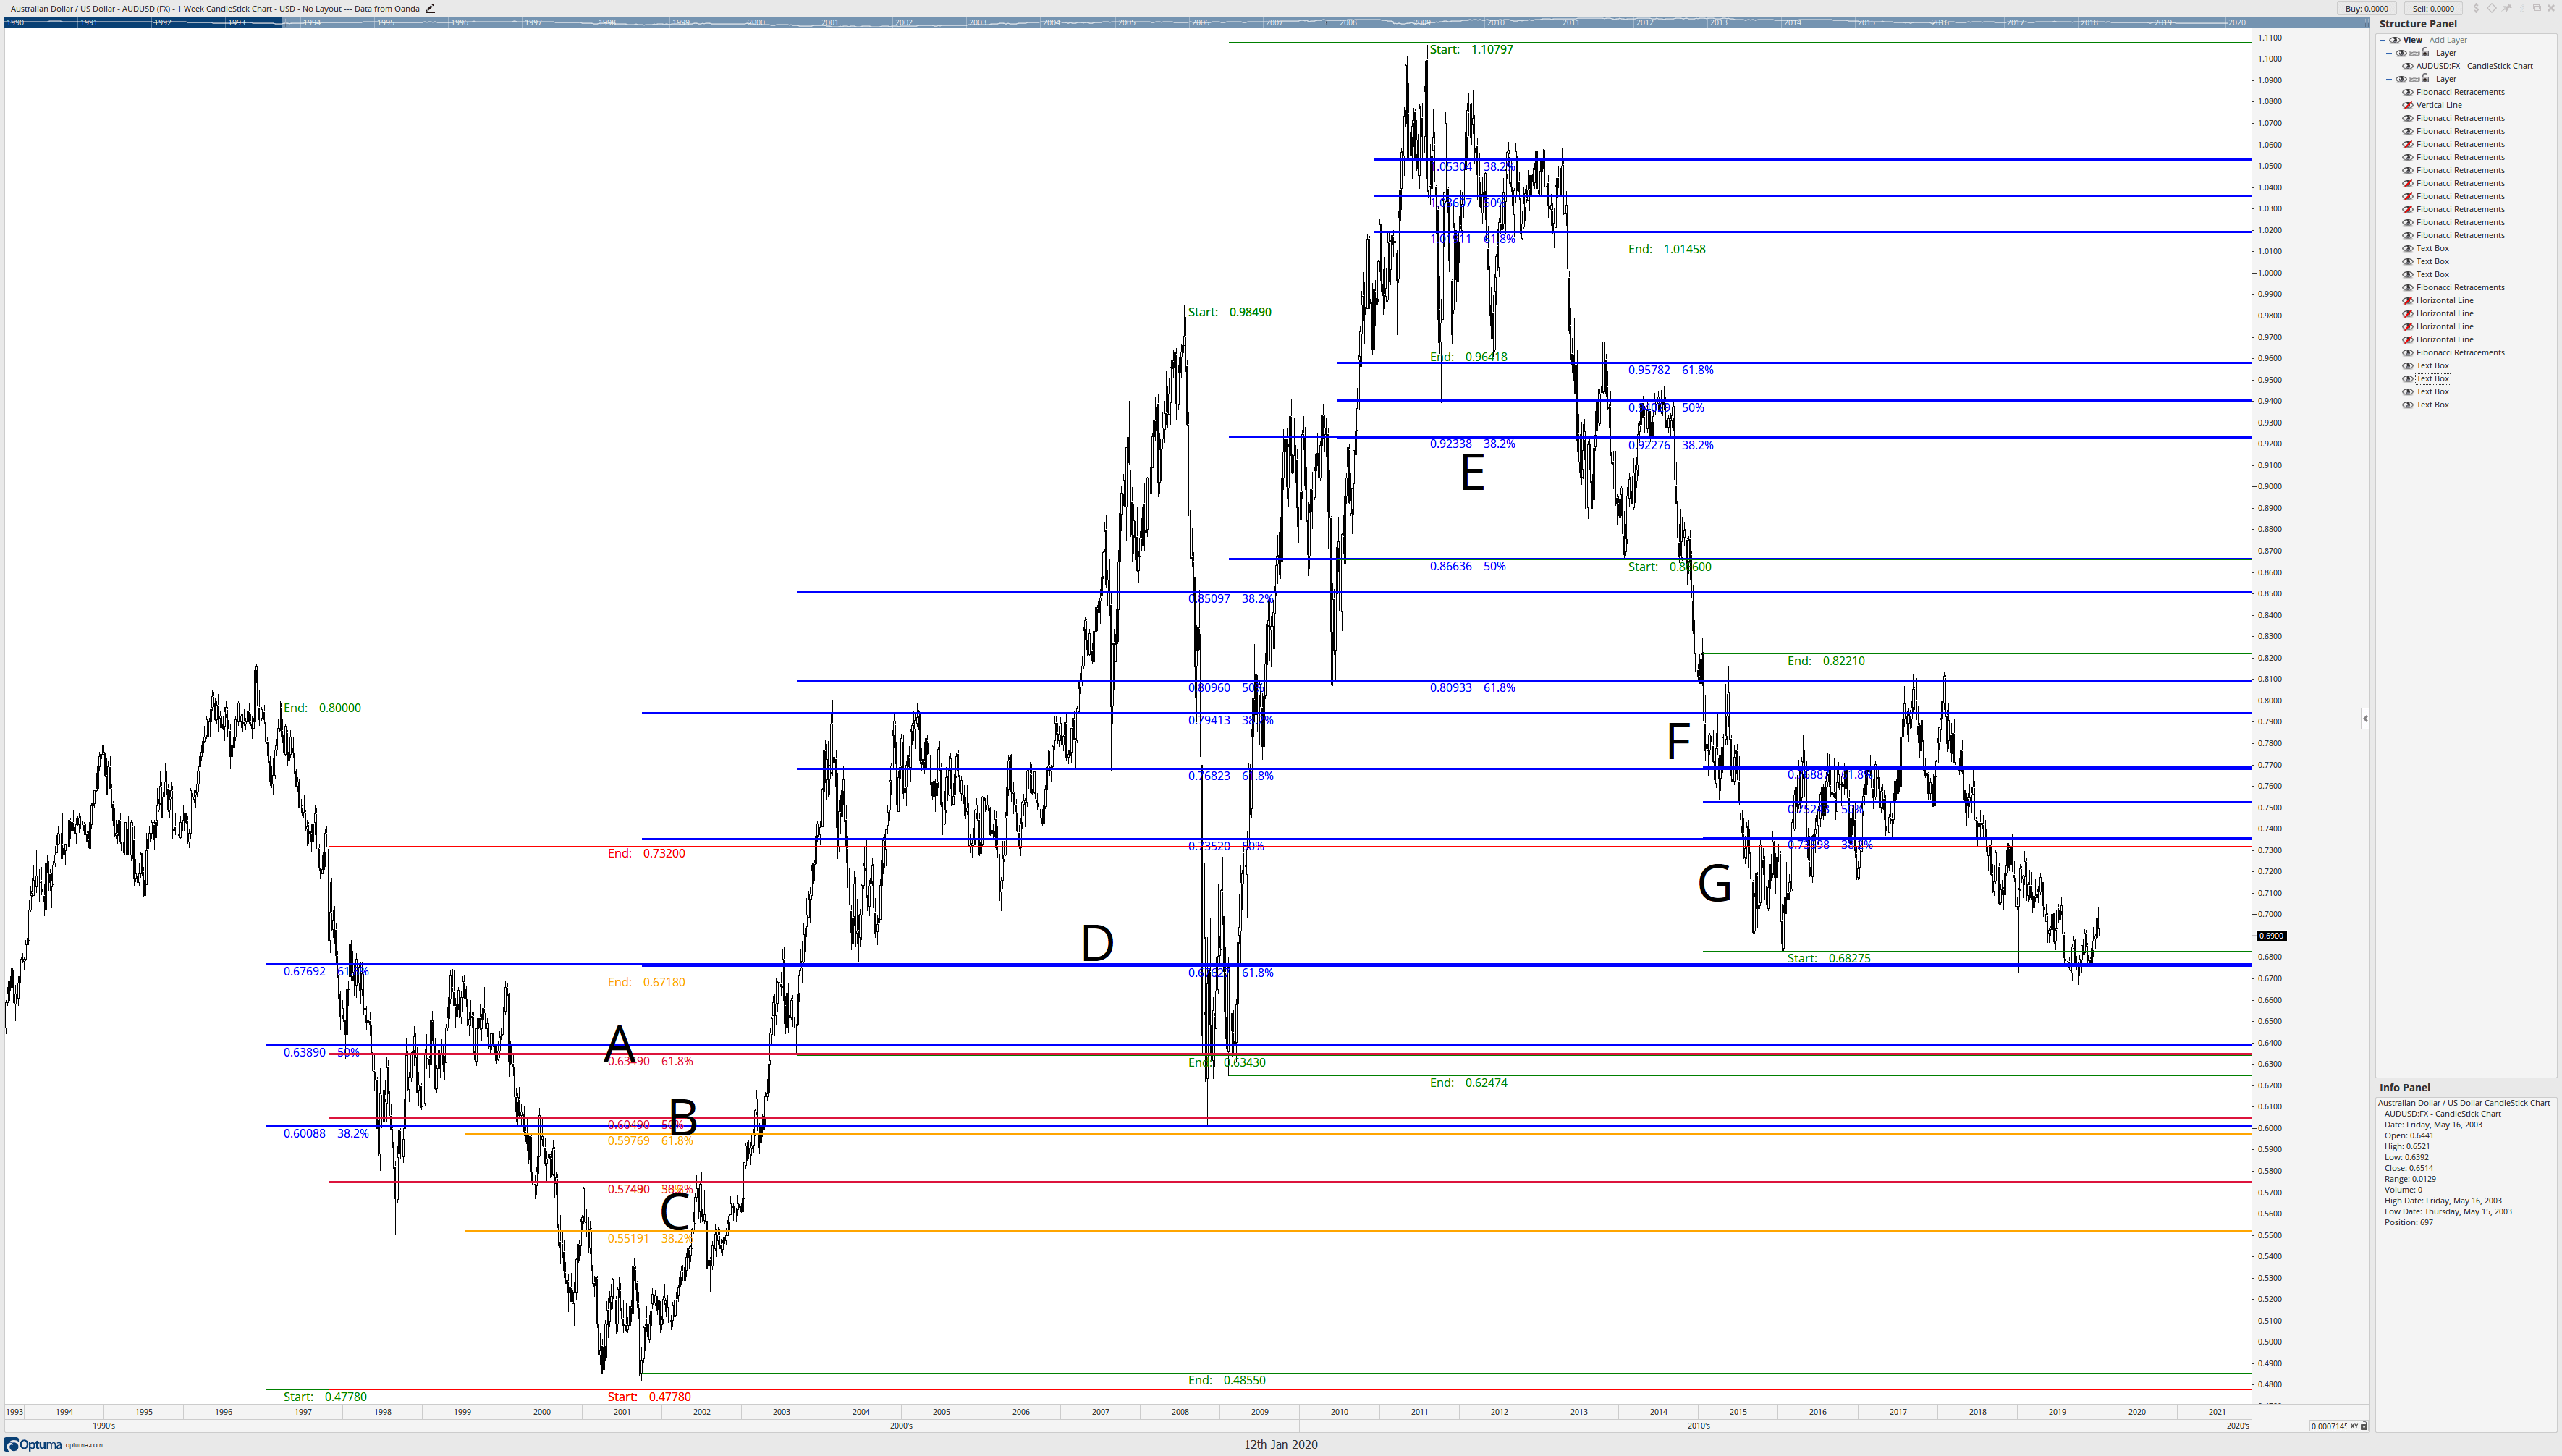
The previous image showed three Fibonacci retracement confluence zones at A, B, and C. Those confluence zones were just three of many that will appear on any chart on any time frame. What happens if we draw a series of retracements using major swings as the start point of the Fibonacci retracements and then retrace to the next confirmation swing highs and lows? We’ll get a chart that looks like the one below.

Full Confluence Zones

I’ve added some other letters to identify more confluence zones. I admit the chart does look like a mess. And it should. Not every Fibonacci retracement to a new confirmation swing high or low will coincide with shared Fibonacci levels, but they frequently do. Once we’ve drawn out a series of retracements, we should see a set of these confluence zones. Now begins the cleanup phase. We’re going to place horizontal lines where there are confluence zones of Fibonacci retracement levels.

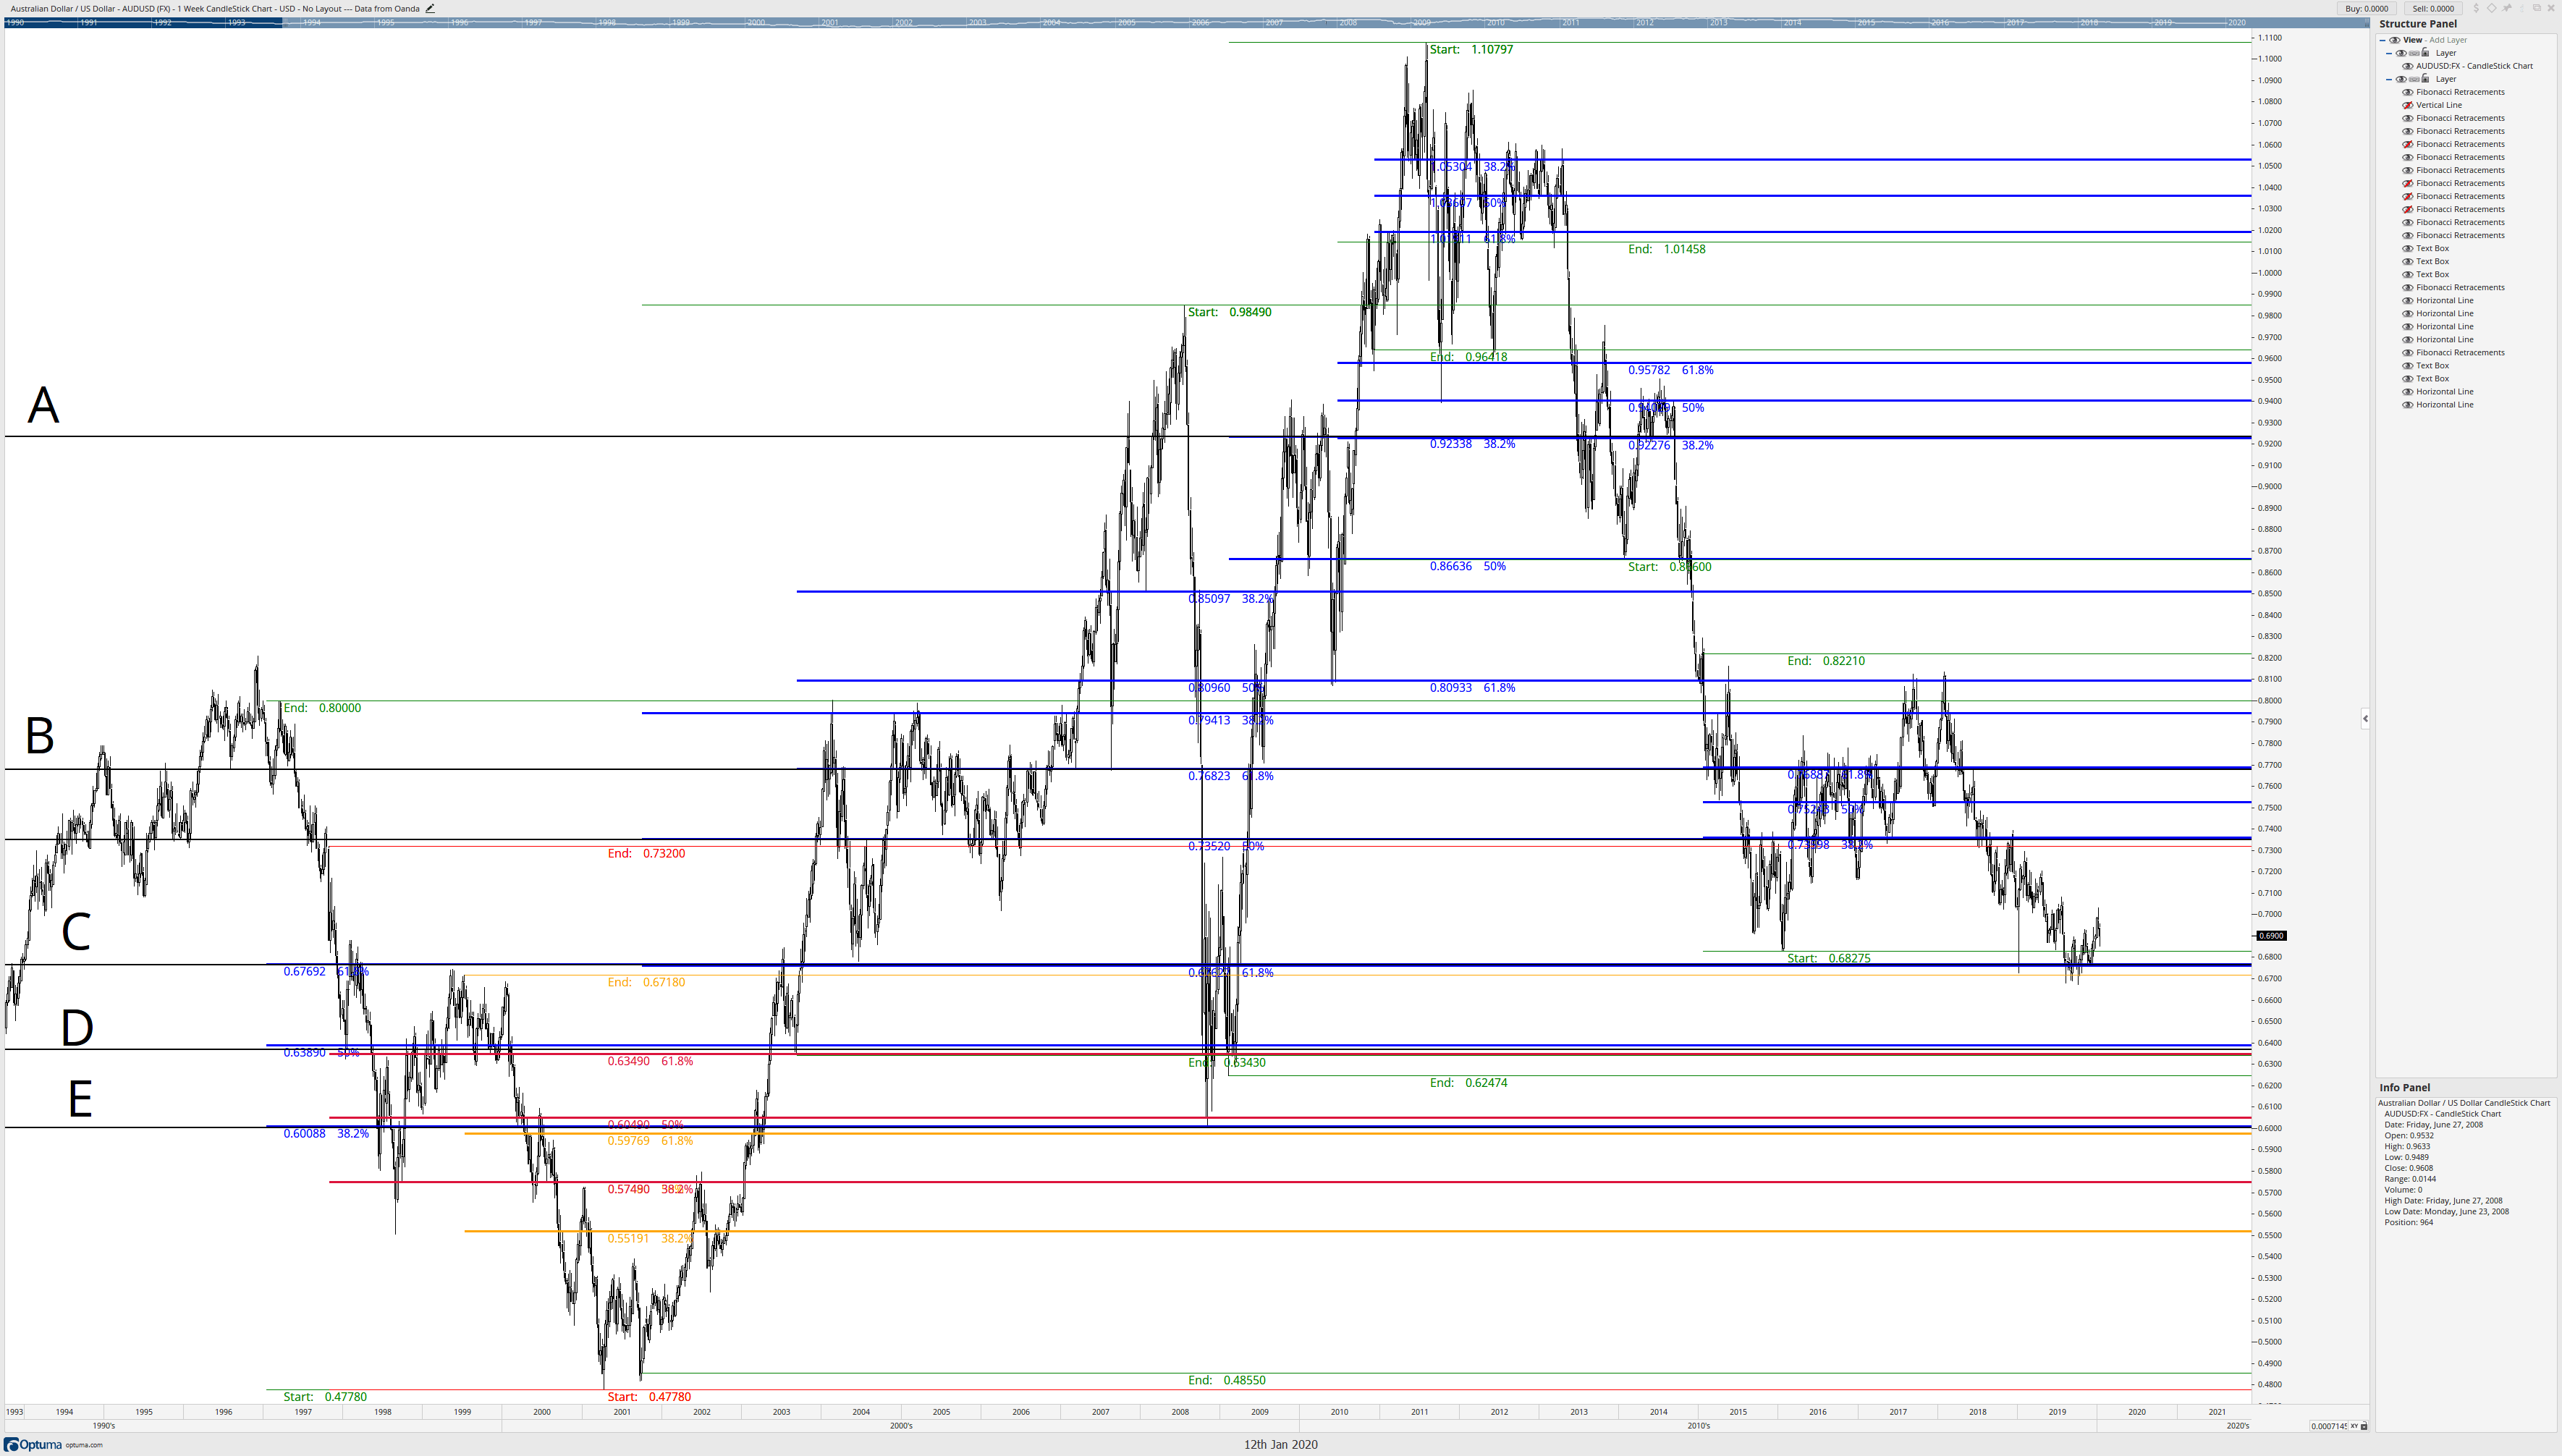
Horizontal Lines replace confluence zones.

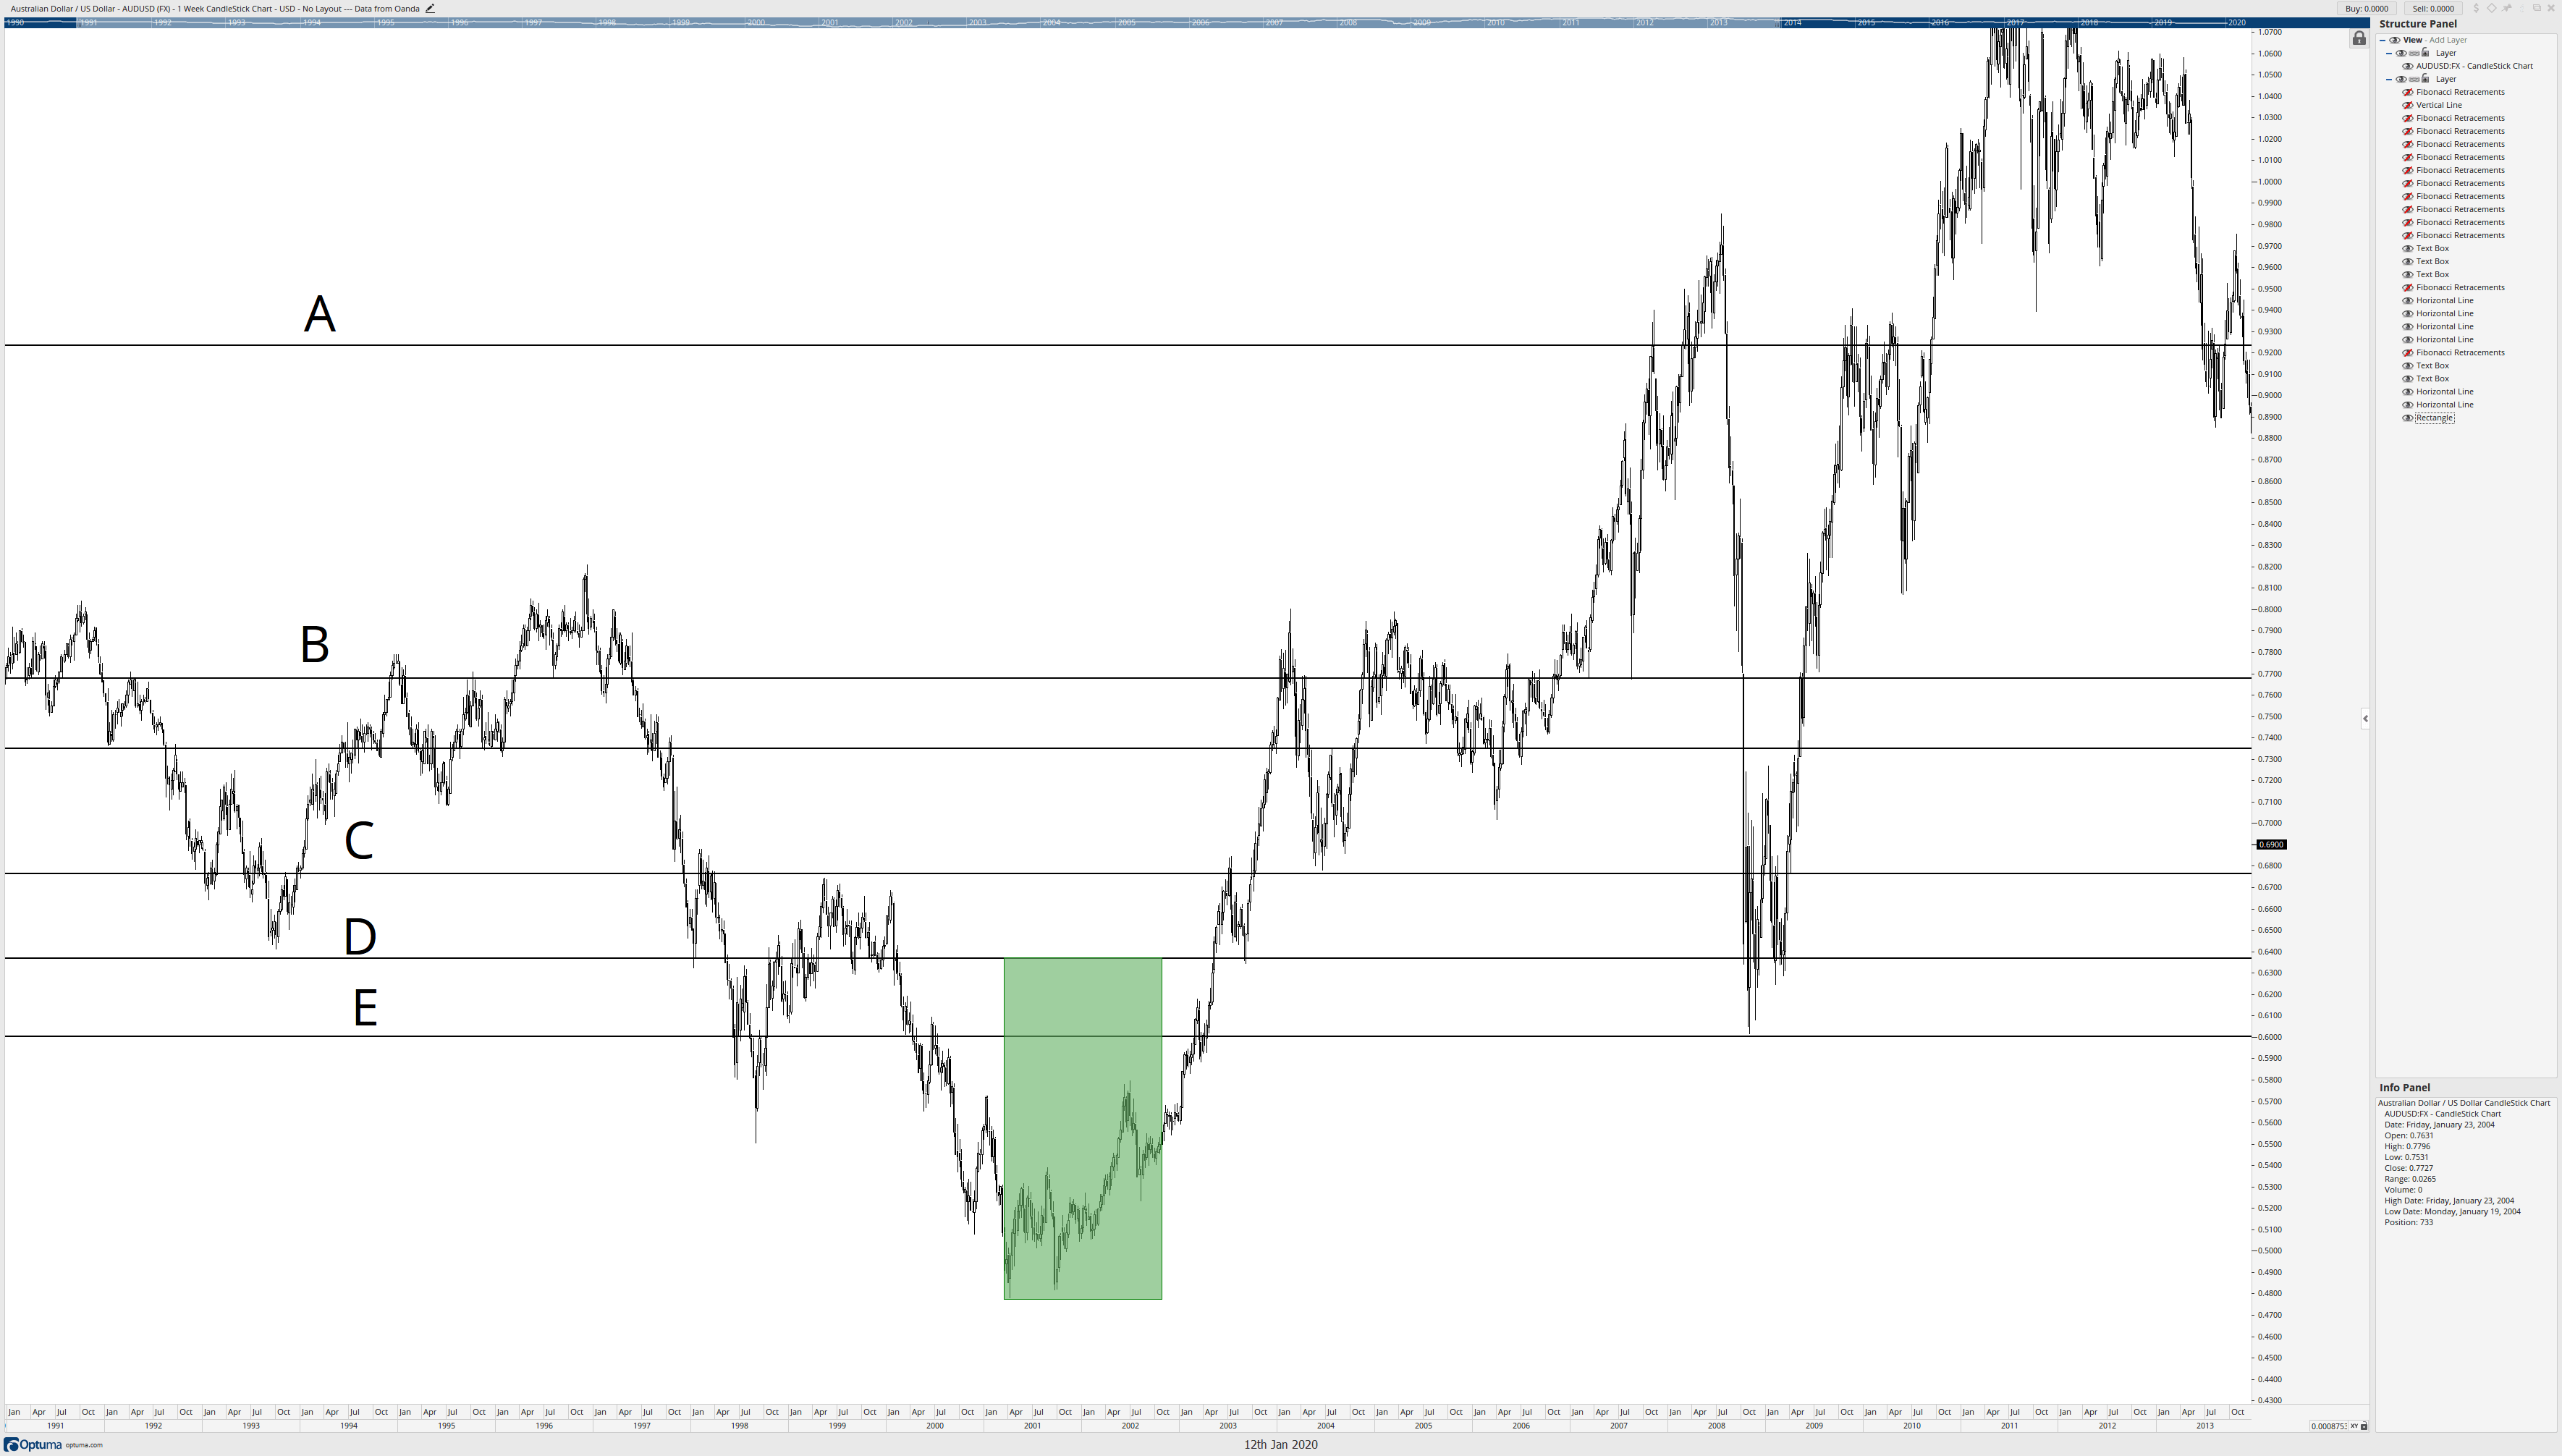
The letters A, B, C, D, and E show where the Fibonacci confluence zones have formed, and are represented by horizontal lines (black) on the chart. Now, you can either delete or hide all of the Fibonacci retracements so that we are left with only the horizontal lines at A, B, C, D, and E.

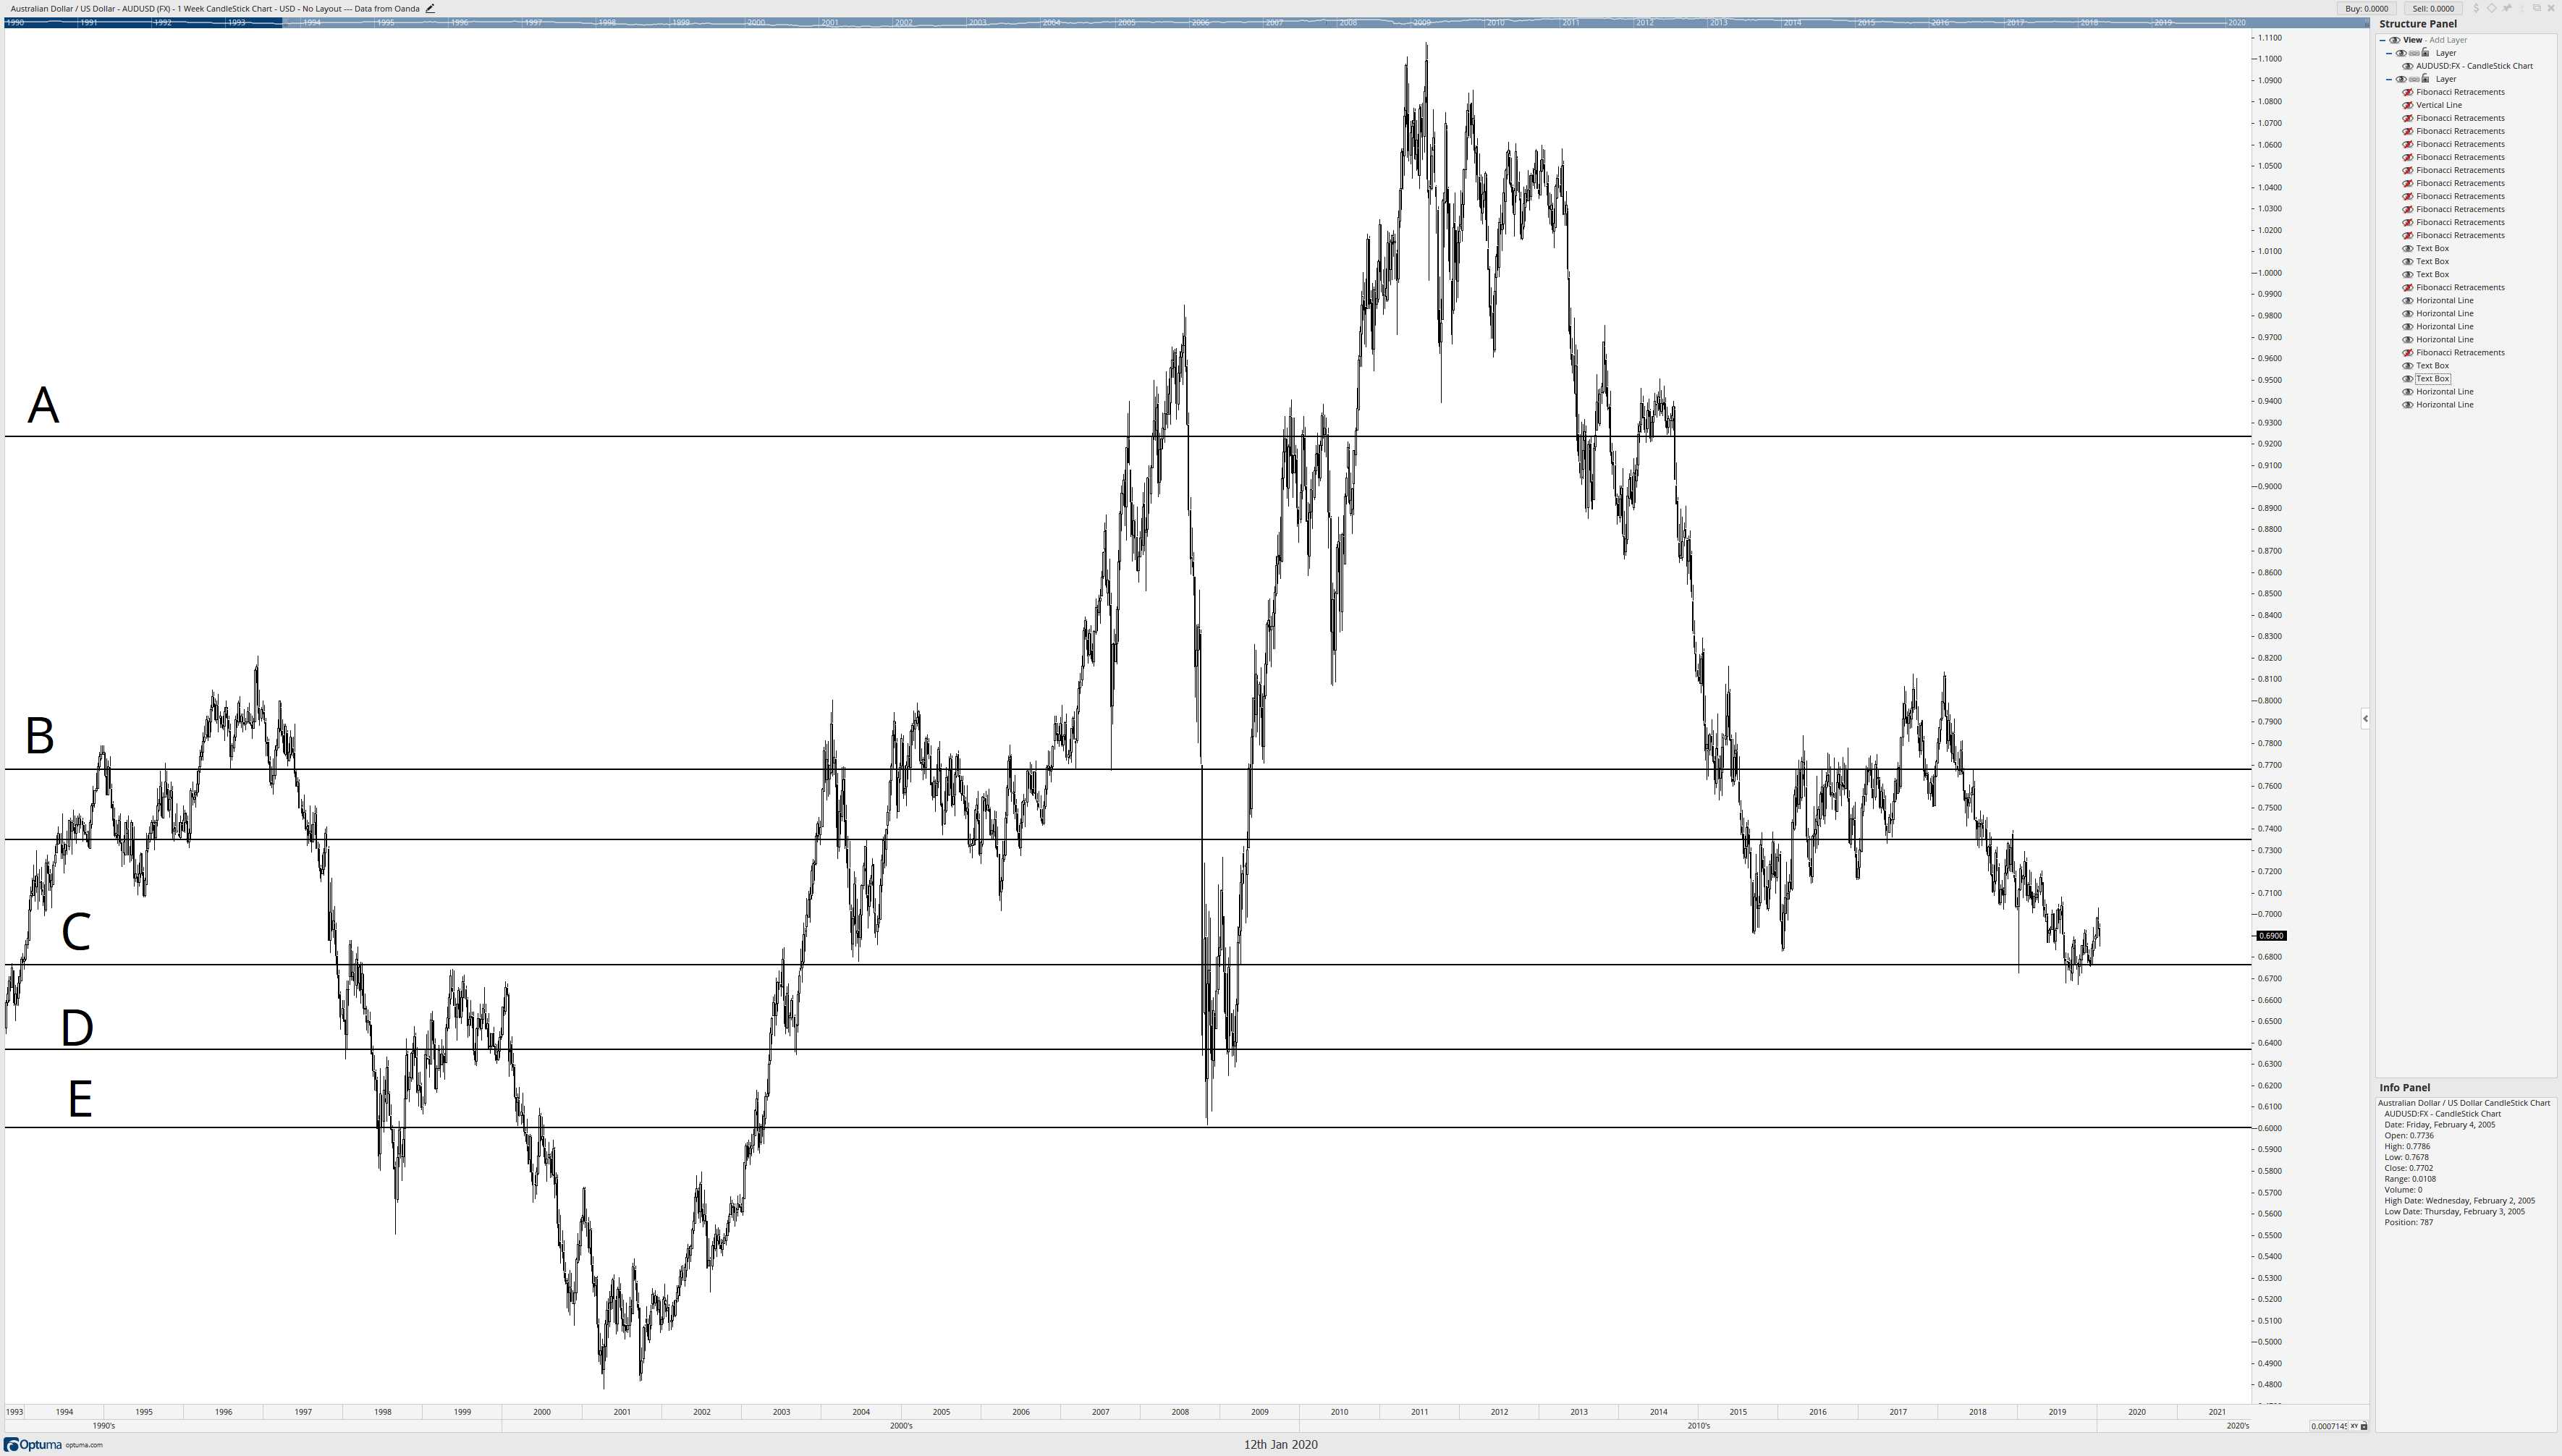
Just the horizontal lines

I know that the horizontal line at D represented the most confluence zones on the AUDUSD weekly chart, but it also represented some of the longest-lasting and respected Fibonacci retracement levels. Starting at the horizontal level at D, I draw a box from D down to the major low on the AUDUSD chart. Now, the width of this box doesn’t matter – just the range.

First Box
First Box

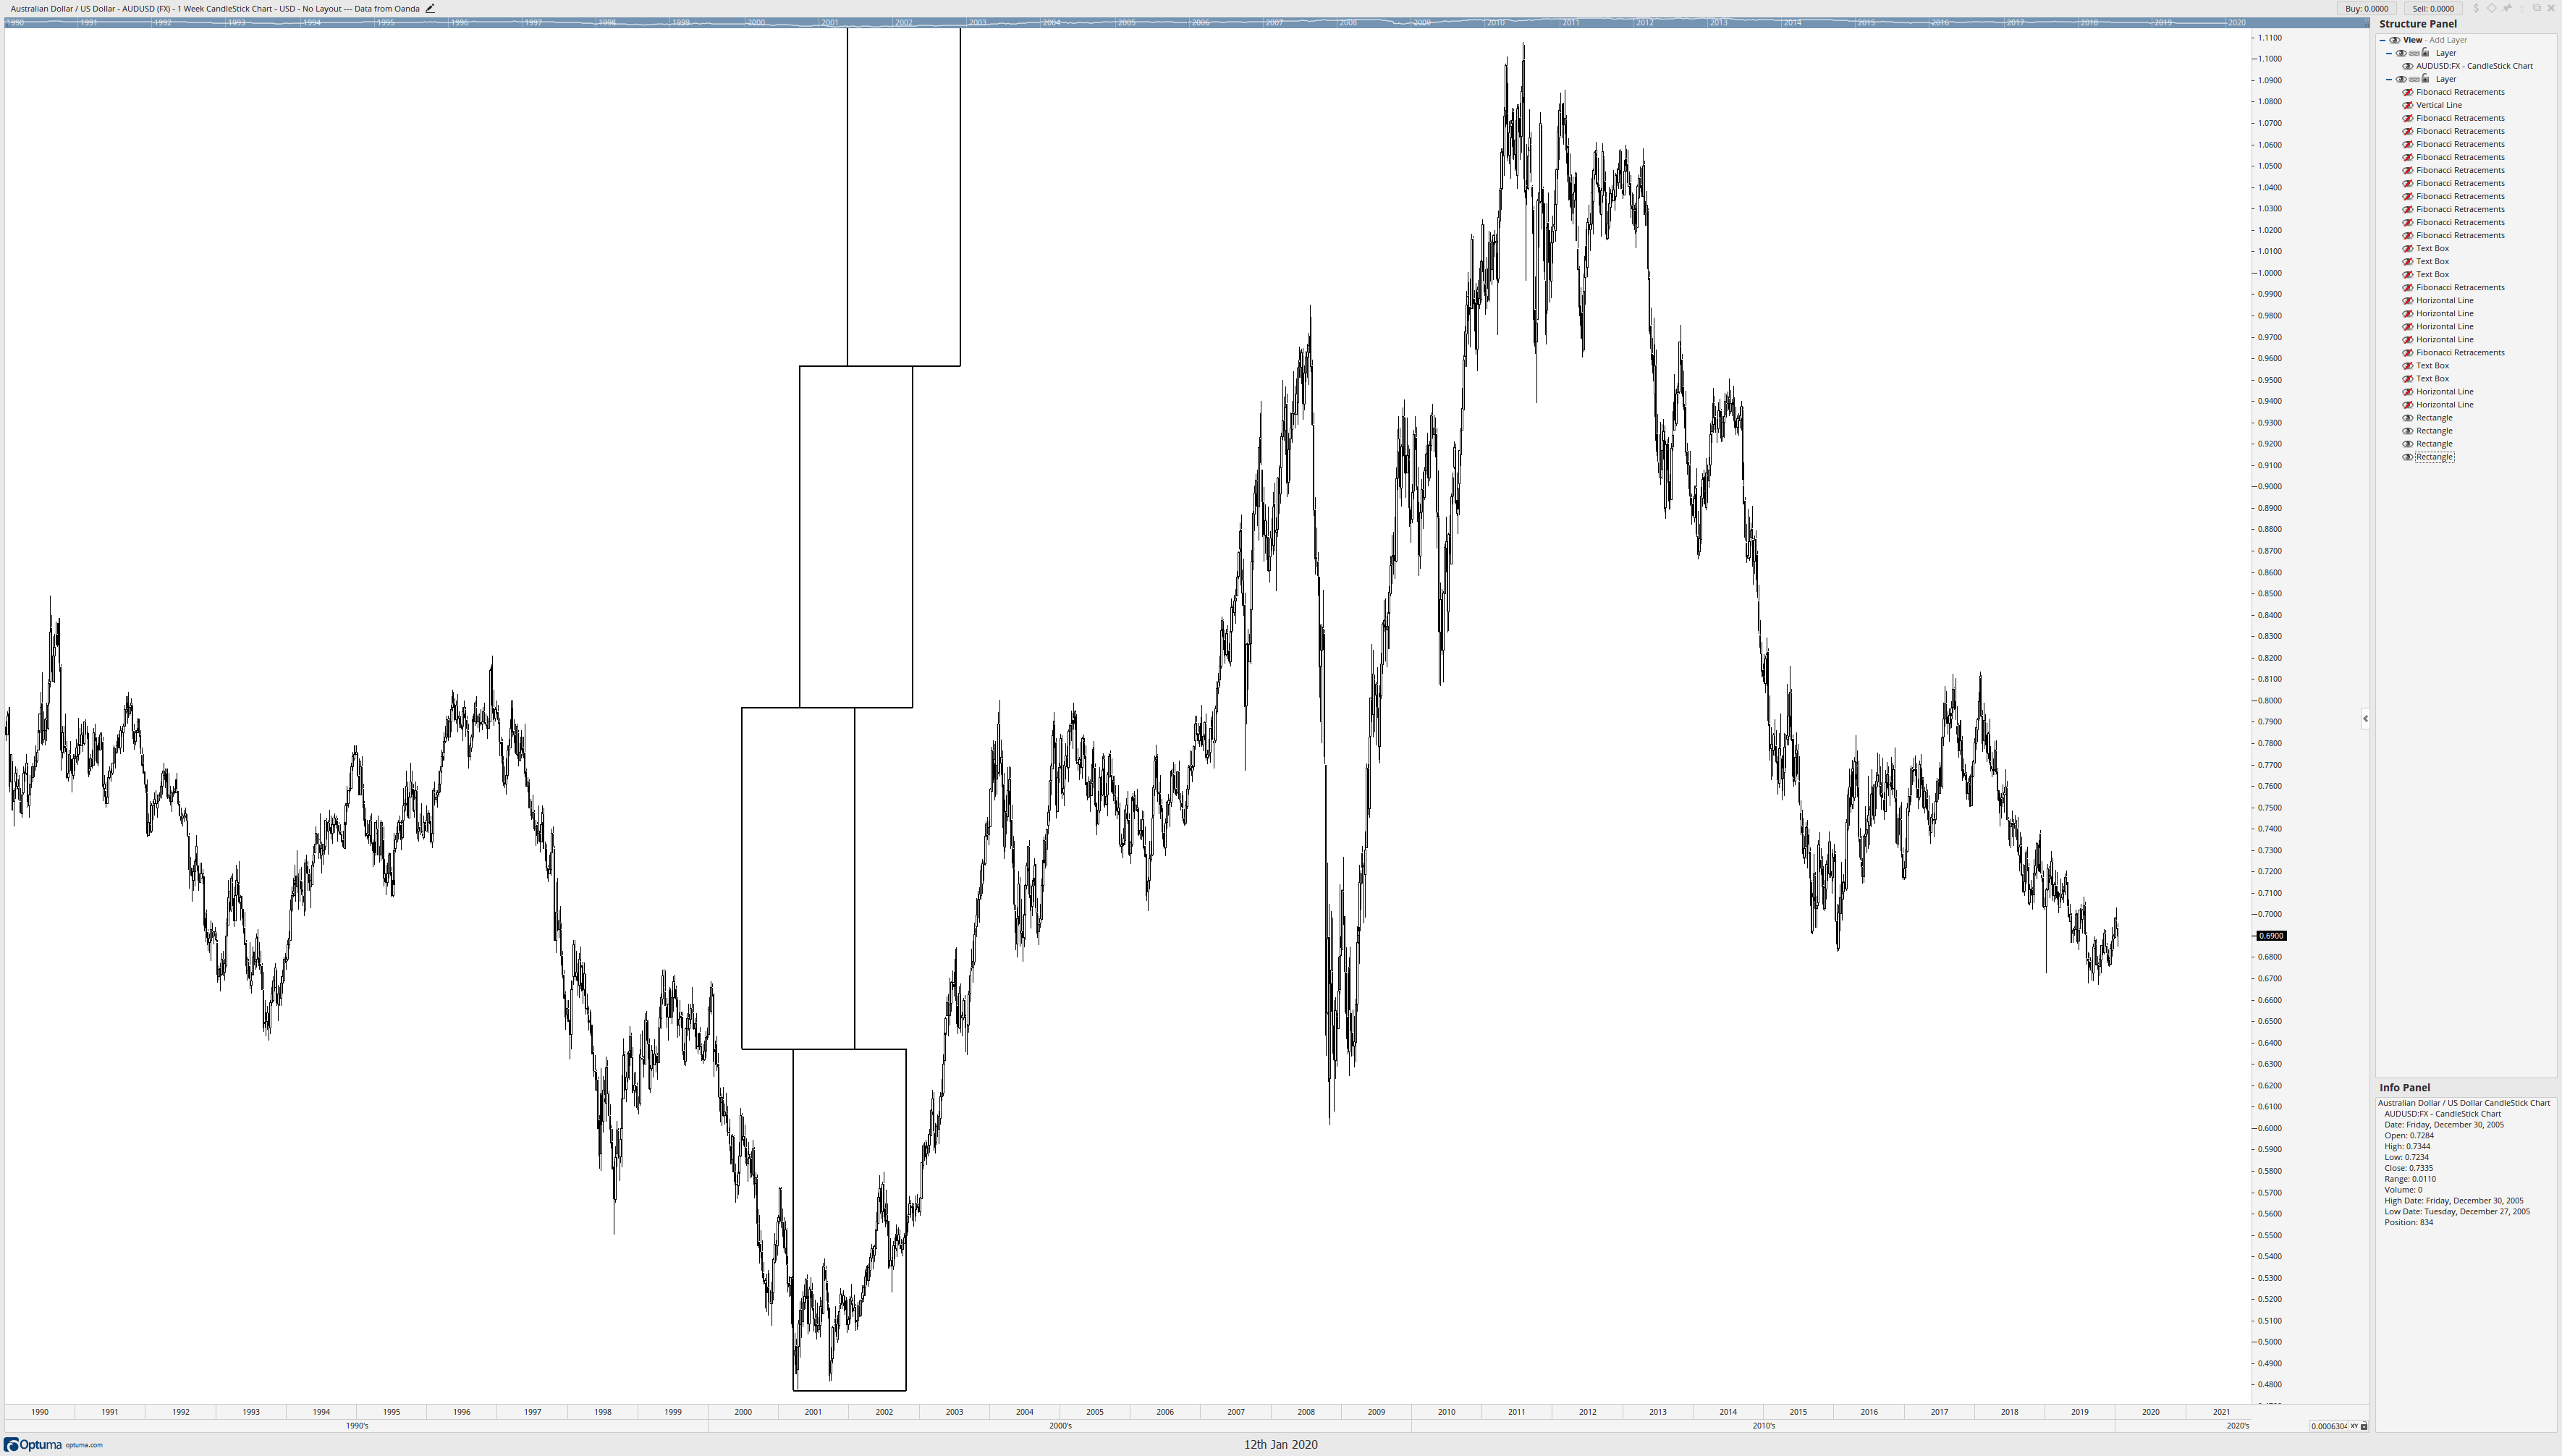
After I’ve established that box from D down to the major low, I can remove the horizontal lines. Then I start to copy the box all the way to the top of the range. All I’m doing here is copying and pasting the box so they ‘stack.’

Stacking Boxes
Stacking Boxes

Now comes the cool part. I’m going to treat each box like its own range and place Fibonacci retracements inside each box, moving from bottom to top.

Fibonacci Retracements drawn inside boxes

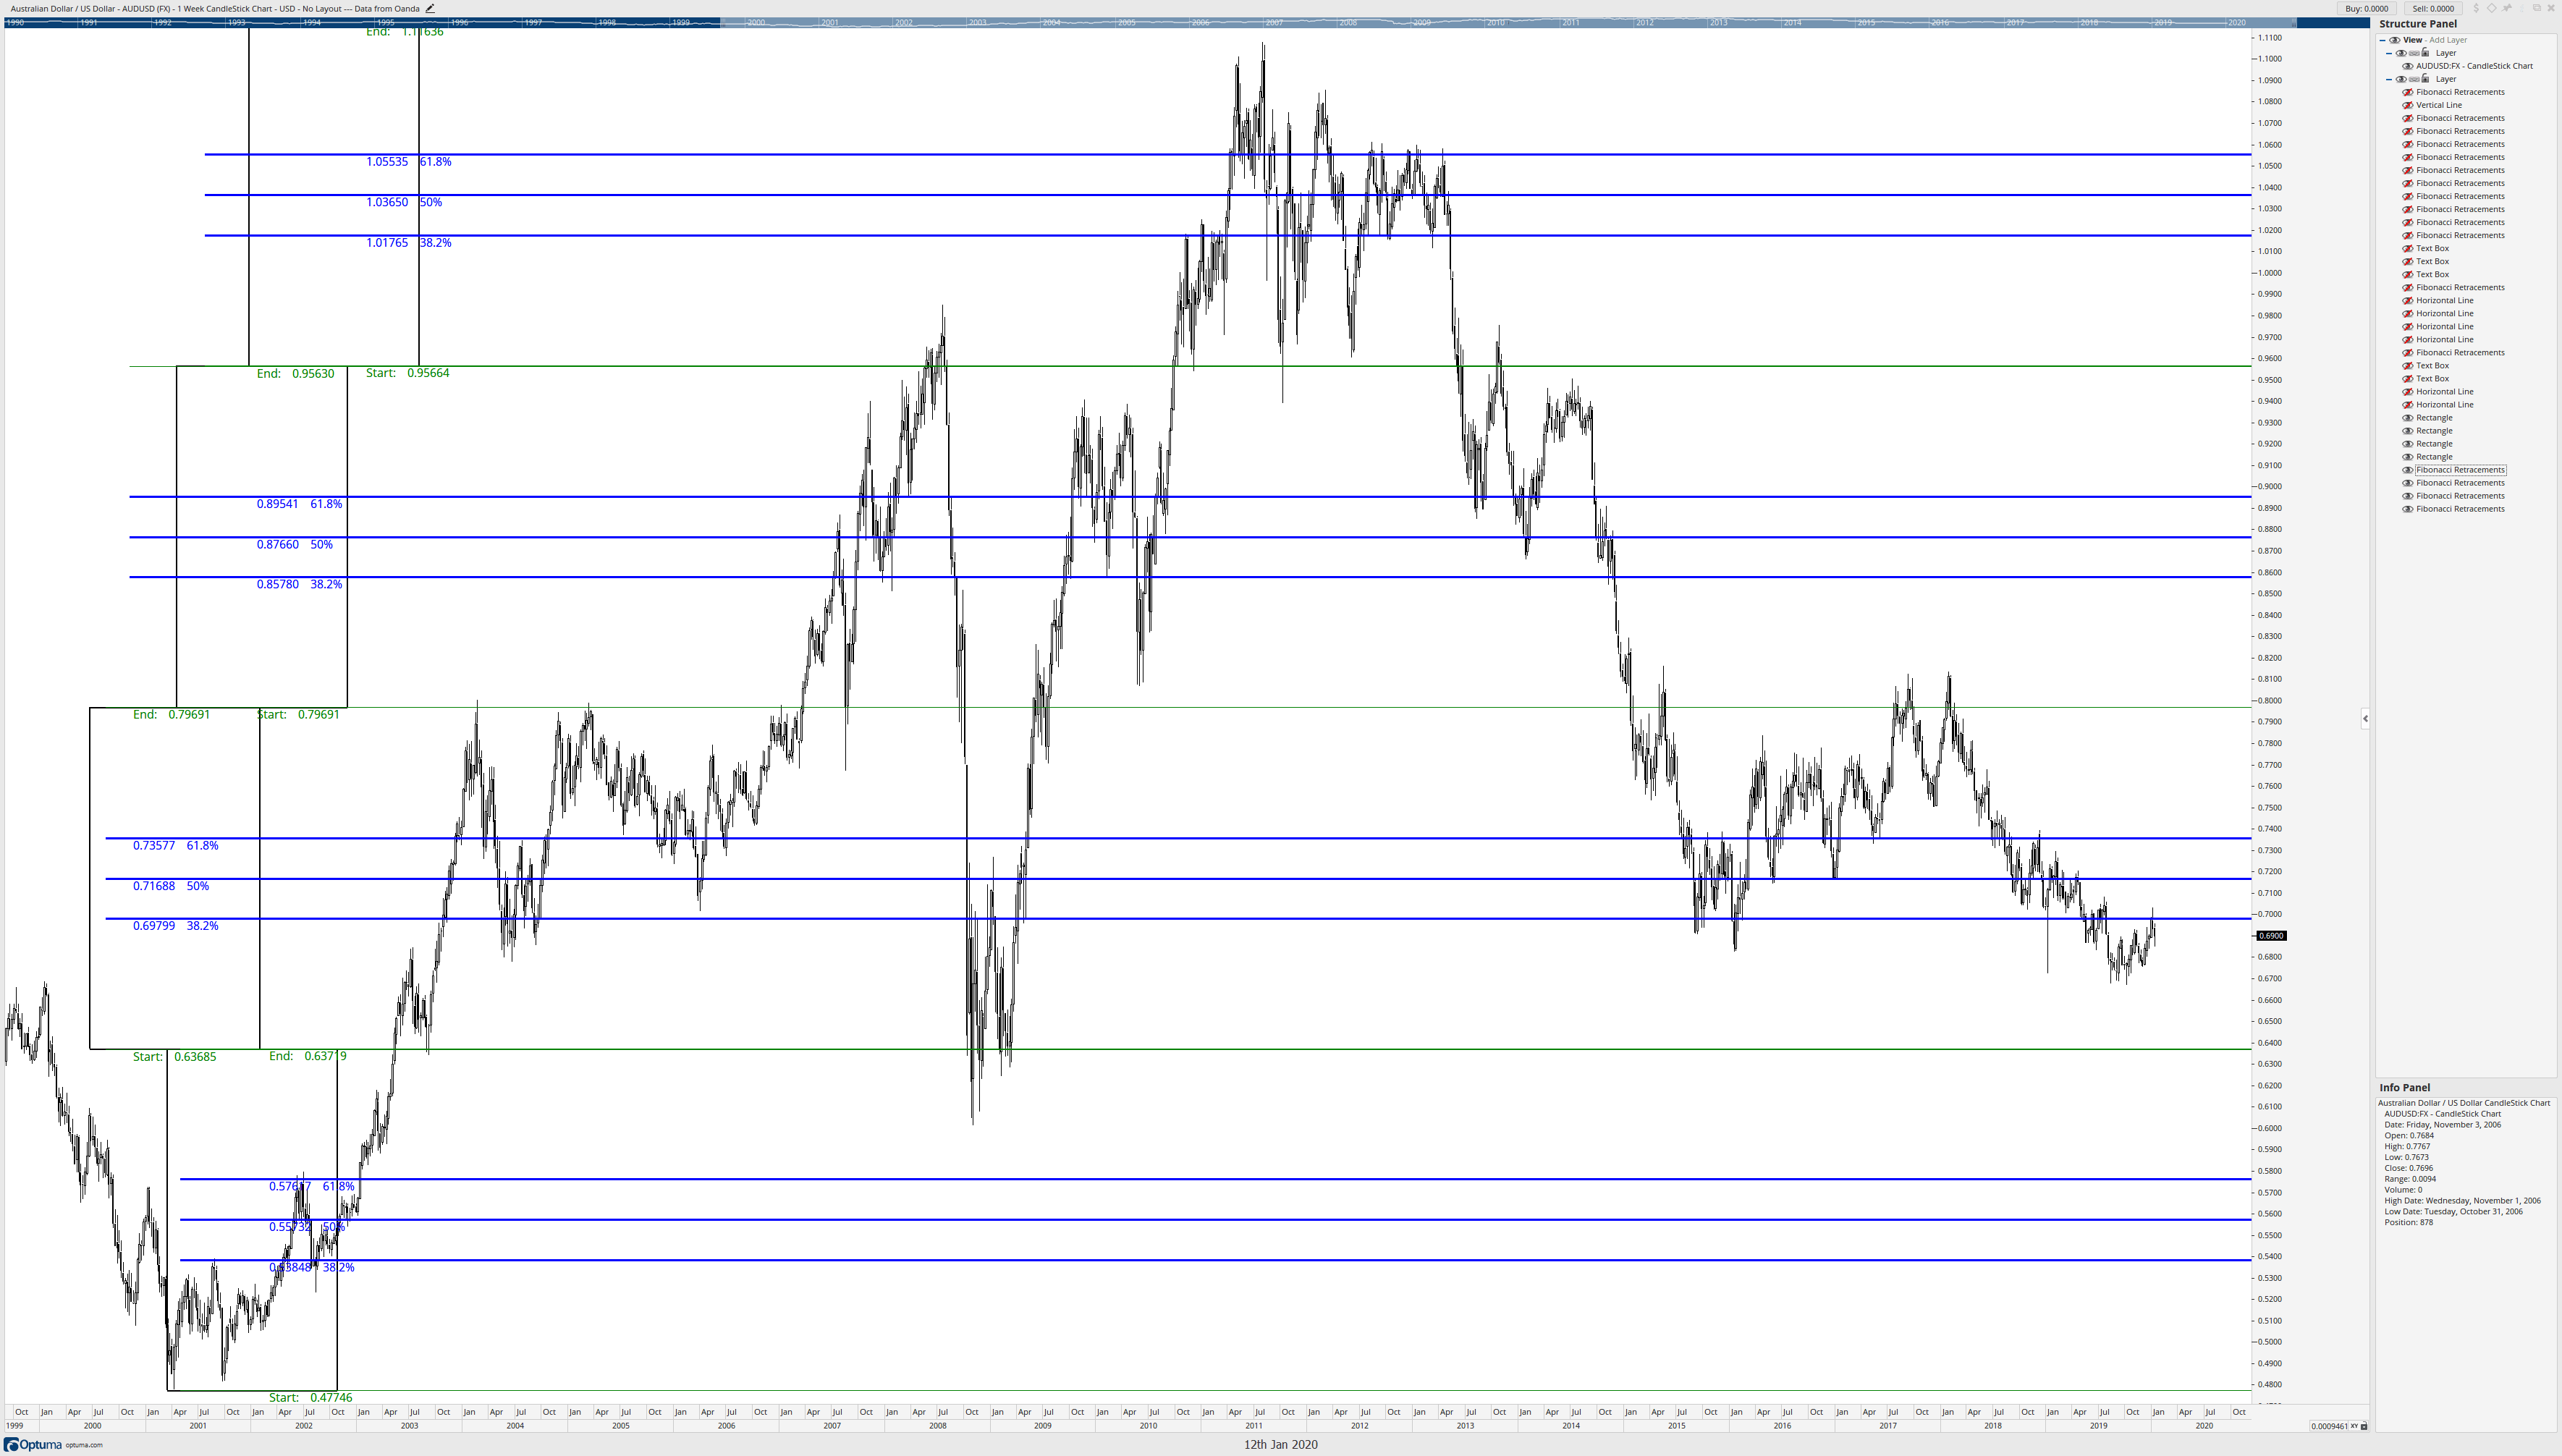
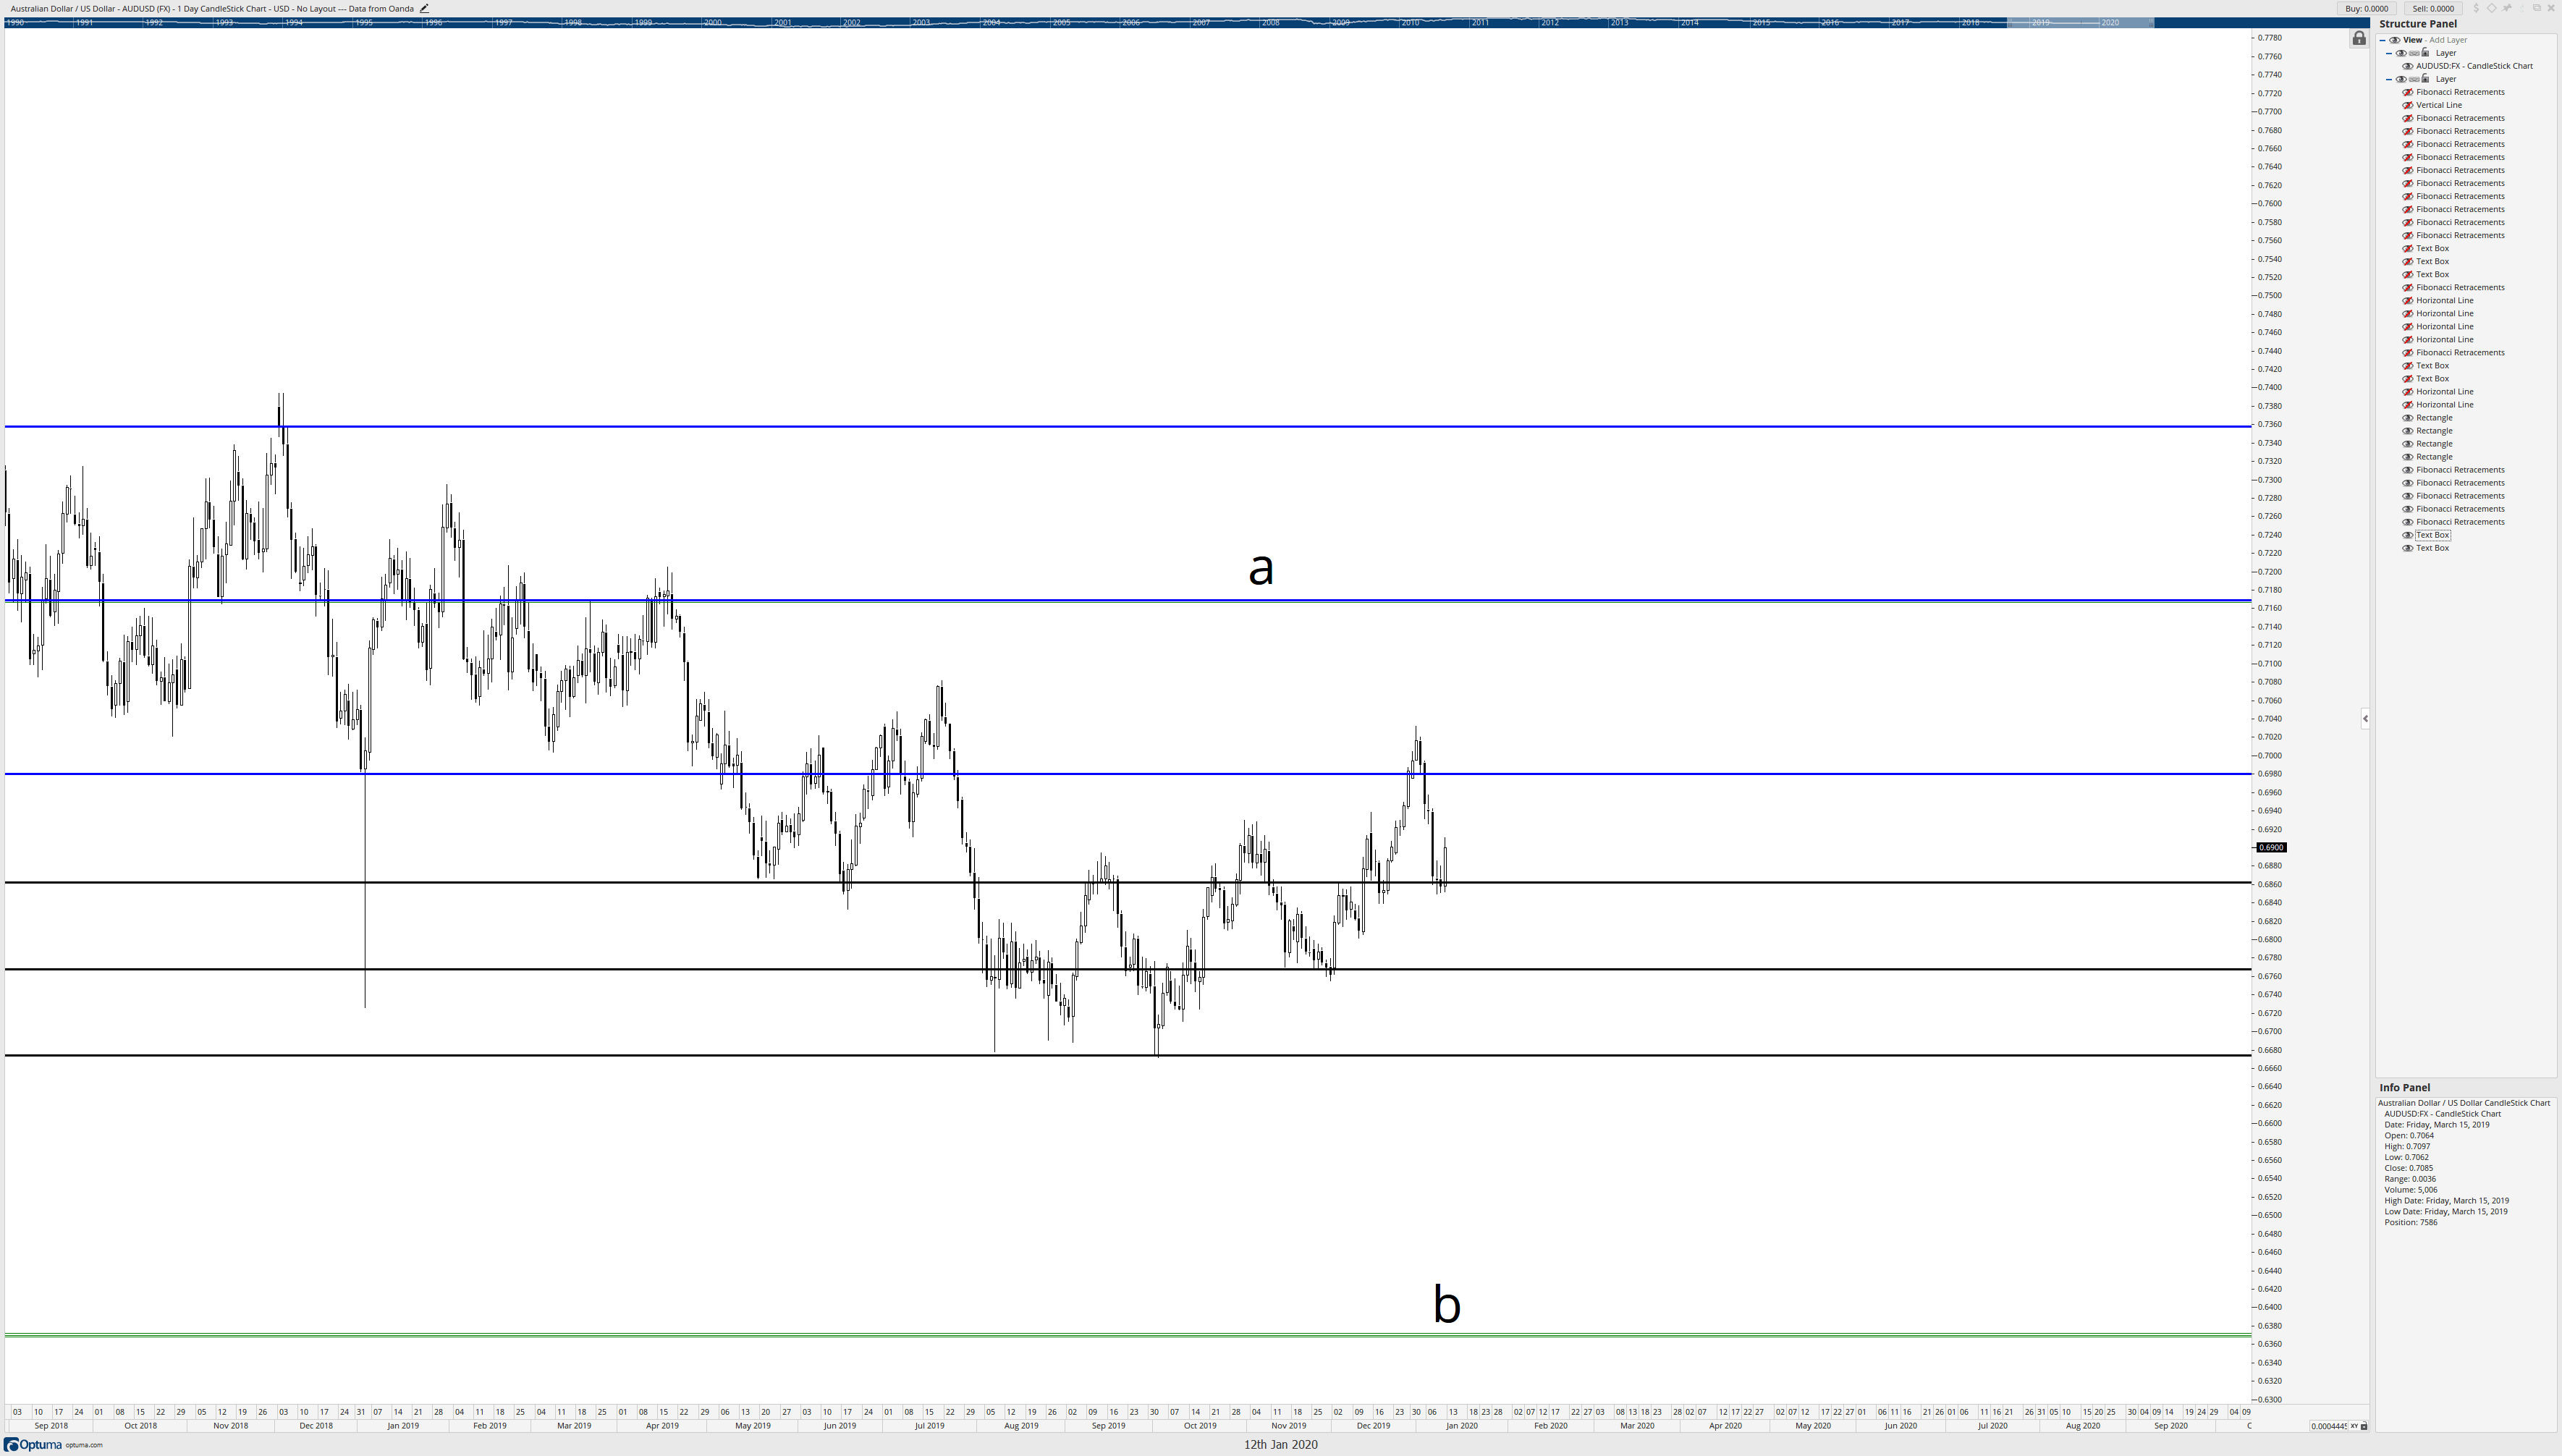
No matter how many times I’ve done this, it still blows my mind. But there is probably a lingering question. You’re probably looking at the chart and saying, ok, cool, but there are some massive gaps between these Fibonacci levels. You are correct if you are thinking about this. Now, Connie Brown never wrote about this next part; it’s something I discovered and developed on my own. The approach comes from the idea that markets are fractalized and proportional, so we should be able to break down like zones into smaller ranges. This is especially important and useful for traders who prefer to trade on faster time frames like four-hour or one-hour charts. Using price action that is more recent and relevant, I can draw a Fibonacci retracement from the 50% level at 0.71688 to the start/end of the box at 0.6368.

Intra Fibonacci level retracements

Letters a and b on the chart above identify the 50% Fibonacci level and start/end level described in the prior paragraph. The black horizontal lines represent the Fibonacci retracement drawn from a to b. I’ve also switched the chart from a weekly chart to a daily chart. When we see that daily chart, we get a real idea of how powerful the Brown Method of Fibonacci analysis is and how precise the study of these confluence zones can be.

In summary, to utilize the Brown Method, the followings steps are as follows:

  1. Create Fibonacci retracements by using a major swing high/low and drawing to the confirmation swing with a strong bar – not the next extreme high/low.
  2. After identifying Fibonacci confluence zones, place horizontal lines on the major price levels where multiple Fibonacci levels share the same price range.
  3. Delete or hide the Fibonacci levels so that only the horizontal lines are present – make sure you identify which horizontal line had the most powerful collection of Fibonacci levels.
  4. After identifying which horizontal line was the most potent and relevant, determine if it is closer to the all-time high or all-time low. Draw a box or a price range from that horizontal line to the all-time high or low – whichever is closest.
  5. Repeat the boxes by copying the same box and ‘stack’ it to the all-time high/low – the opposite of whichever was used to establish the box/price range.
  6. Draw Fibonacci retracements in the boxes.


Sources:

Brown, C. (2010). Fibonacci Analysis: Fibonacci Analysis. Hoboken: Wiley.

Brown, C. (2019). The Thirty-Second Jewell: Thirty Years Behind Market Charts From Price To W.D. Gann Time Cycles. Tyton, NC: Aerodynamic Investments Inc.