You’re still using Fibonacci retracements incorrectly
Like any discipline or field of study, Technical Analysis goes through changes. Old theories and approaches are rigorously utilized and tested, new ideas are studied, and advancements in the field occur. And, like any discipline or study, it takes a while for people to adapt to the new way of doing things. There is a shocking amount of updated theory and application in Technical Analysis that has yet to make its way down to the retail trader and investor – some of it is almost 25+ years old! One of the updates to old application and practice is how we use a tool known as a Fibonacci retracement. For many years, the method has been to draw a retracement from one extreme swing to the next (from swing high to swing low or swing low to swing high). In practice, there are a few incidents where this may work out just fine, but the new and better way shows how much more accurate and useful the update has been.
Old vs. New
I want to start off right away by showing you the difference between the old and new methods – I reference the new approach as the Brown Method. The AUDUSD Weekly chart below shows the old way of drawing Fibonacci retracements. With the old process, the Fibonacci retracement is drawn from the extreme swing high on the week of August 5th, 2011, to the extreme swing low on the week of October 31st, 2008. The vertical line delineates the starting point of the retracement, and no data to the left of that vertical line should be used to determine the efficacy of the retracement. It is only the data after the vertical line that is important and relevant.
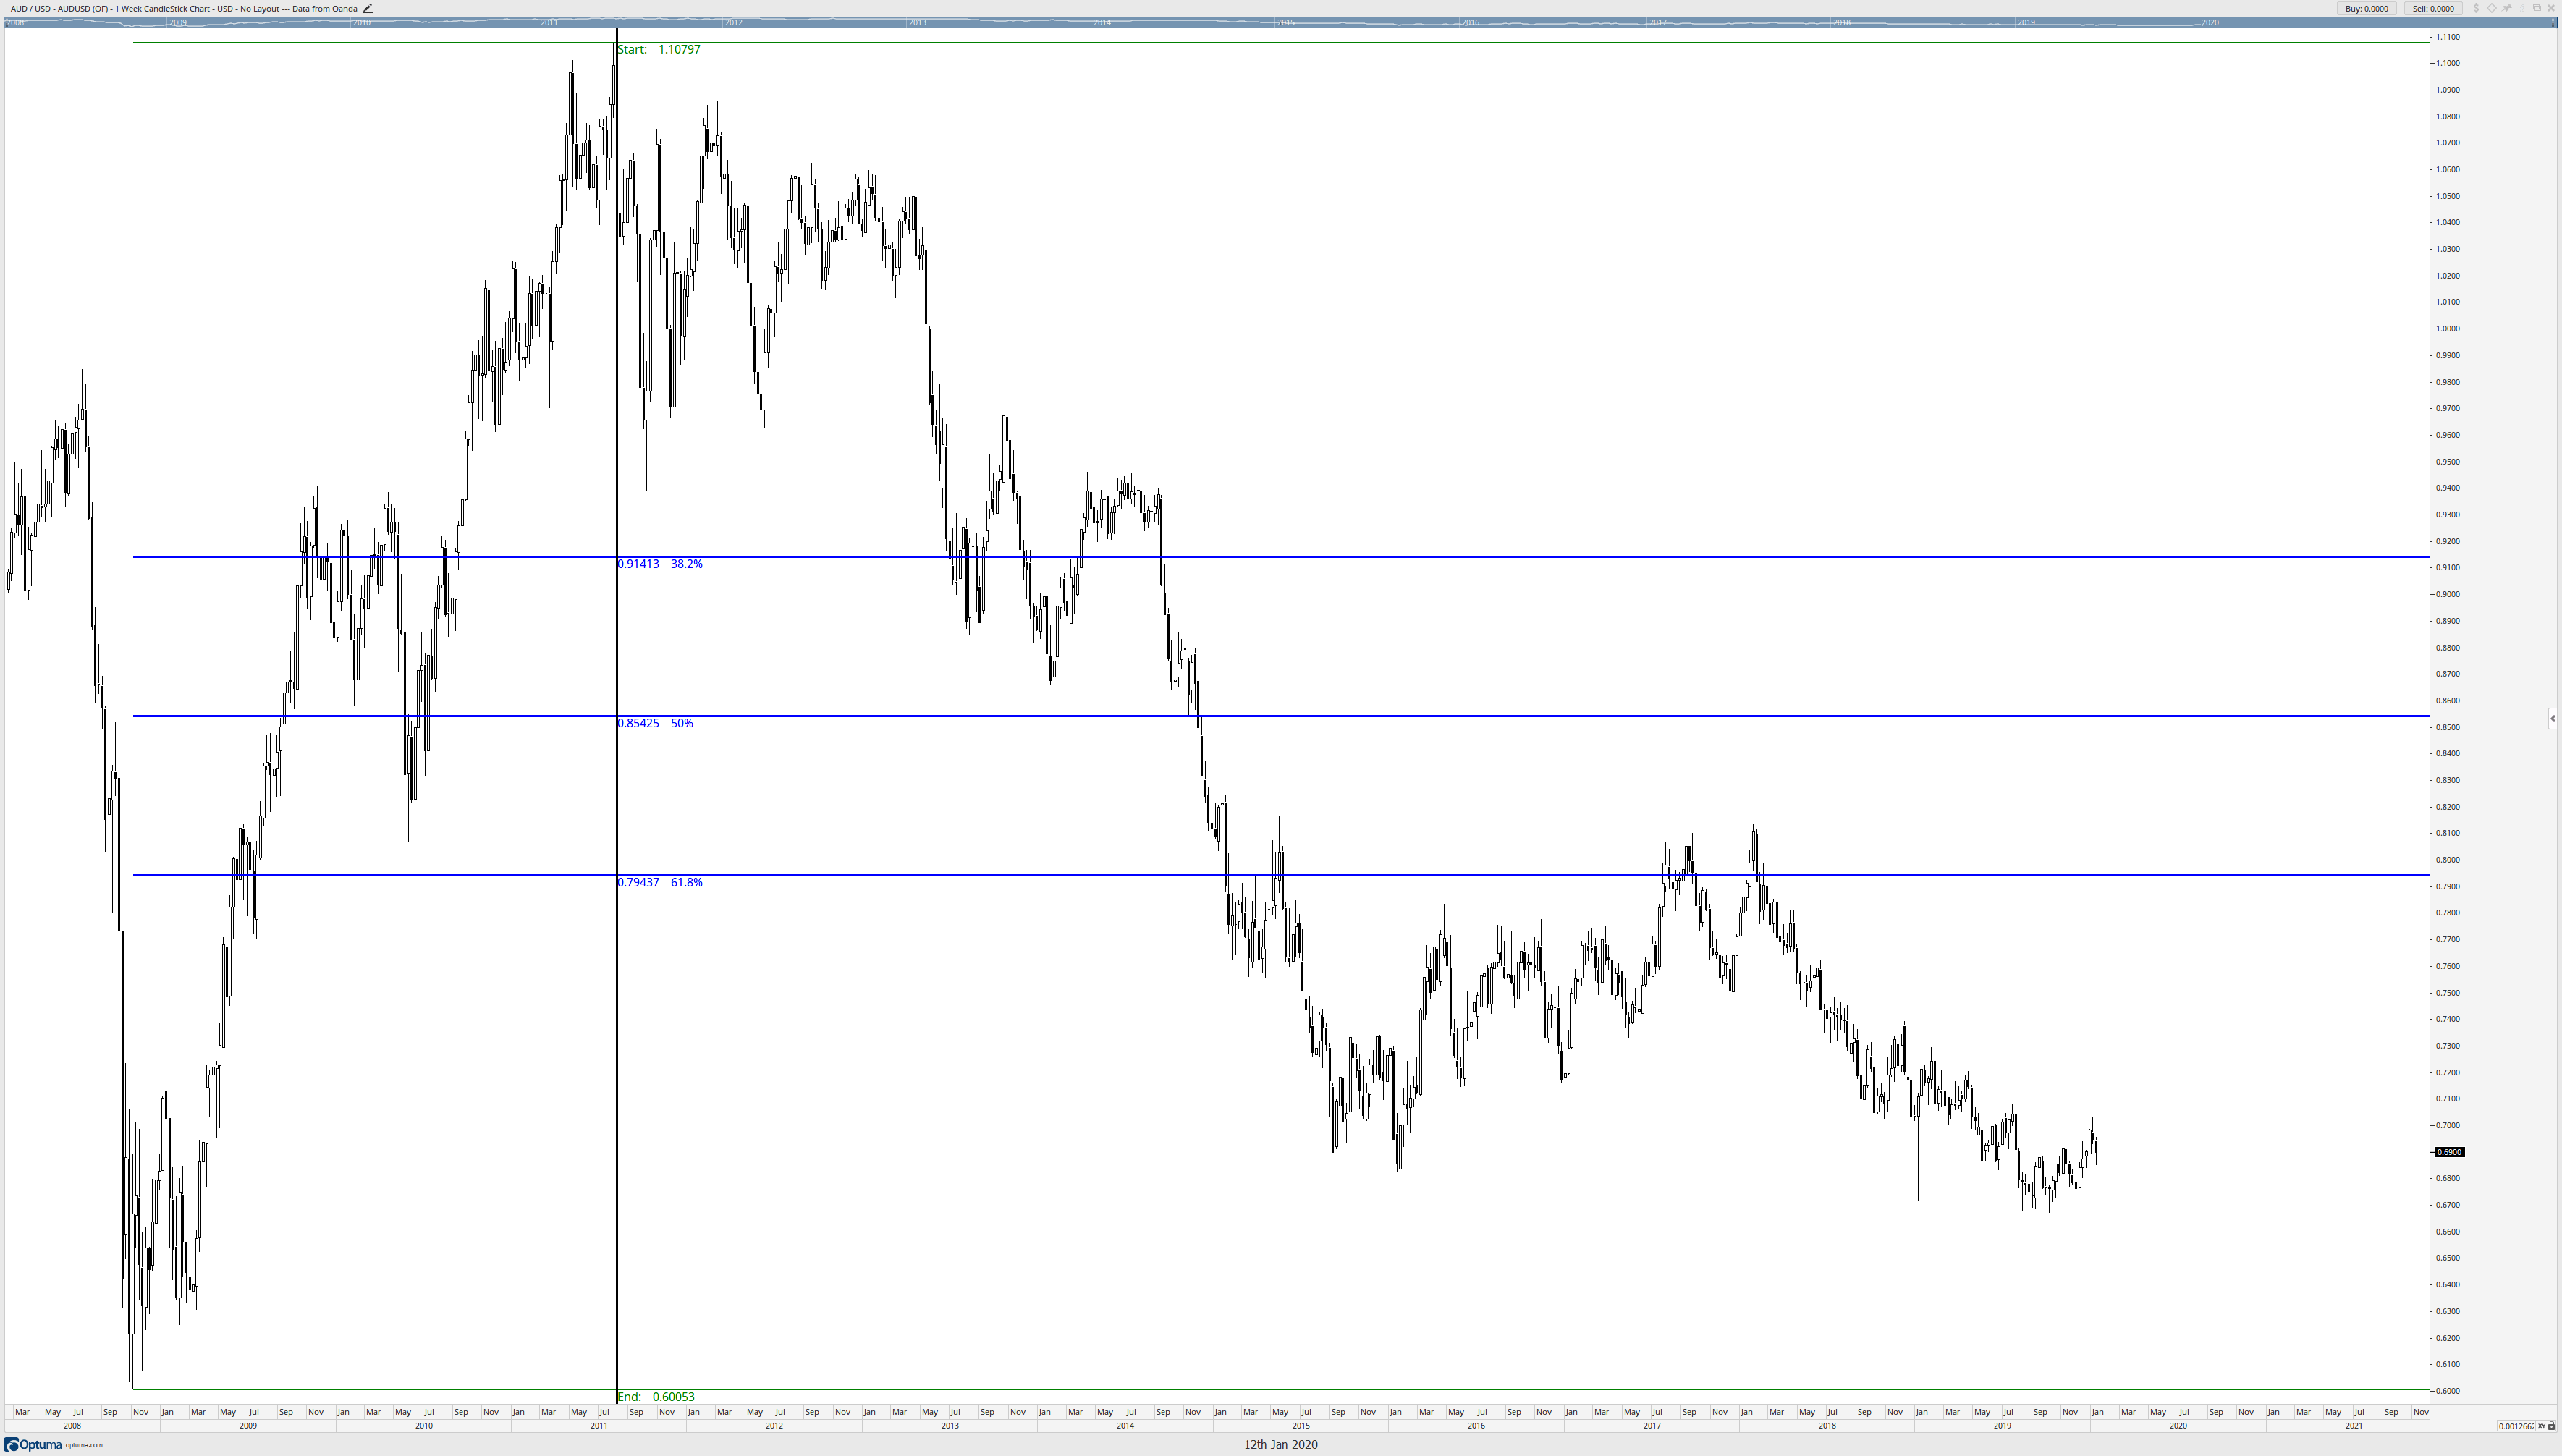
Now, contrast the image above with the new Brown method below.
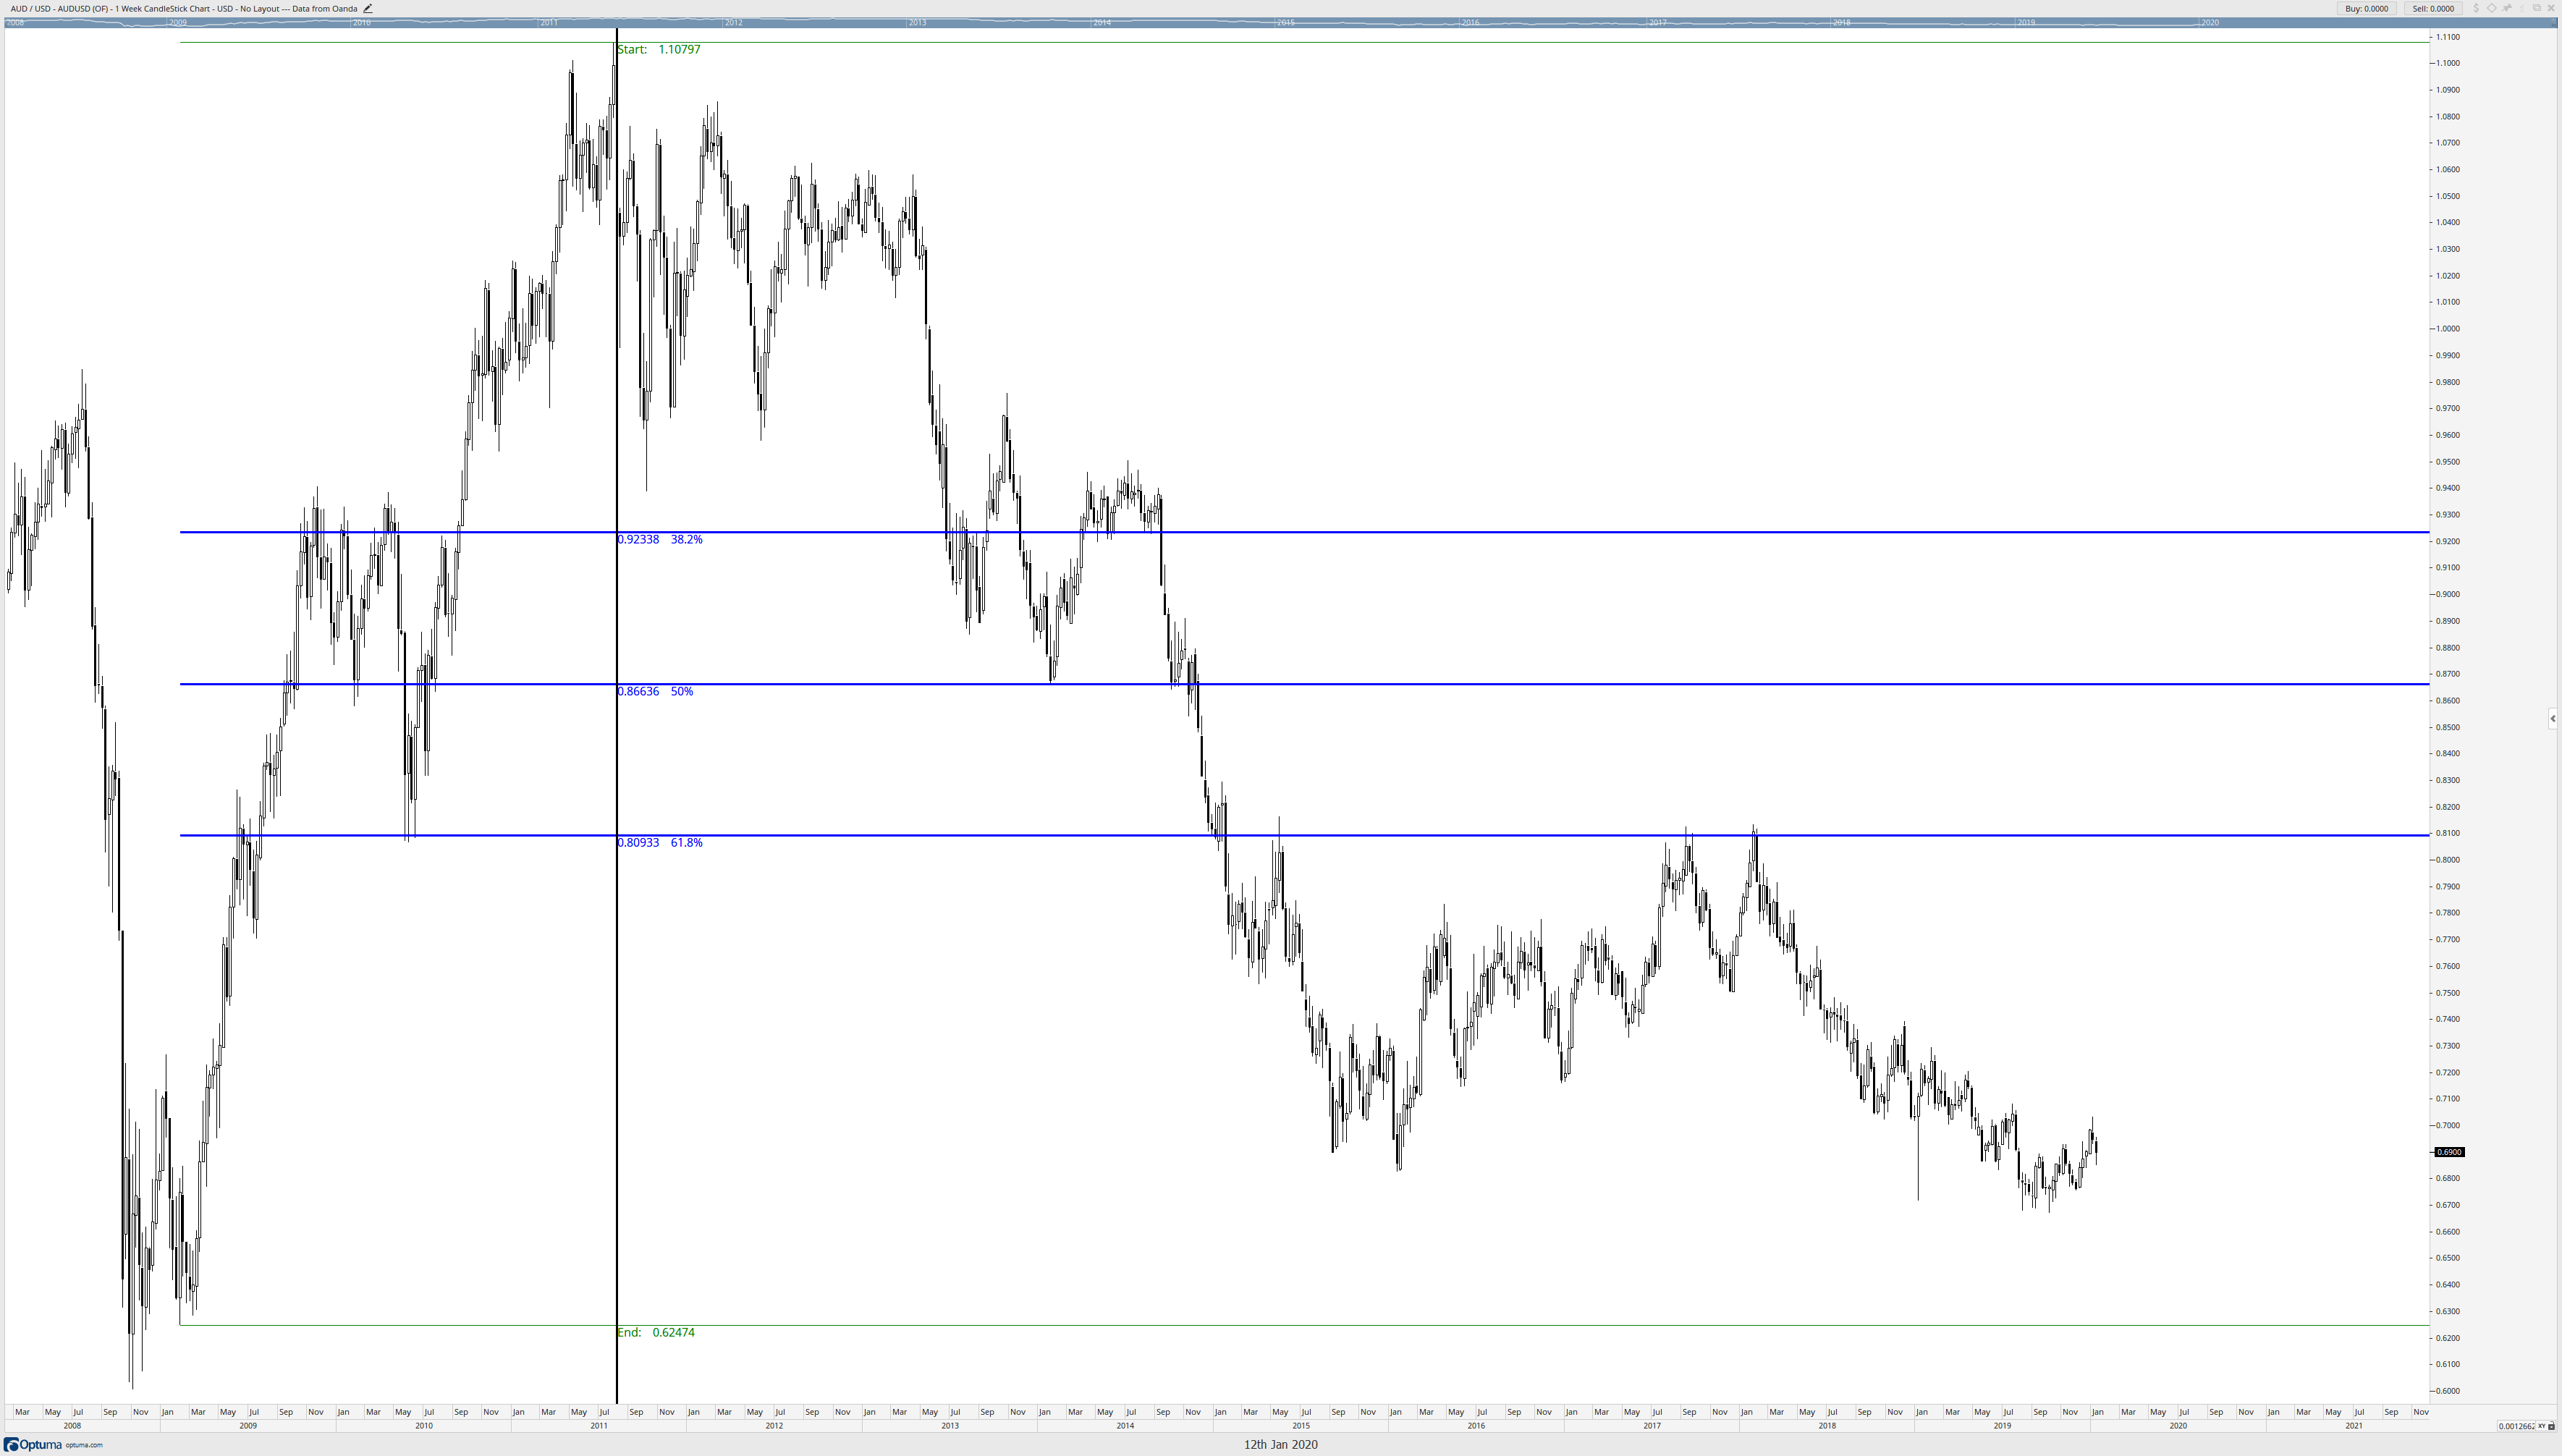
You will observe how much more accurate the Fibonacci retracement levels are on the Brown Method vs. the old method. What changed? Observe the swing low retracement on both charts – they are different. They both start at the same level, but the retracement end for the Brown method is drawn to the swing low on the week of February 6th, 2009. But why? Why do you draw to a seemingly random or ‘off’ swing and not the extreme? The reason for this is based on the writings of W.D. Gann.
The Brown Method
I call this new Fibonacci retracement method, the Brown Method, after Connie Brown. It is Connie Brown who discovered this new theory and wrote about it in her 2008 book, Fibonacci Analysis. It is not a very large book, under 200 pages, but it is one of the single most important works in Technical Analysis of the past 15-years. Her discoveries of how confluence zones of Fibonacci retracements dictate the normal rhythm and pulse of the market are truly groundbreaking. But to the first question of why I did not draw the retracement to the extreme low? Connie Brown points out that W.D. Gann made the point that the end of a trend is not established by the extreme high or low – it is the secondary high/low that confirms the change in trend (sometimes known as the confirmation swing). This makes sense because the extreme is very rarely the level where the participants in a market agree that a trend is finished.
So how do we identify what swing to use? How did I identify what candlestick was the confirmation swing low on the weekly AUDUSD chart? Again, this goes back to Brown – but this information is from her penultimate work (her magnum opus in my opinion), The 32nd Jewel. The first chapter of her massive book (it weighs about eight lbs., is three inches thick and nearly 1100 pages long) addresses some of the problems students of hers have had with the application of her updated Fibonacci retracement method. To identify the correct swing to use, we look for the strongest bar. Let’s take a ‘zoomed’ in look at the swing low used on the AUDUSD weekly chart above.
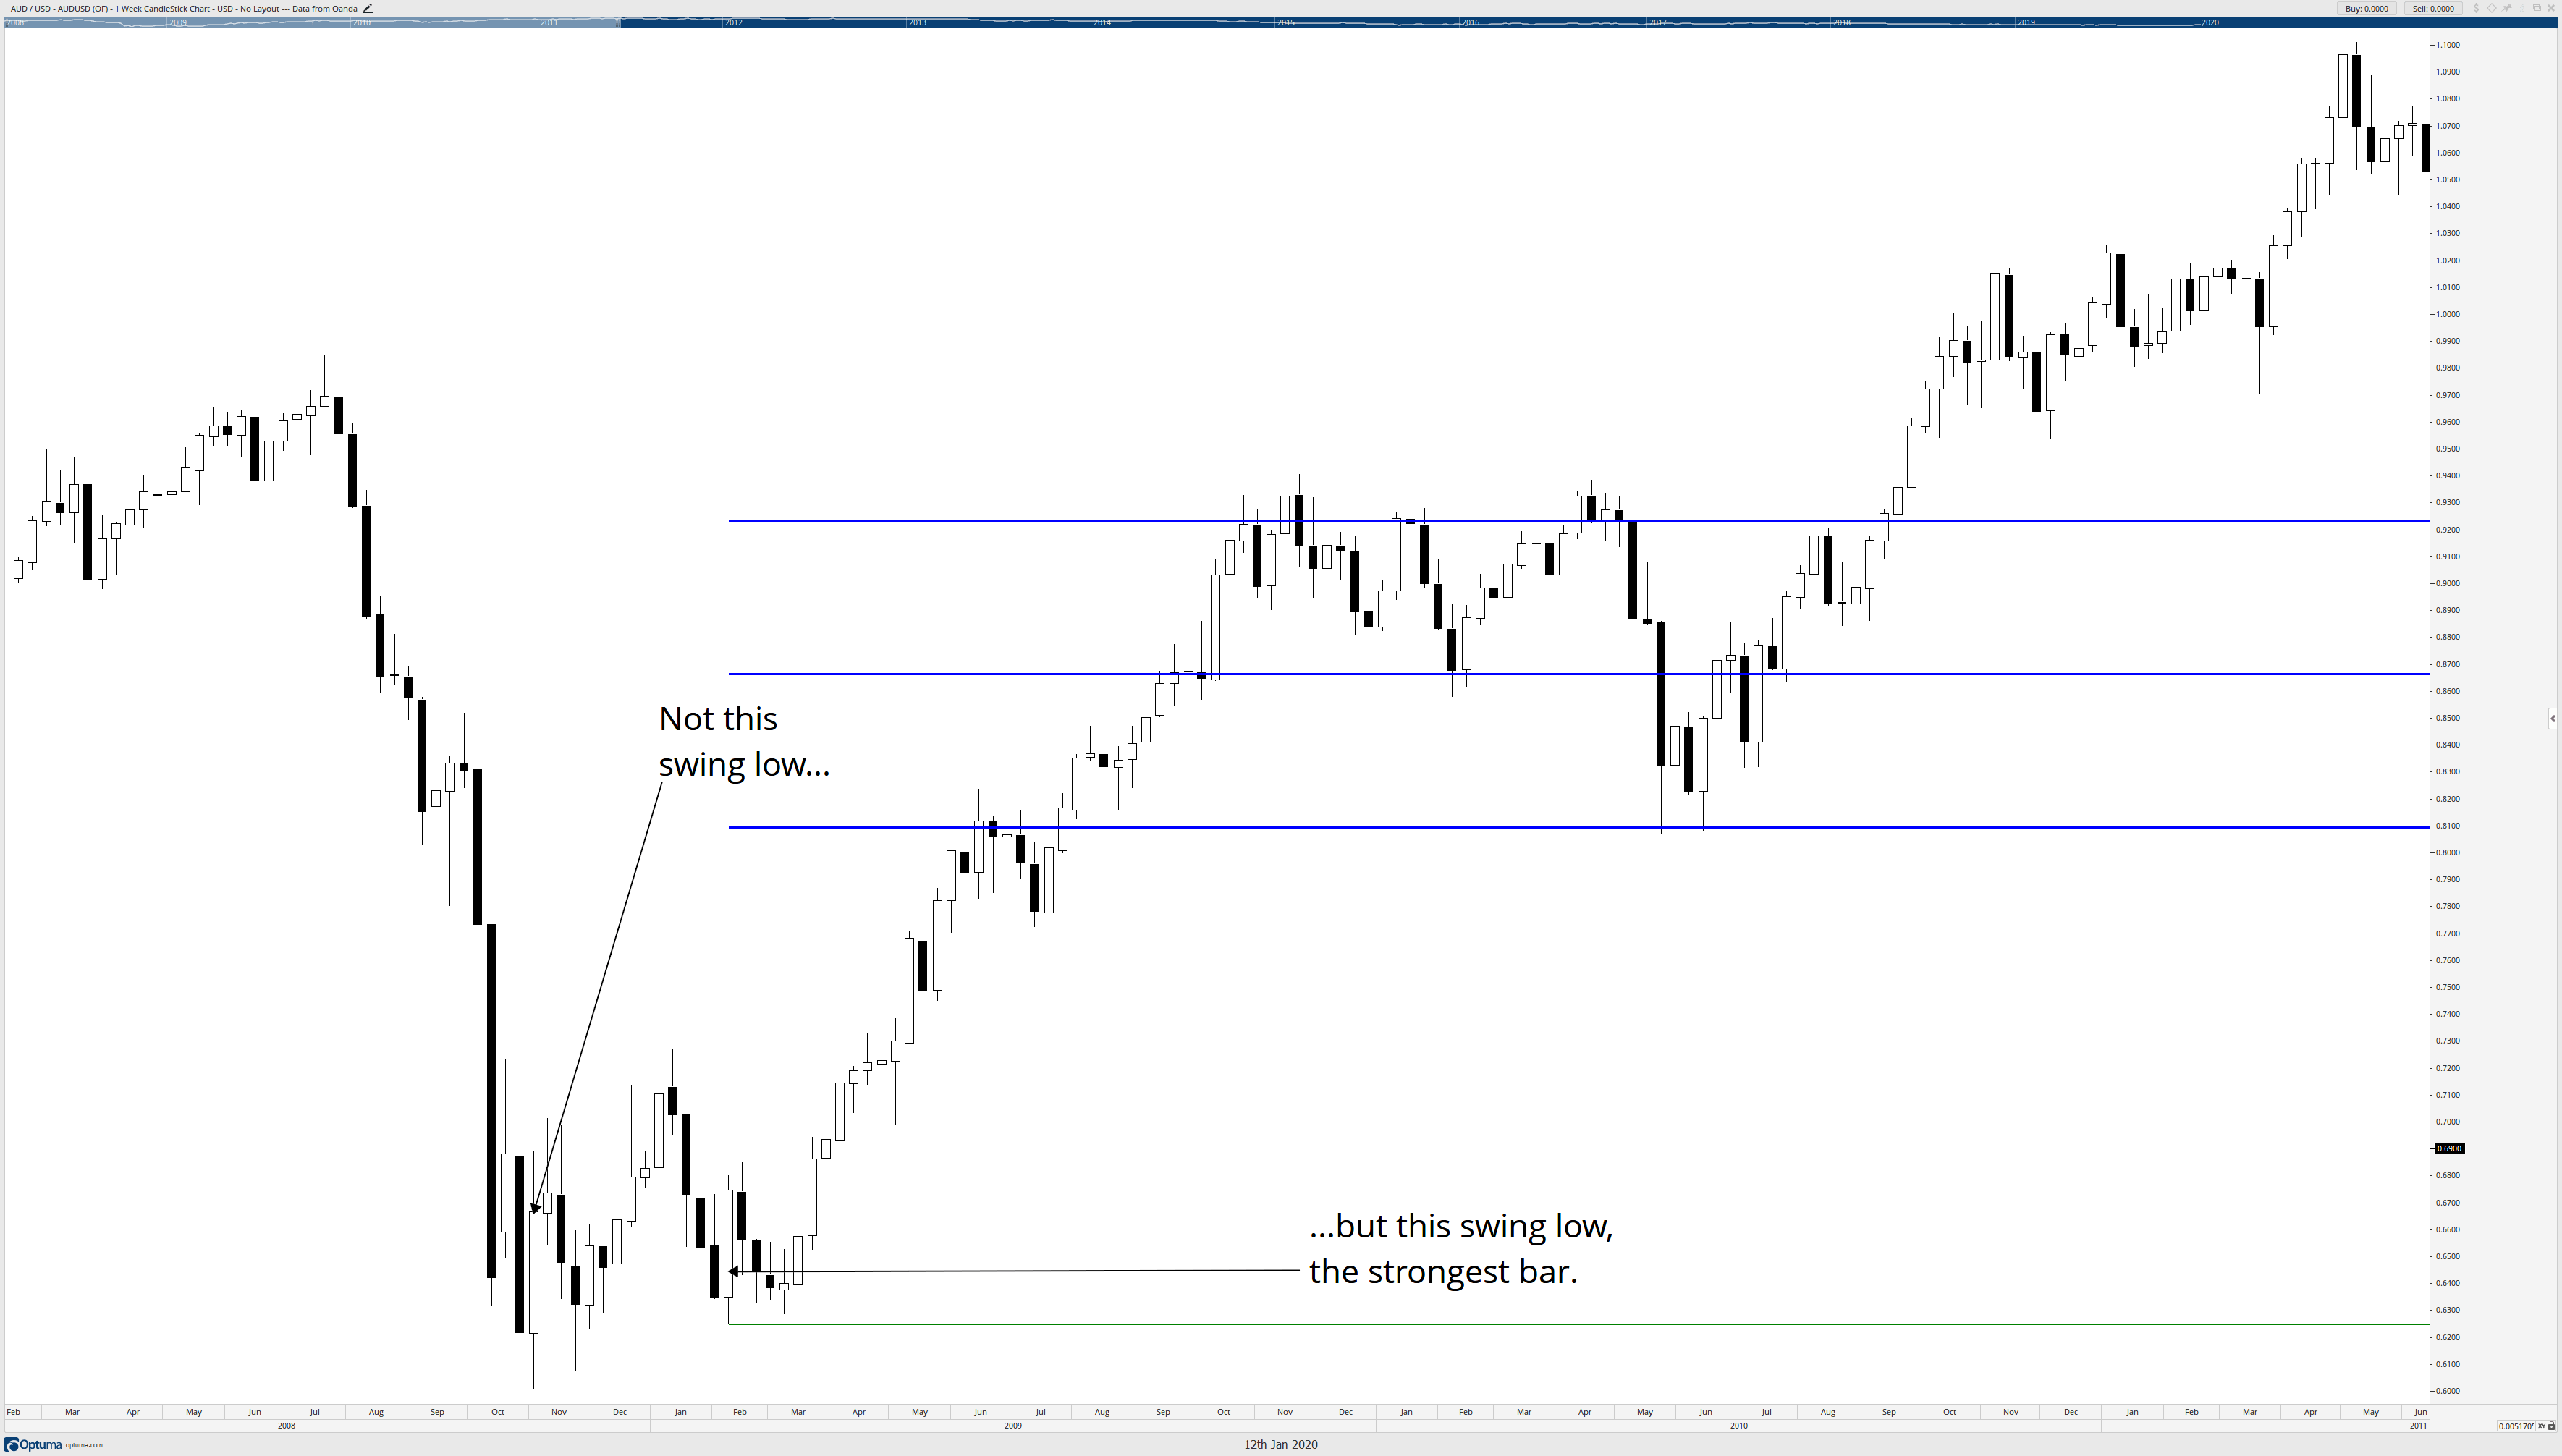
It will take you some practice to find the swing bar (also, gaps are used, but that is for another article) that would be considered the ‘strong bar.’ What constitutes a strong bar? That can be somewhat subjective, but look at the candlestick that I’ve identified as the strong bar compared to the candlesticks before it and around it. Why did I pick this candlestick? First, it is a bullish engulfing candlestick on the weekly chart. Second, that candlestick rejected any further downside pressure after a consecutive four week period of weekly candlestick closes below the open. Third, the open and low of the candlestick created the support zone for the next five weeks. In a nutshell, the candlestick is massive, its sentiment overwhelmingly one-directional, and the lows of that candlestick were respected. That candlestick was the confirmation swing low because it confirmed the end to lower prices and was the most substantial candlestick before the new uptrend occurred.
Side note: Connie Brown also said to look for gaps in the price action as areas to draw the confirmation swing. Finding gaps is a much easier process when looking at traditional markets like the stock market. Forex data can vary from broker to broker as some data providers show gaps, and others do not.
The following articles will go into further detail on how to implement more of the Brown Method. I believe that what you will read and learn will be one of the ‘wow’ moments you experience in the study of Technical Analysis. To say that what Connie Brown has discovered is truly amazing is an understatement when we learn about the confluence of Fibonacci zones and how they create the natural price zones that an instrument swings to, it is a truly eye-opening experience.
Sources:
Brown, C. (2010). Fibonacci Analysis: Fibonacci Analysis. Hoboken: Wiley.
Brown, C. (2019). The Thirty-Second Jewell: Thirty Years Behind Market Charts From Price To W.D. Gann Time Cycles. Tyton, NC: Aerodynamic Investments Inc.

