Categories
Forex Price Action

Significance of Having the Belief in Your Analysis

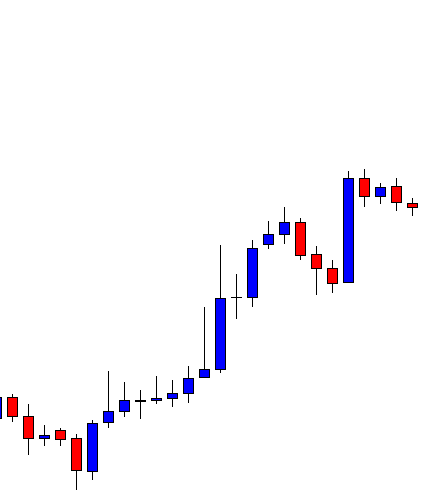
In today’s lesson, we are going to demonstrate an example of H1-15 combination trading. The price trends from the level of 61.8%. Usually, when the price trends from the level of 61.8%, it does not take that long to make a breakout. However, in this example, we will demonstrate that it may sometimes take longer than our expectations. Let us get started.

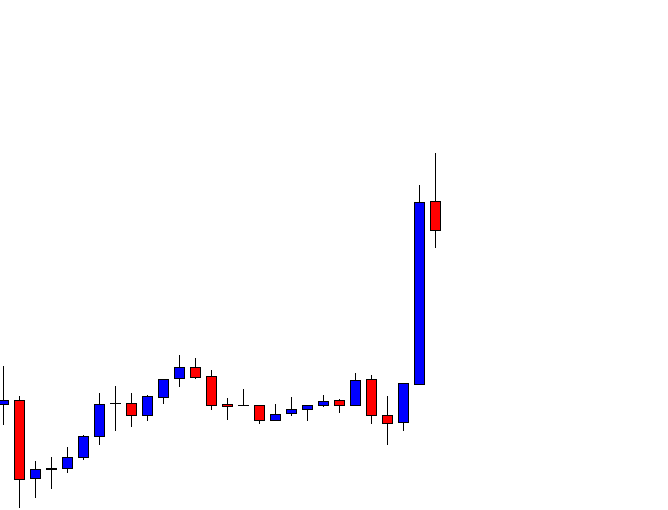
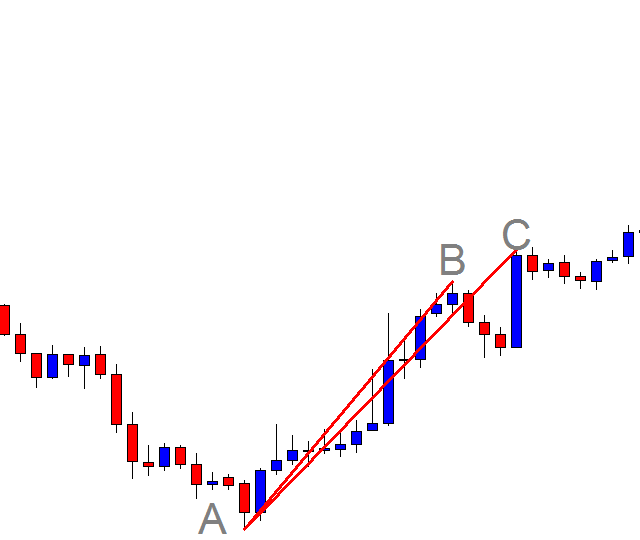
The chart shows that the price makes a strong bullish move towards the North. The last candle comes out a bearish inside bar. It indicates that the price may make a bearish correction. The buyers are to wait for the price to produce a bullish reversal candle followed by a bullish 15M breakout at the highest high of the wave to go long in the pair. This is the plan of the game. Let us find out how it goes.

The next candle comes out as a bearish candle as well. The last bearish candle has a long lower shadow. It indicates that the chart may produce a bullish reversal candle anytime soon. The buyers are to wait here with patience.

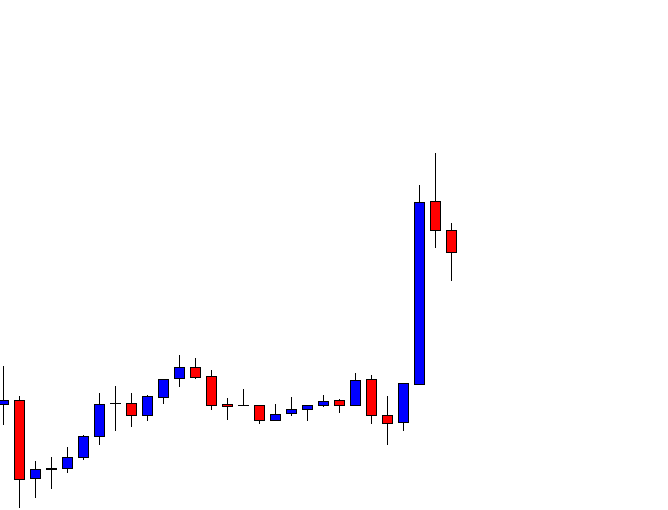
As expected, the chart produces a bullish reversal candle. The candle comes out as a bullish engulfing candle. The H1-15M combination traders are to flip over to the 15M chart and wait for a bullish 15 candle breaching the wave’s highest high to trigger a long entry.

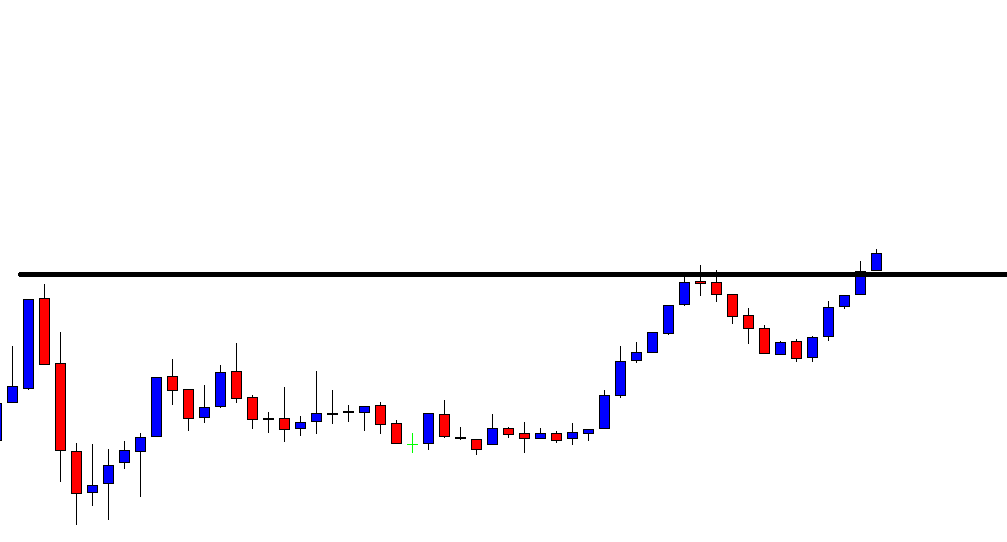
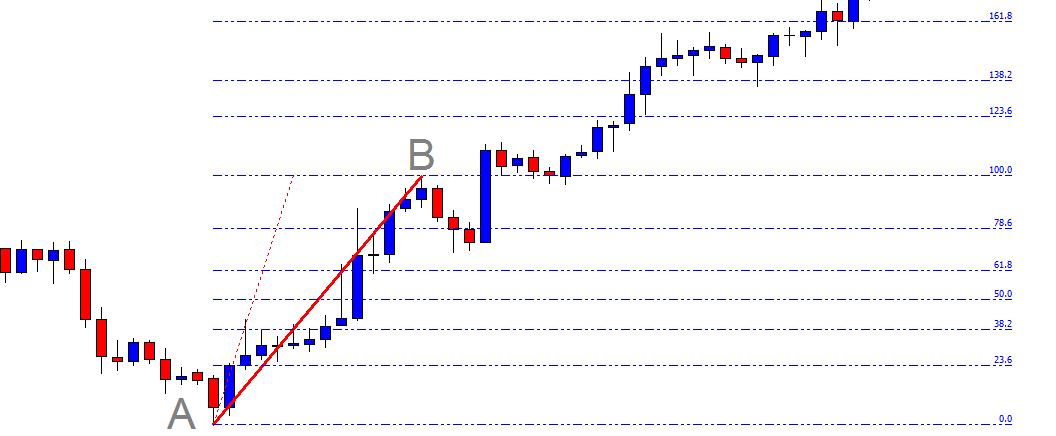
You may have noticed that the price has been within the level of resistance for several candles. It means the buyers are to keep their eyes on this pair for a long time. Look at the last candle. After so many hours of waiting, the 15M chart produces a bullish candle that closes above the level of resistance. The buyers may trigger a long entry right after the last candle closes. Let us flip over to the H1 chart with Fibo levels on and find out what happens here.

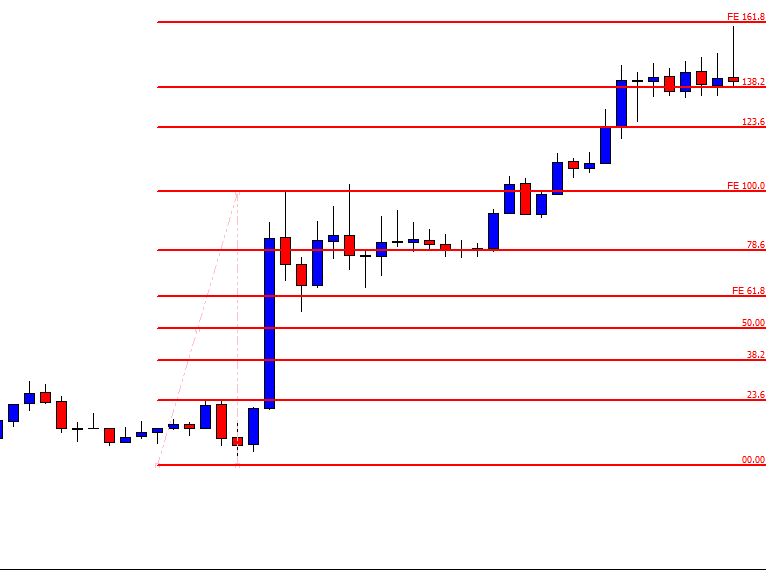
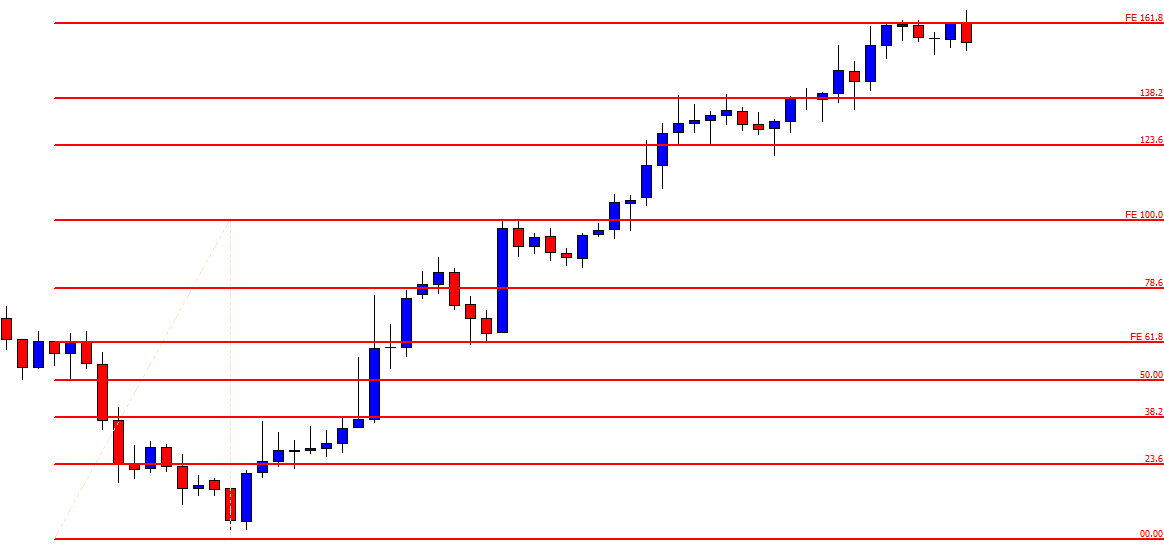
The Fibo level shows that the price trends from the level of 61.8%. This is one of the levels, which usually produces good momentum. In this example, it produces a good bullish momentum after the breakout, but it takes a long time to make the breakout. The H1-15 combination traders’ patience is tested here. The buyers who wait and keep the belief that it may end up producing the signal make money out of this setup in the end. It is not easy, but this is what trading is all about. Having a belief in analysis helps a trader be a better trader.

Categories
Forex Fibonacci

Determining Higher Highs or Lower Lows to Draw Fibonacci Levels

Fibonacci levels are obtained by using higher highs or lower lows. A chart may have many higher highs/lower lows. Thus, Fibonacci levels can be obtained at different levels. A trader may find it difficult to spot out the levels where the price may react. In today’s lesson, we are going to see how different higher highs may lead us to having Fibonacci levels where the price does not react.

This is an H1 chart. The price heads towards the North with good bullish momentum before making a bearish correction. The point can be used to draw Fibonacci levels. The price then makes another bullish move and makes a new higher high. Some traders may want to use the last higher high to draw their Fibonacci levels. To make it clear, look at the chart below.

Some traders may use AB, while some others may use AC to draw Fibonacci levels. These two arms point out Fibonacci levels at different levels. Let us assume that we draw our Fibonacci levels by using AC.

The chart shows that the price after making the last higher high has started having a bearish correction. The buyers are to wait for the price to come at 78.6% level and make a breakout at the level of 100.0 to offer them a long entry. If the 78.6% is breached, 61.8% may do the same and offer them an entry as well. Let us proceed to the next chart to find out what happens next.

The price does not even come at 78.6%. It heads towards the North and makes a breakout at the level of 100.0. The price then never looks back. It hits the level of 161.8% in a hurry. The Fibonacci buyers do not find an entry here since the price does not trend from a 78.6% level. It trends way above the level of 78.6%.

Let us draw the Fibonacci levels with AB arm.

If we draw Fibonacci levels by using AB, we see that the price trends from 78.6% level. One candle breached through the level, but the next candle closes well above the level of 100.0. The buyers may set their target around 138.2% since it trends from 78.6%. However, it goes up to 161.8%.

To sum up the lesson, Fibonacci traders are to be well calculative at the time of selecting the first arm. With AC, there is no correction. The price trends towards the North straight. With AB, the price makes a correction and then makes another bullish move. Usually, a straight arm works well and provides accurate Fibonacci Fibonacci levels. Over here, we have seen that AB provides the Fibonacci levels, where the price reacts and help the buyers take a trading decision.