
Leonardo Bonacci, AKA Fibonacci, was a mathematician, born around 1170, and became known for developing the Fibonacci sequence: where each number is the sum of the two preceding ones, starting from 0 and 1. Such as; 0, 1, 1, 2, 3, 5, 8, 13, 21, 34, 55, 89,144, and on to infinity.
From this theory, the ancient Greeks founded the Golden Ratio, AKA Golden Section, Golden Mean, and Divine Proportion (proportions) where many things in the universe and in nature can be measured by such Golden Ratios.
In Forex, the most commonly used Fibonacci ratios are: 38.2%, 50%, 61.8% and sometimes 23.6% and 76.4%. These ratios are better known as retracement levels and are used in technical analysis to help traders establish support and resistance levels and areas where a trade might turn in direction.
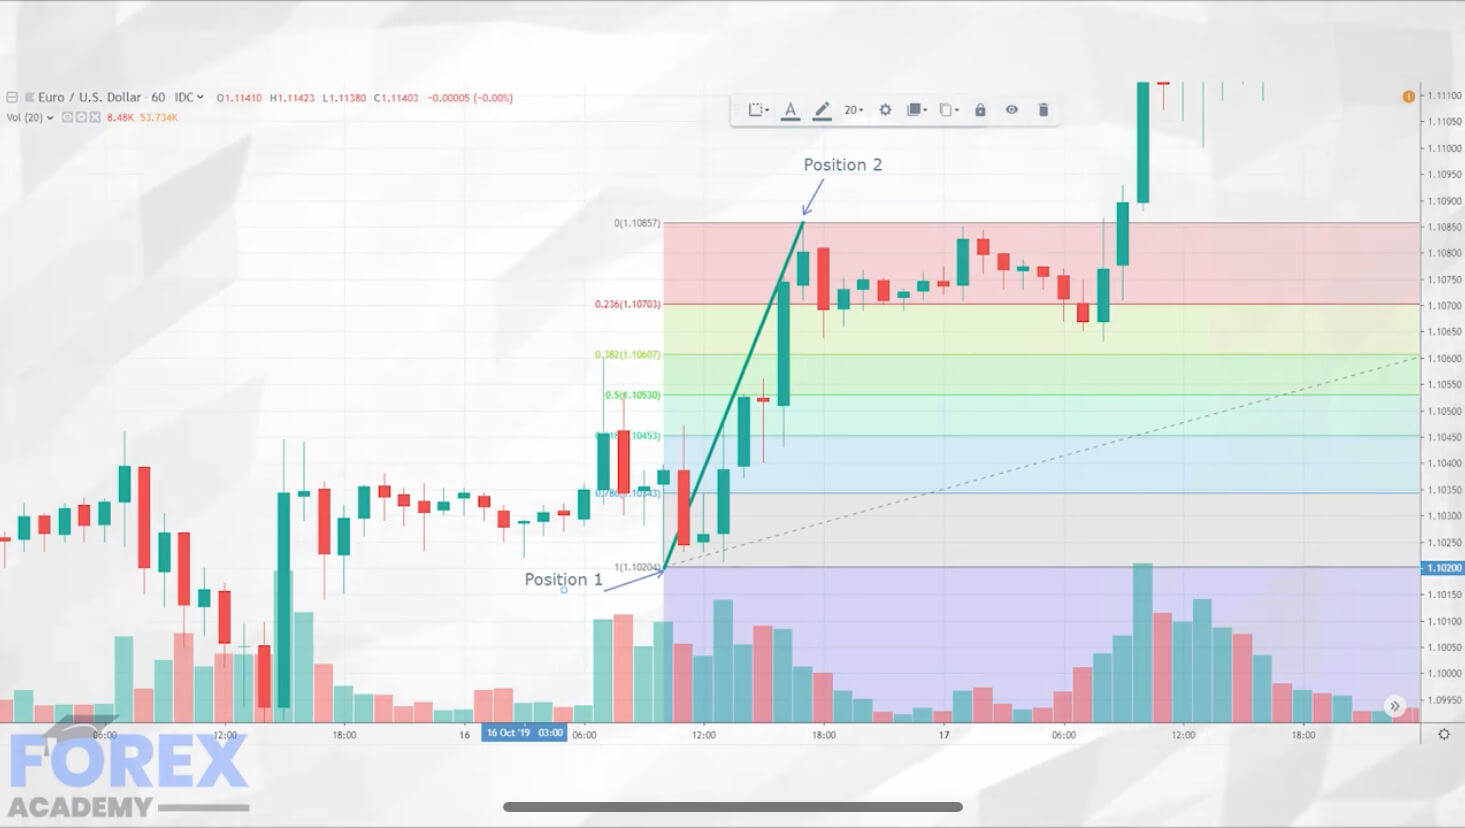
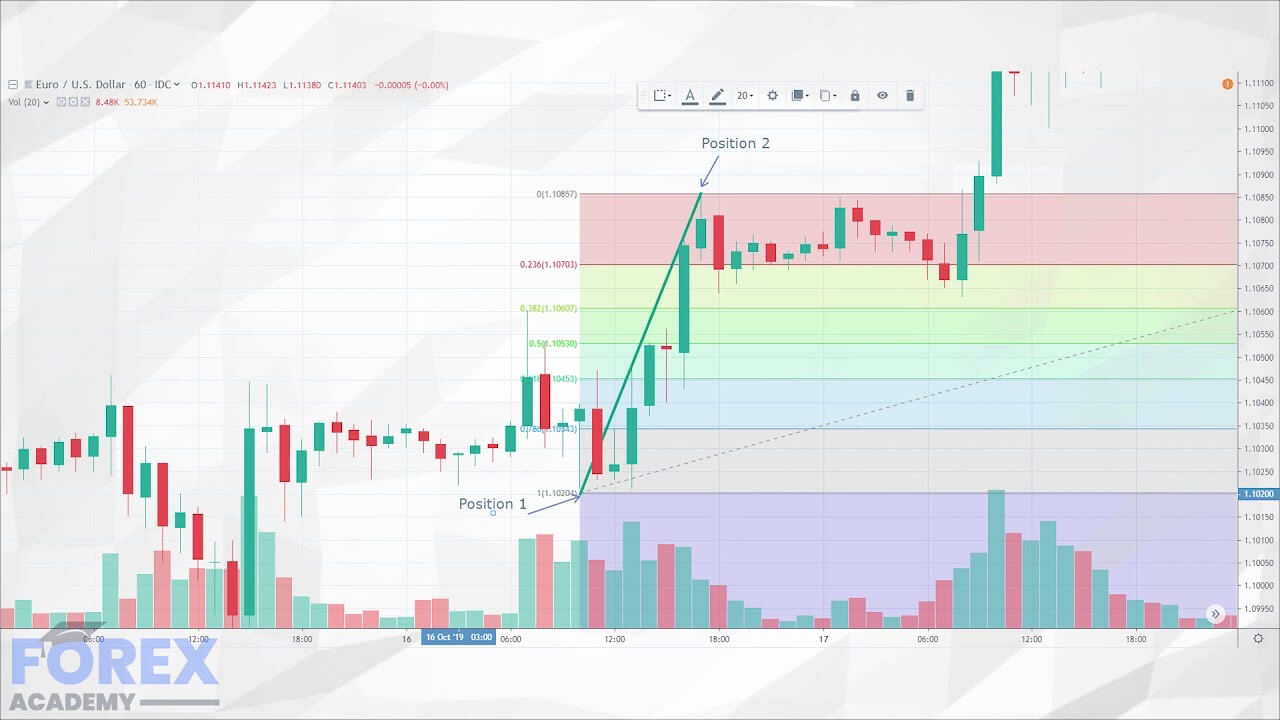
Traders simply place their Fibonacci retracement tool onto their chart and set position ‘1’; the lowest point in a move and then drag the tool to position ‘2’, the highest point of a move. The tool will automatically open retracement levels on the chart showing dividing lines with individual ratios of 23.6%, 38.2%, 50%, 61.8%, and 100%. The idea is that the swing high on the trader’s chart will be followed by a pullback or retracement, and then the trader must decide at which level, if any, the price action will stall and then continue its upward move. For example, if the pullback falls to the 23.6% and then continues higher (above our initial high point), this would be considered a strong bullish move. A slightly weaker bullish move would be indicated by a pullback to the 38.2% retracement line. Therefore, the shorter the pullback, the more likelihood of a stronger push higher and continuation of the trend. See our article, Introduction To Elliot Wave Theory – Accurately Predicting Forex trends.
This above set-up is used for a bullish move on a Forex pair. If the trader wishes to look at a bearish move, he/she simply places position one at the highest point in a move and drags position 2 to the lowest, in which case the opposite applies to the original set up.
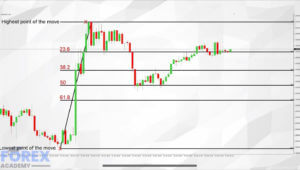
Let’s look at example A: –
This is a 5-minute chart of the EUR:USD pair. We have brought our Fibonacci tool on to the screen at the lowest point of the move (1.0990) as denoted by the X and then dragged it to the highest point of the move (1.1044), as denoted by the second X. The tool has opened six vertical levels on the screen: 0, 23.6, 38.2, 50, 61.8, and 100. These show, in percentage terms, the level of pull back from the lowest point to the highest point. What is evident by the green candlesticks is that there was a strong push high early in the move and then price action entered a ‘sideways’ move before pulling back to the 23.6% line, and then after a move higher, price action pulled back to the 23.6% line and then moved lower, stopping briefly at the 38.2% level before finding support at the 50% retracement level (1.1018) before moving higher. Had a trader bought the pair at the 50% retracement, where price action clearly stalled, they would have seen an 18 pip move to the upside. If this was to be used on every trade and consistently yielded the same results a couple of times a day, it would prove to be an immensely powerful trading tool.
However, we strongly advise not to solely trade with a Fibonacci tool for the following reasons. That initial spike higher in the EUR:USD pair in example A, from 1.0990 to 1.1044, was the result of an unexpected news flash release where the European leaders had agreed on an initial draft acceptance verbiage relating to a breakthrough in the Brexit negotiations, and a possible way forward. These types of news releases are inclined to be put down to rumor and conjecture and can often cause spikes and rapid reversals in price action.
Therefore, while Fibonacci is a very useful way of reading and predicting moves, we will always advocate that they are used in tandem with other tools, such as up to the minute news releases
information (being informed), Stochastics (overbought and oversold) indicators, Bollinger bands and focus on key exchange rate levels, especially round numbers. Also, always be mindful of economic new release schedules, which can also adversely affect price action.