Introduction
In our previous educational article, we reviewed how the identification of double top and double bottom formations could provide a trading setup, which, according to its technical configuration, returns a risk to reward ratio equivalent to 1:1.
In this educational article, we’ll review the use of Fibonacci retracements and extensions to generate trading signals.
Trading the Market Corrections
Trading based on corrective movements has its origin in the idea that when the price action makes an impulsive move, the market develops a corrective movement before continuing to develop a new motive move.
This method’s risk derives from the possibility of false breakouts, which, depending on the primary trend, could be a “bearish trap” or “bullish trap.”
Considering that there is a broad range of Fibonacci ratios, Fischer & Fischer propose filtering the trading volume using the 61.8% level as a conservative level. The use of 61.8% provides the technical trader the possibility to invest risking a reduced part of its capital.
As a second entry filter criteria, traders could use the swing size average of the asset under analysis. Considering that every financial asset holds a different personality and volatility, this filter demands the technical trader to develop statistical backtesting to understand the asset’s inherent volatility under study.
Trade Setup
Entry Setup: Considering that the entry rule requires a unique Fibonacci level, the entry will occur once the price touches and closes above (or below) the level 61.8%. This criterion could help shield the technical investor against a potential false breakout.
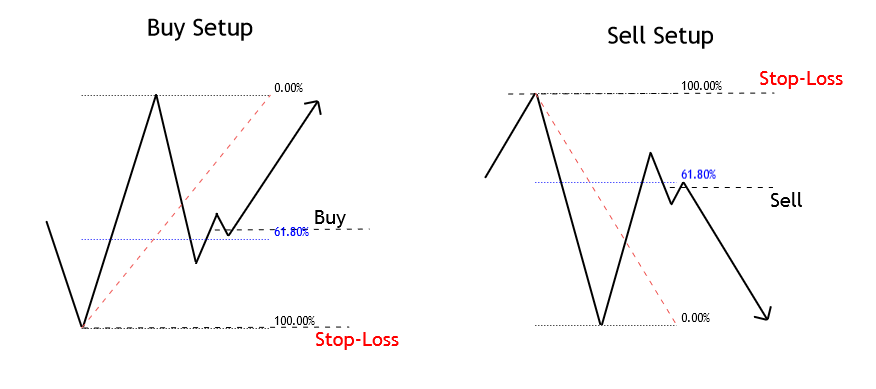
Stop-Loss: The trade invalidation level will be set above/below the last peak/valley preceding the entry-level. The benefit of trading using the 61.8% level as the point of market entry is the reduced risk compared with other typical Fibonacci levels, such as 38.2% or 50%.
Trailing Stop as Profit Protector: This method by itself doesn’t make the use of a profit target level. As an alternative, the use of a trailing stop could help protect profits with a trailing criterion of the last peak or valley. The disadvantage of this method is that, constrained by the volatility observed in the real market, it is unlikely that the resulting risk to reward ratio goes beyond a mere 1:1.
Trading the Market Progress
As the Elliott Wave Theory states, the price tends to advance in three or five waves. This method uses Fibonacci extensions to define target levels.
In general, when the price action develops a price movement on strong momentum and, then, its correction doesn’t violate the starting level of the initial move, it means the market is not building a bullish or bearish trap; thus, it is likely the action will continue progressing in the direction of the first move.
Entry Rule: In the same way as in the case of a price correction setup, the entry should be set when the price retraces and closes, starting a new impulsive move. This condition doesn’t require that the price retraces to the 61.8% level of the initial movement.
Stop-Loss: The invalidation level of the trade setup should be located below the last peak or valley preceding the entry-level.
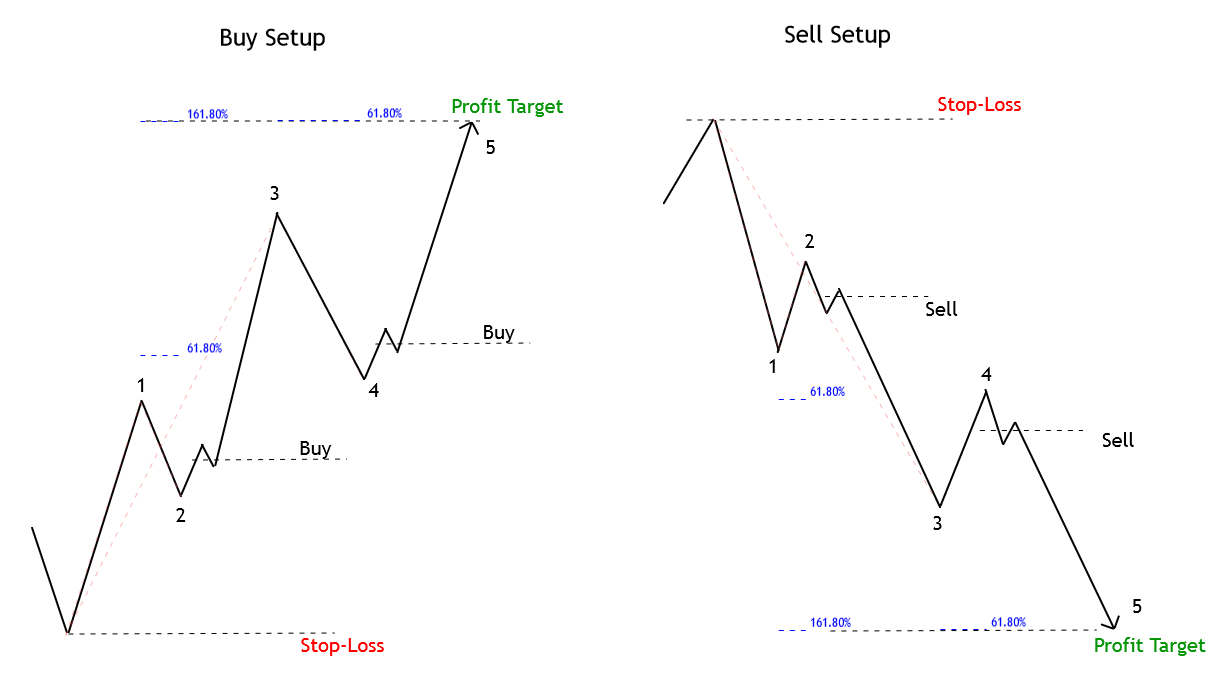
Profit Target (Three Movements Case): When the price evolves following a three-move sequence, the profit target should be set at 161.8% of the projection of the first sequence, as illustrated in the next figure.
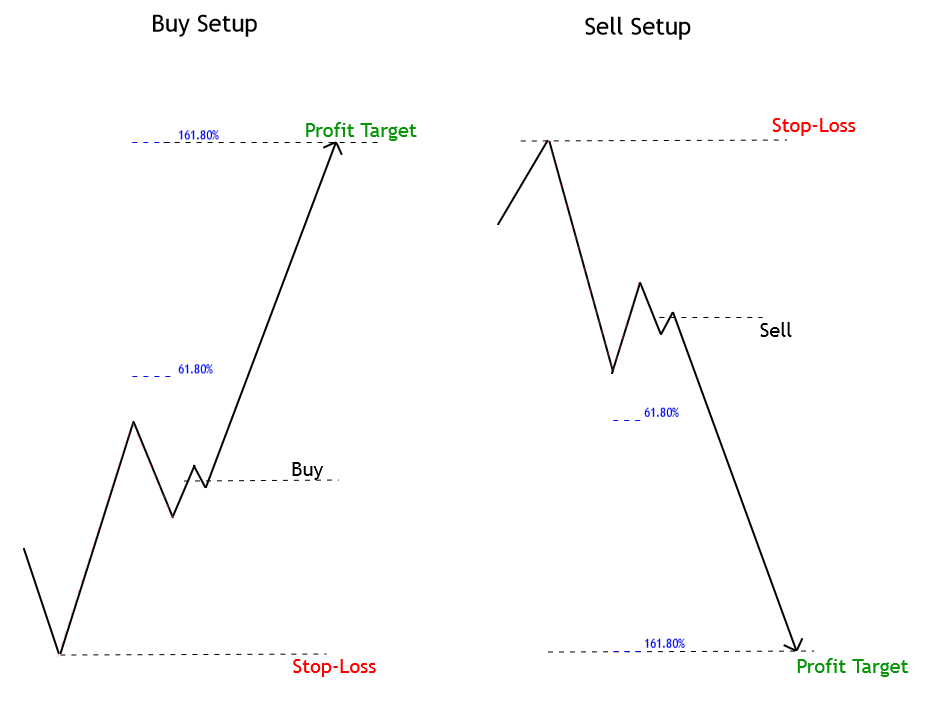
Profit Target (Five Movements Case): This scenario considers two options. The first one is when the progress happens in the third segment and the second one when the price action has completed the third move and could be initiating its fifth movement. These scenarios are illustrated in the following figure.
Conclusions
In this educational article, we reviewed two cases in which to use as Fibonacci retracements as the extensions tool. Both methods presented in this article offer specific risks. The use of the corrections method provides a reduced risk to the technical trader, due to the trailing stop use criterion, this doesn’t mean that it could deliver a risk to reward ratio of over 1:1.
On the other hand, the use of the Fibonacci extensions, according to Fischer & Fischer, always means to invest against the trend. However, a combination of both methods could provide an opportunity to enter in favor of the market direction.
To reduce the noise and risk in the investment process, the technical trader must evaluate the performance strategy developing statistical backtesting with historical data before risking real money.
Suggested Readings
- Fischer, R., Fischer J.; Candlesticks, Fibonacci, and Chart Patterns Trading Tools; John Wiley & Sons; 1st Edition (2003).


