In today’s lesson, we are going to demonstrate an example of an H1-15M chart, which made a good bullish move upon producing a bullish reversal candle at a key Fibonacci level. The H1 chart produces an H1 bullish engulfing candle earlier, but the price does not head towards the North. It takes time then produces another bullish reversal candle. It then heads towards the North with good bullish momentum. We try to find out why it does not make a bullish move at the first attempt but makes it at the second.
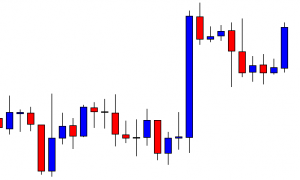
This is an H1 chart. The chart shows that the price makes a good bullish move and then makes a bearish correction. It consolidates for a while at a level of support and produces a bullish engulfing candle. The H1-15M combination traders may flip over to the 15M chart to trigger entry upon getting a 15M bullish candle. Let us find out what happens next.
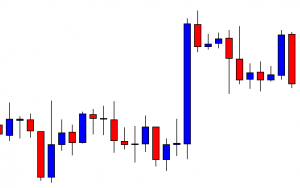
This is the H1 chart too. The chart shows that the price produces a bearish engulfing candle instead. We have not flipped over to the 15M chart yet. Let us find out how the 15M chart looks.
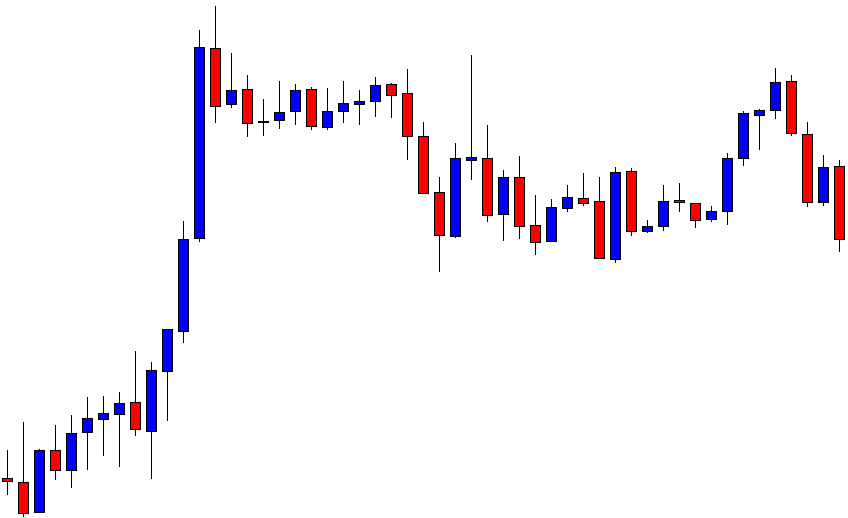
This is the 15M chart. The chart shows that the price does not produce any bullish candle closing ahead of the H1 bullish reversal candle. Thus, the price heads towards the South. The last candle comes out as a bearish engulfing candle in the 15M chart. It does not look good for the buyers anymore.
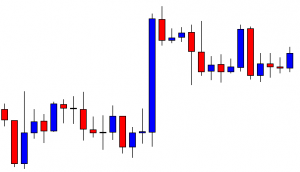
The price consolidates with more candles. The last candle comes out as a bullish engulfing candle again. The chart produces the candle at the same level. The combination traders may flip over to the 15M chart again to look for entry. Let us find out what the 15M chart produces this time.
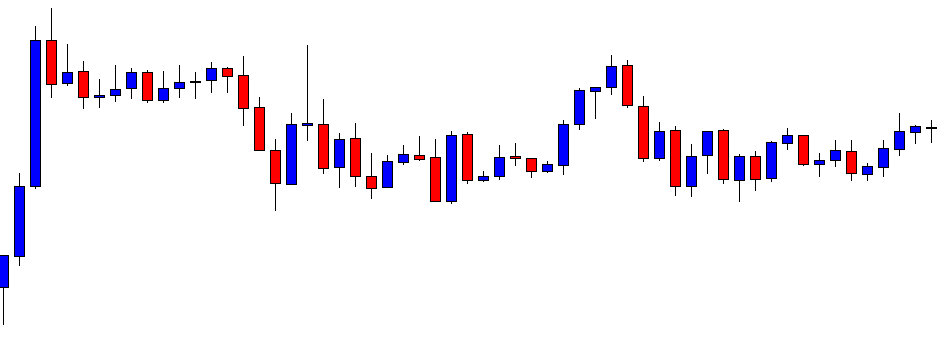
This is how the 15M chart looks. The buyers may wait for a 15M candle to close above the last H1 candle’s close. The chart suggests that the level of support is a strong one, which may push the price towards the North with good bullish momentum.
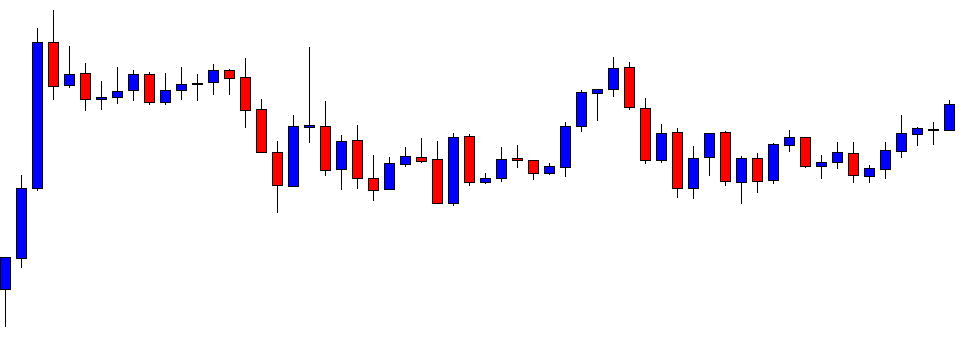
The last candle comes out as a bullish candle closing above the last H1 candle’s resistance. The buyers may trigger a long entry right after the candle closes by setting stop loss below the level of support. We find out the level take profit with the help of Fibonacci levels.
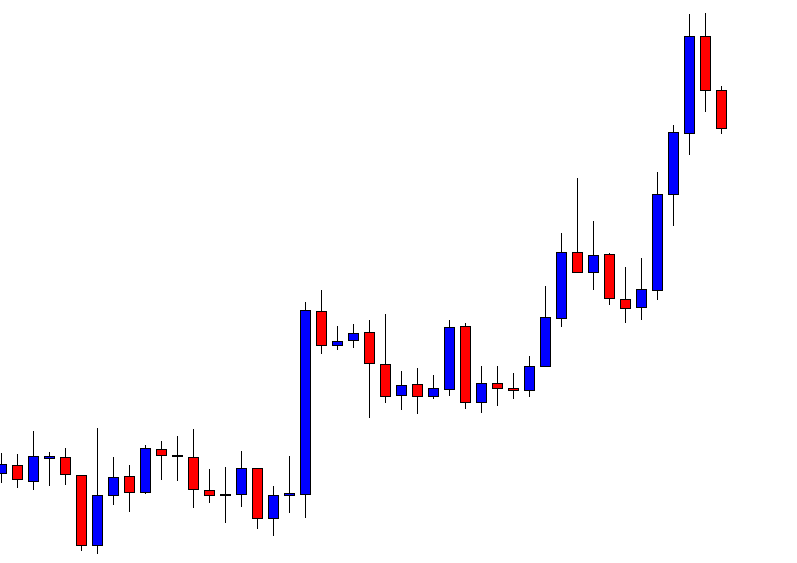
See how the price moves towards the North. The price makes a bullish move and makes a new higher high. It makes a bearish correction and then heads towards the North again. Let us draw the Fibonacci extension on the chart.
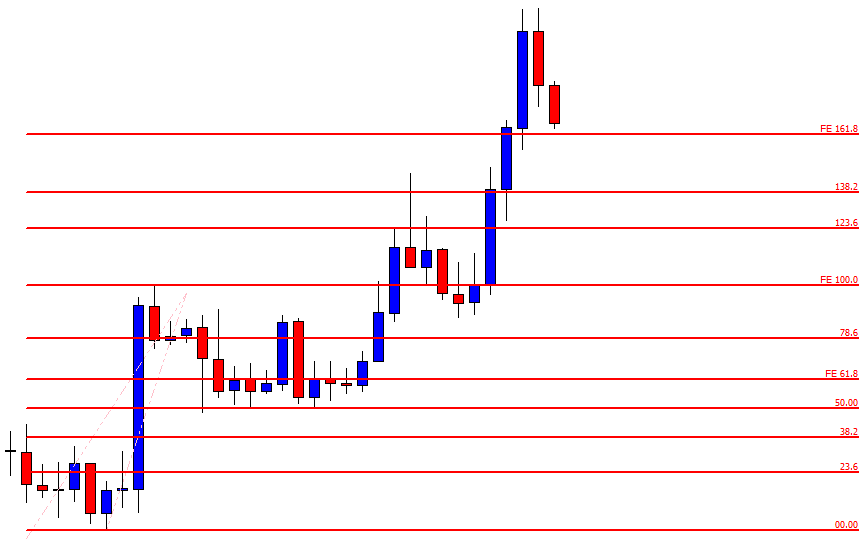
The Fibonacci level shows that the price hits 161.8%. It goes even further up. It makes a bearish correction before producing the last wave. The level of 100% works as a level of support.
We have seen how important it is that the 15M chart produces a bullish continuation candle to offer an entry. At the first reversal, the price does not head towards the North since the chart does not produce any 15M bullish continuation. On the second occasion, it produces a bullish continuation, and the buyers find an opportunity to go long and push the price towards the magic Fibonacci level of 161.8%


