
In today’s lesson, we are going to demonstrate an example of a Tweezer Top forming at a significant Fibonacci level. We’ll find out the impact of a tweezer top in the chart. Let us get started.
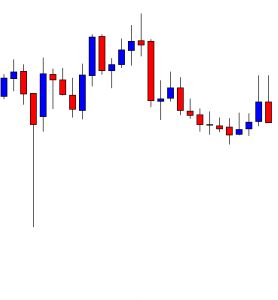
The chart shows that the price has a rejection at a level of resistance twice. At the second bounce, it produces a doji candle. A doji candle is not considered a strong reversal candle. If the next candle comes out as a bearish engulfing candle, the sellers may keep their eyes in the pair to look for short opportunities.
The next candle comes out as a bearish engulfing candle. It makes a strong statement that the bear has taken control. Double top support, along with a bearish engulfing candle, usually attracts more sellers to look for short opportunities.
The price consolidates and finds its resistance. The chart produces a bearish engulfing candle. The sellers may go short right after the last candle closes with 1R. Let us proceed to the next chart to find out how the entry goes.
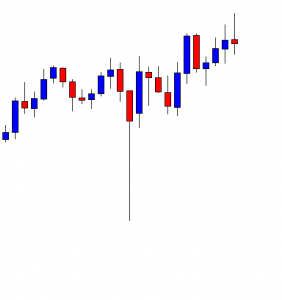
The chart shows that the price heads towards the South with good bearish momentum. It hits 1R at a moderate pace. It finds its support again and heads towards the North to make a bullish correction. Look at the last two candles. The first candle comes out as a bullish candle, and the last candle comes out as a bearish candle, both having a long upper shadow. The combination of these two candles is called “Tweezer Top”. Tweezer Top is considered one of the strongest bearish reversal patterns. Those two upper shadows suggest that the price has a strong rejection at the level of resistance. The bearish body of the last candle suggests that the bear may take over. Another point we may consider whether it is produced at a significant level or not. By drawing the Fibonacci extension, we may find this out. Let us draw Fibonacci extension and find out how far the price travels towards.
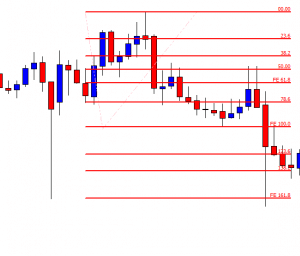
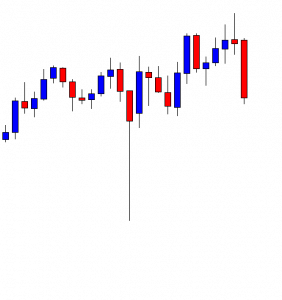
We see that Tweezer Top is formed right at the 61.8% level. Usually, the 61.8% level drives the price towards the level of 161.8%. This is what happens here, as well. The price hits the level of 161.8% within the next candle.
We know how handy drawing Fibonacci level can be in trading. Especially, 61.8% and 38.2% level plays a very significant role in driving the price with good momentum. If we get a strong reversal pattern such as Tweezer Top or Tweezer Bottom, it adds more pressure. Thus, the traders do not have to wait long to achieve their target.