Categories
Forex Videos

Types For Noobs! How To Apply Our Free Signals & Make Money For Free


How to apply Forex Academy trade signals to your own trading account?

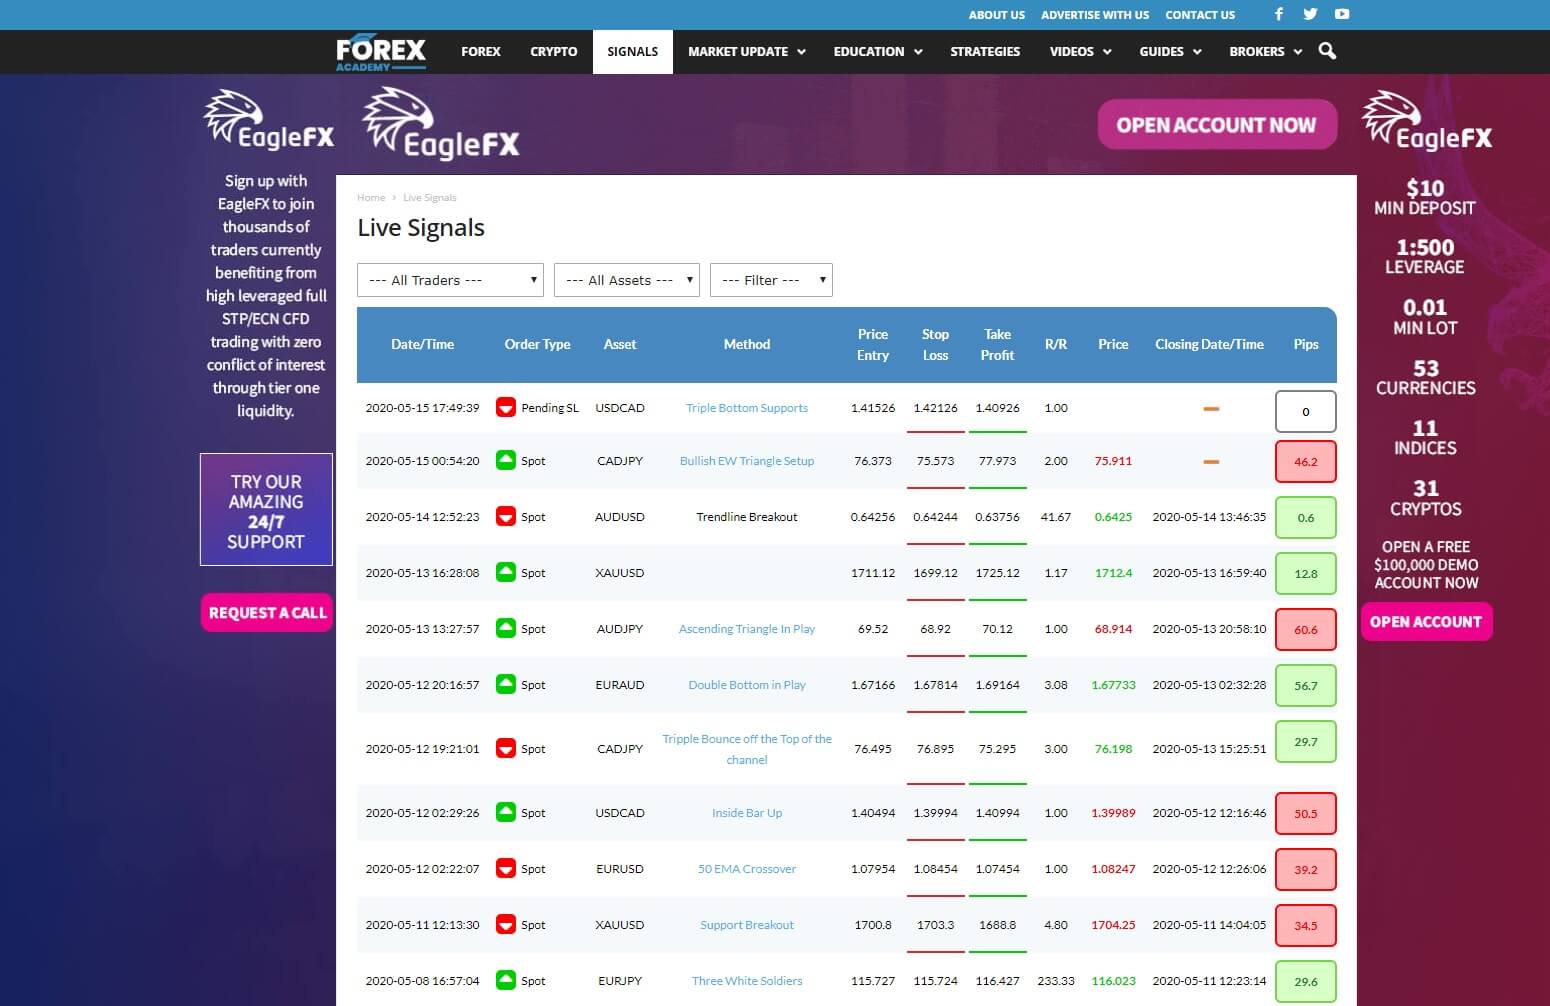
Ok, you have seen the Forex Academy signals table and the incredible success our professional Traders are enjoying, and you want to start copying some of the trades onto your own account, but you are a novice trader and a little bit unsure what to do next.

This presentation is designed to assist you with such tasks. Let’s take a look at a couple of examples of how you can go about applying the trades from the signals table on to your own trading account.


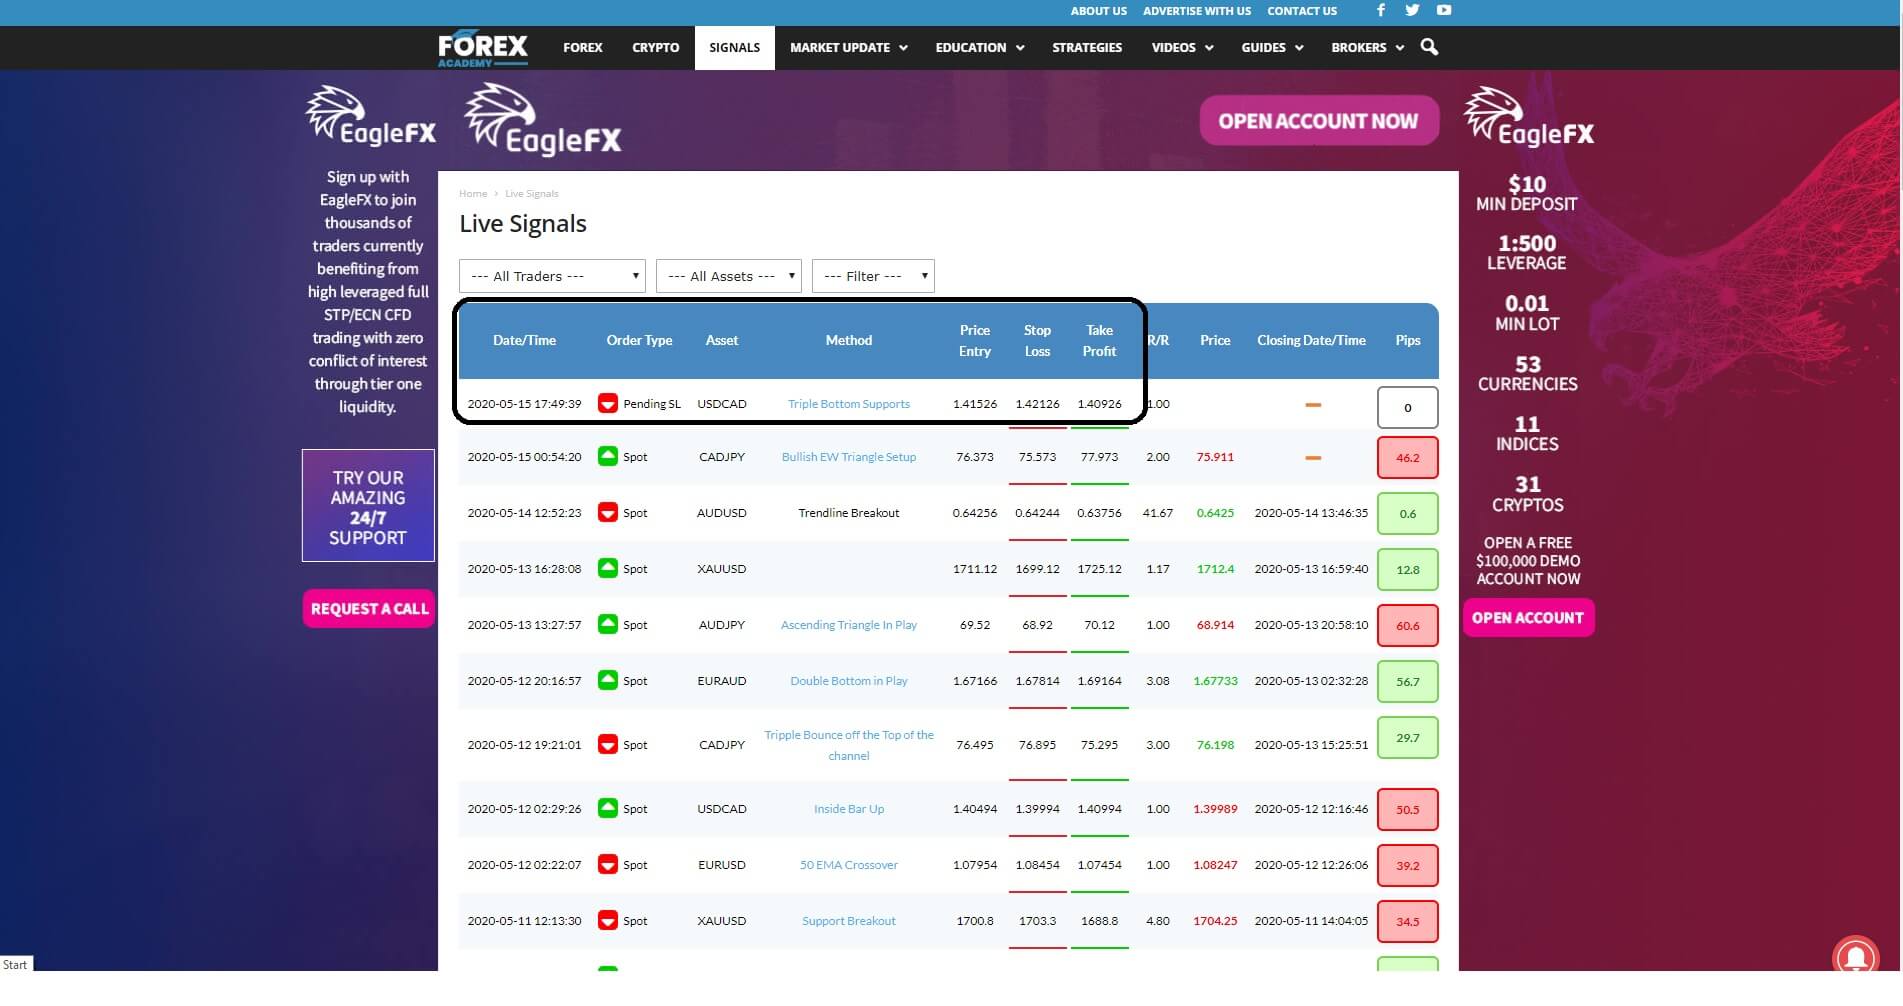
Let’s drill down into this pending order for the US dollar CAD trade at the top of the table.

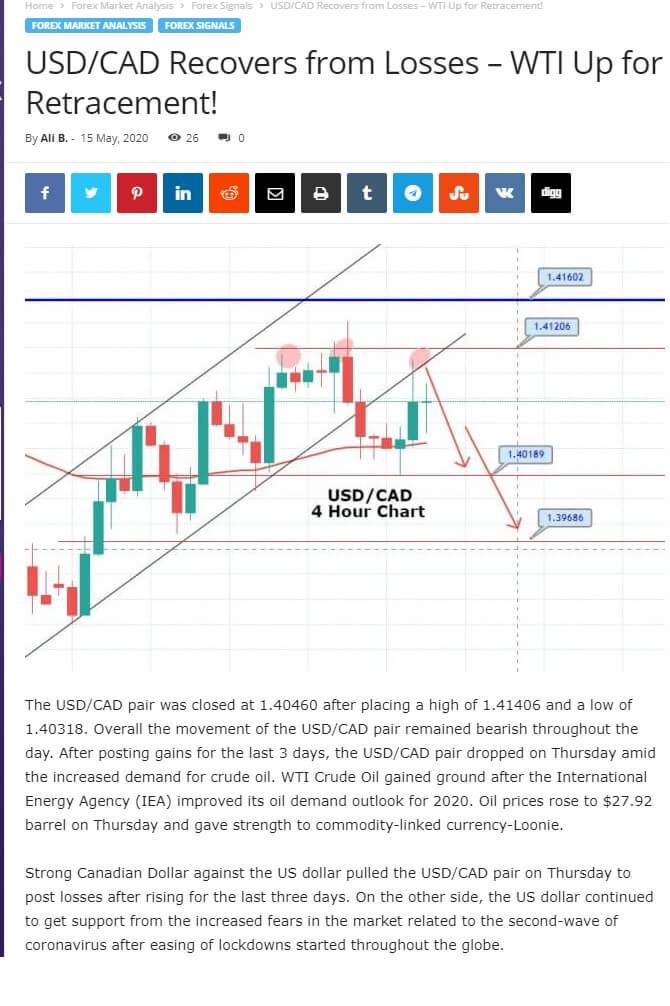
We can presume that you have clicked onto the Method tab to have a look at the traders’ technical analysis and overview; you agreed with the sentiments and decide that you want to take this trade on by applying the price entry, take profit, and stop-loss on to your own trading platform.


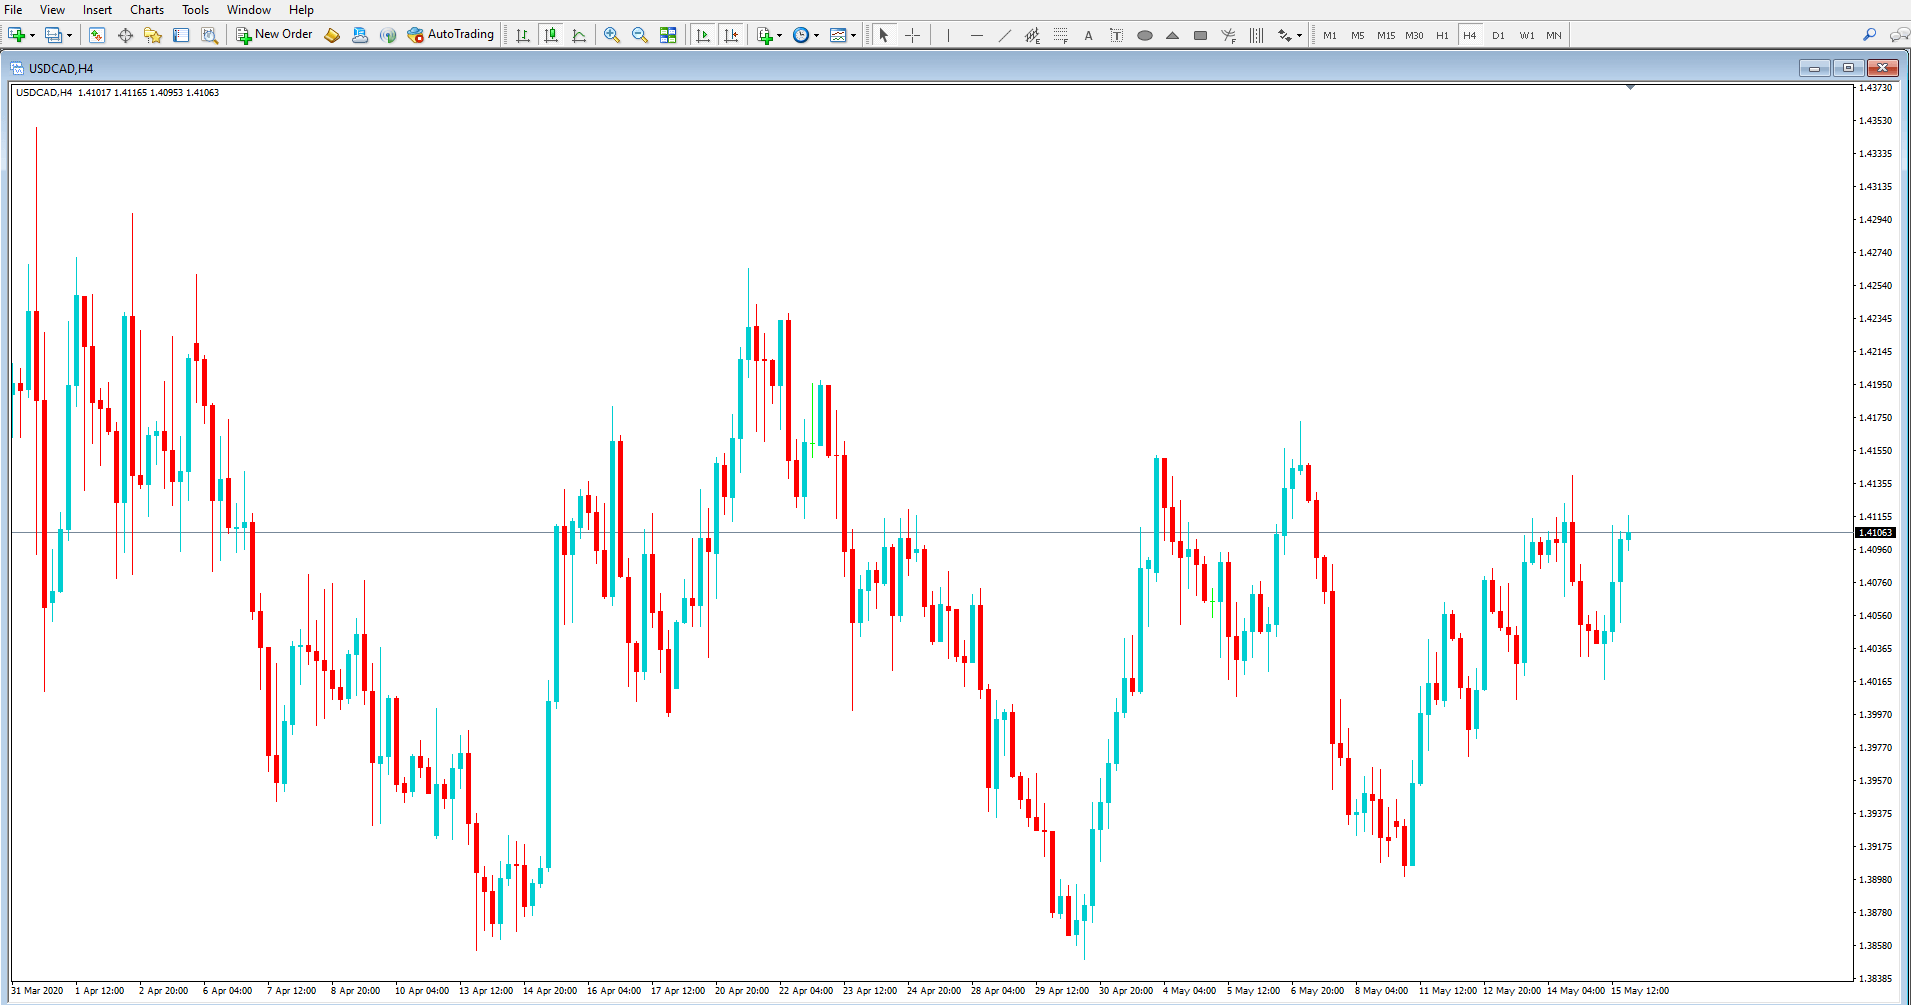
The most common trading platform which is offered by the majority of brokers is the Metatrader mt4 platform, and so we assume that you are using this platform, in which case you should open it up and select the US dollar CAD chart. You don’t have to add technical analysis.


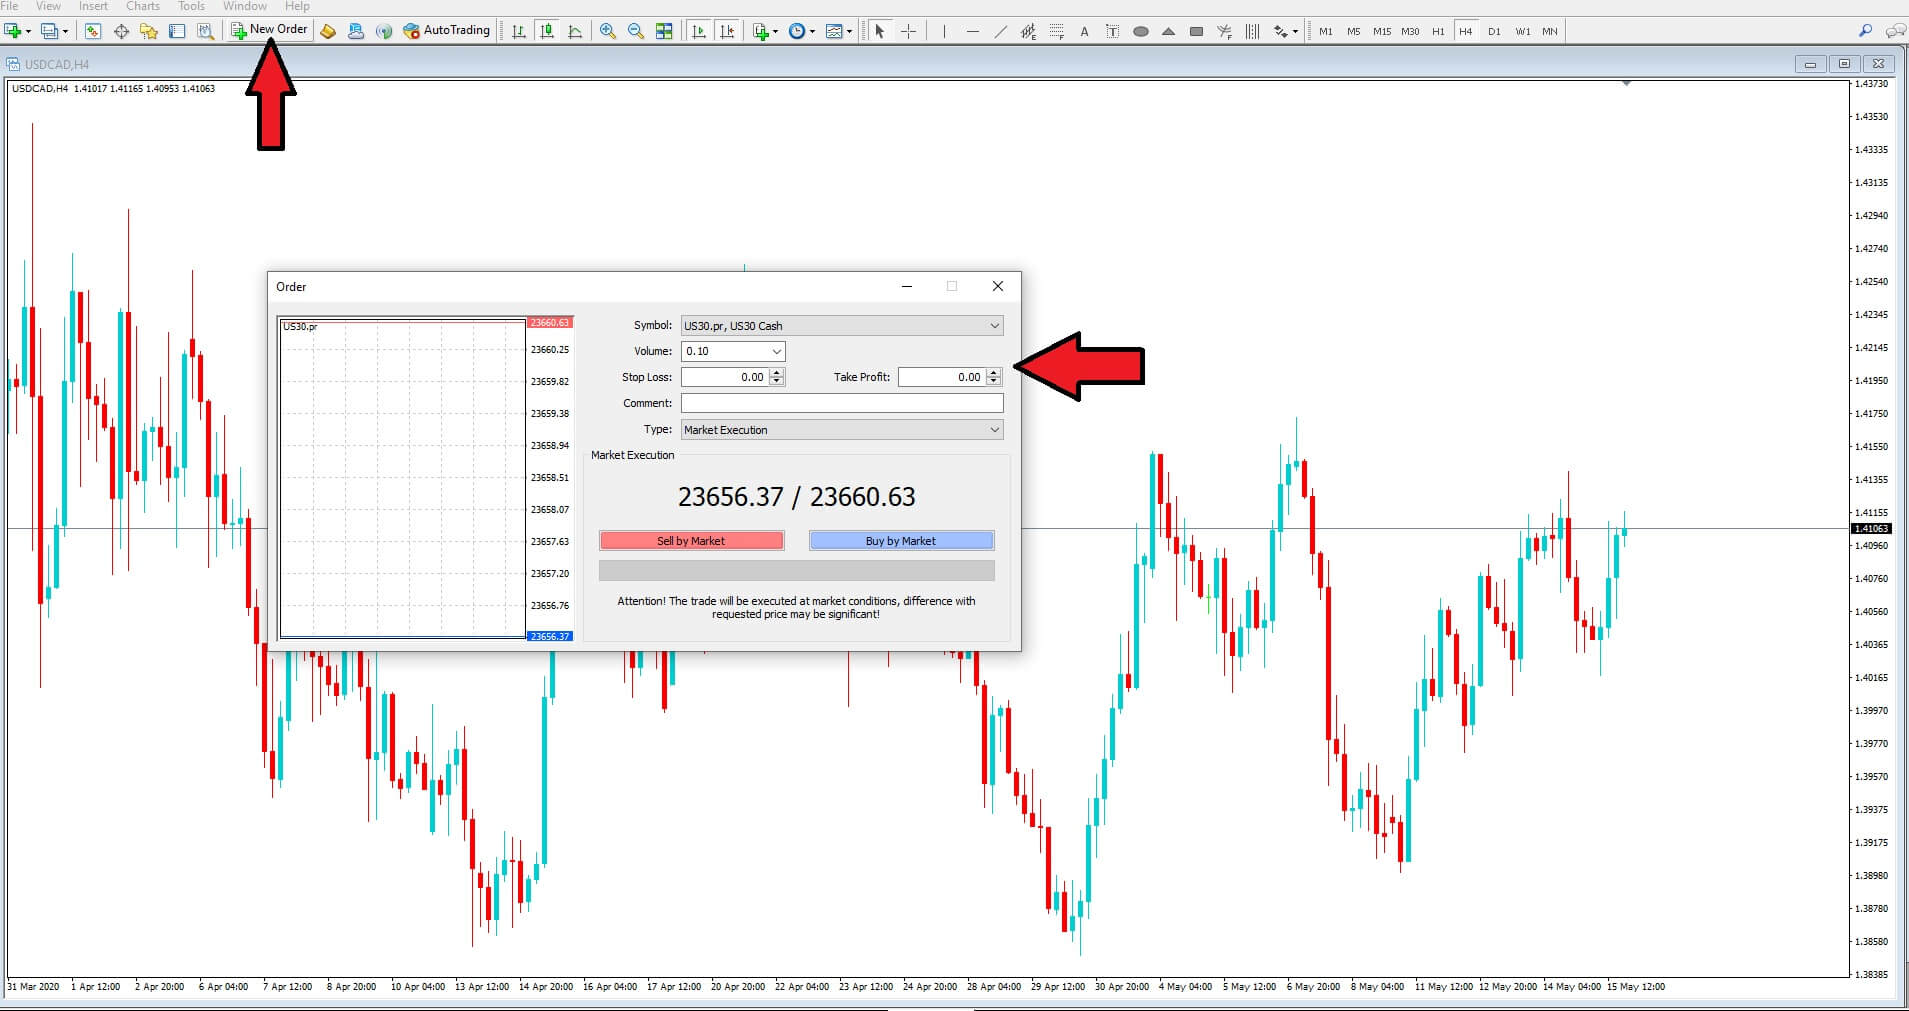
Click on the New Order tab, and an order box will pop up onto your screen.


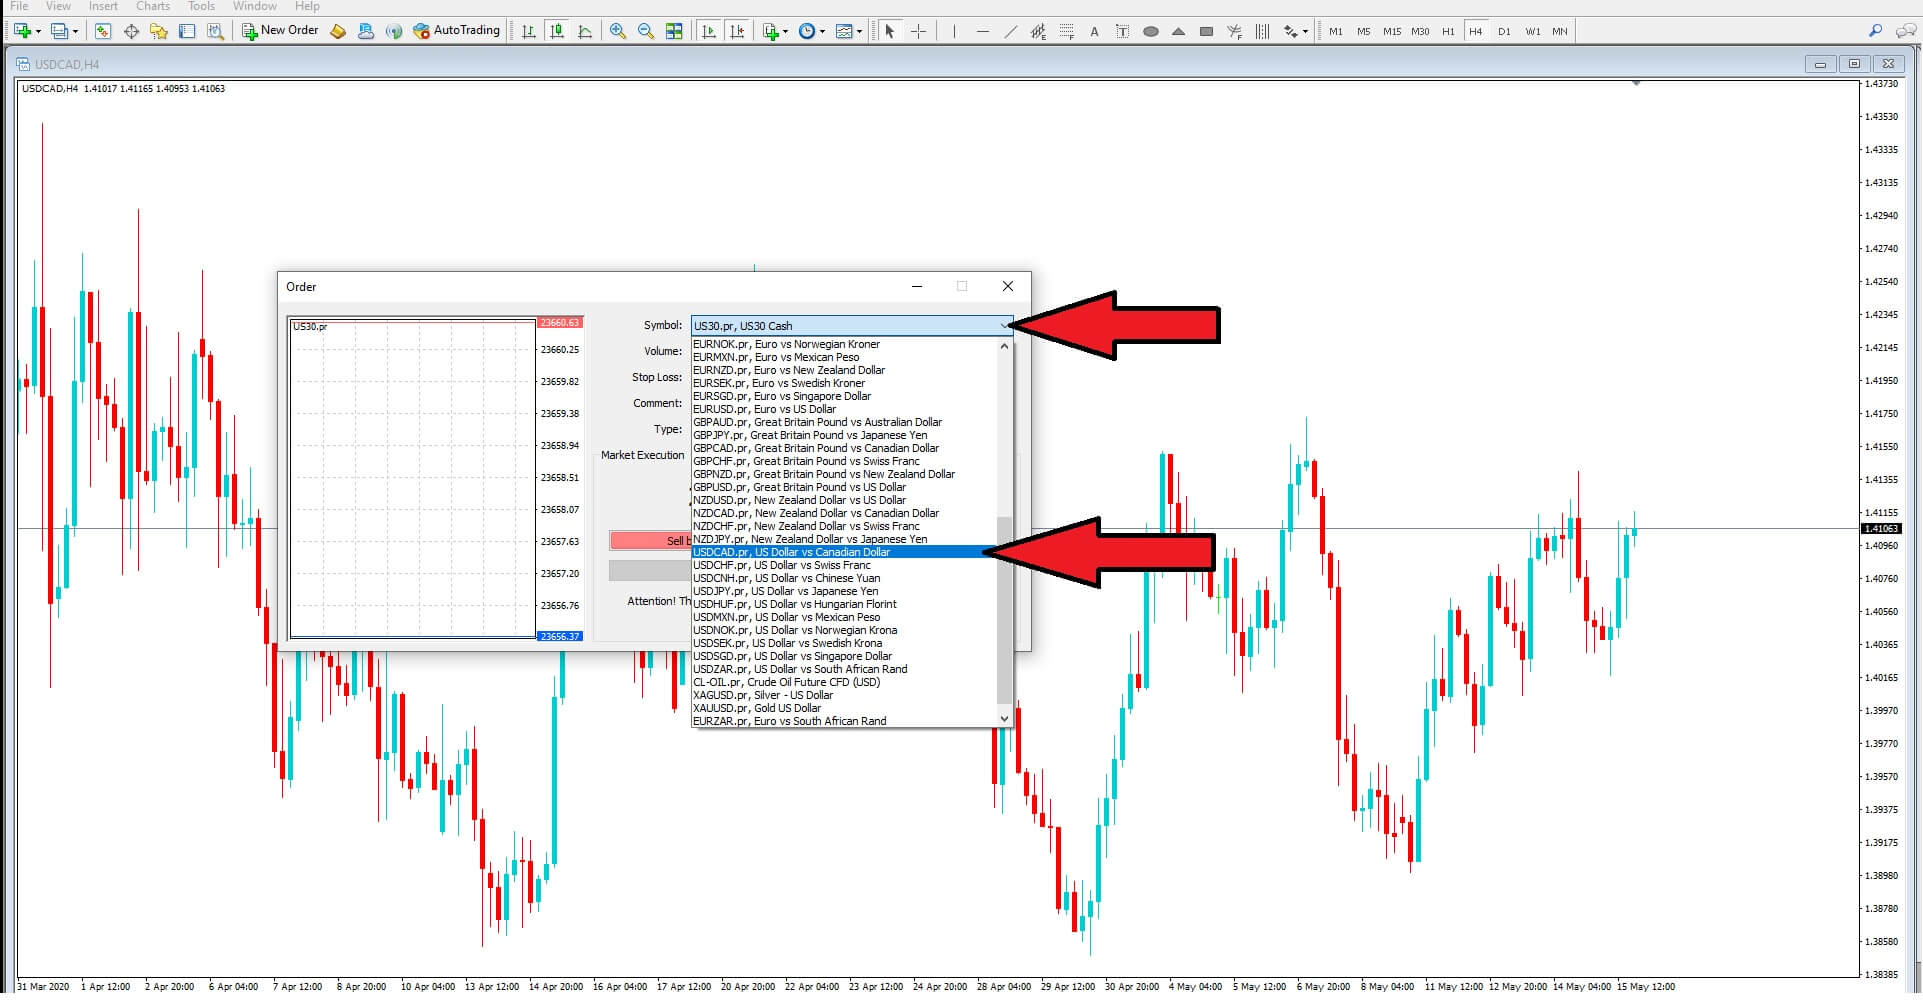
Click onto the symbol drawdown panel to select the US dollar CAD asset.


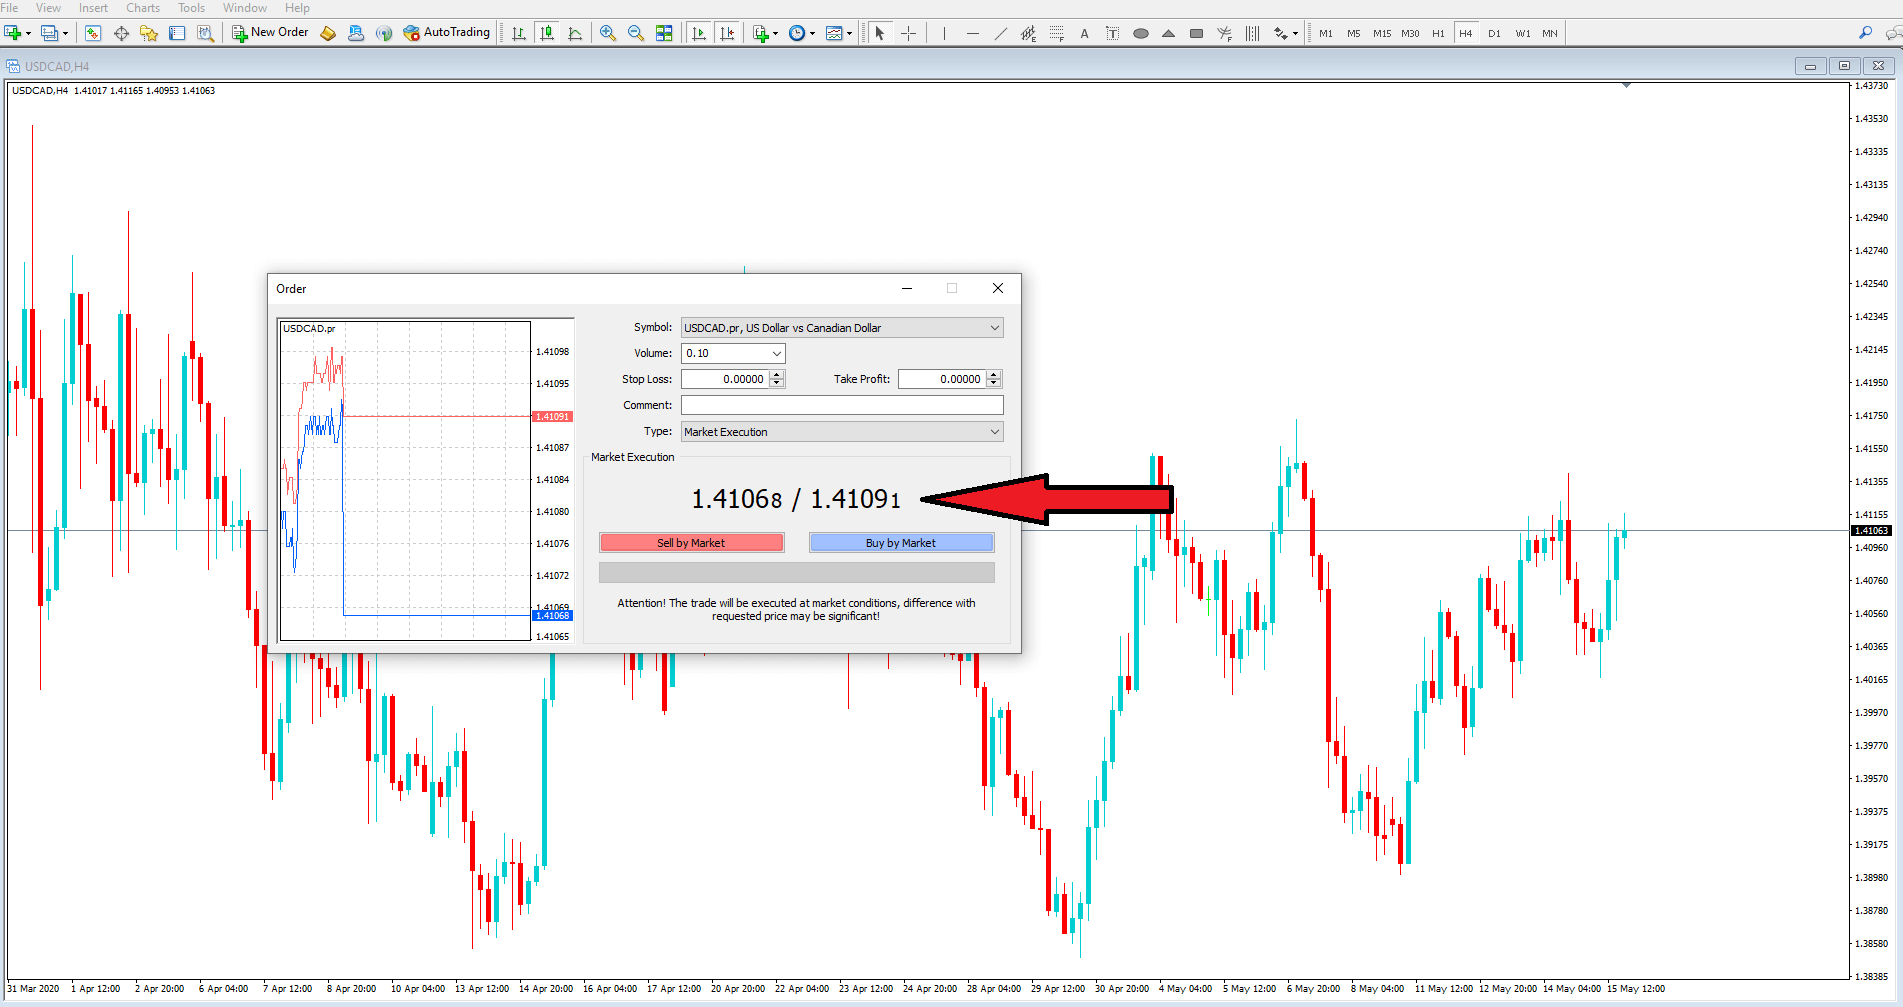
The price will then change to the current exchange rate for this pair.
If this was an instant execution, you would simply sell-by market or buy the market by clicking on the relevant price paddles, which are colored red and blue.


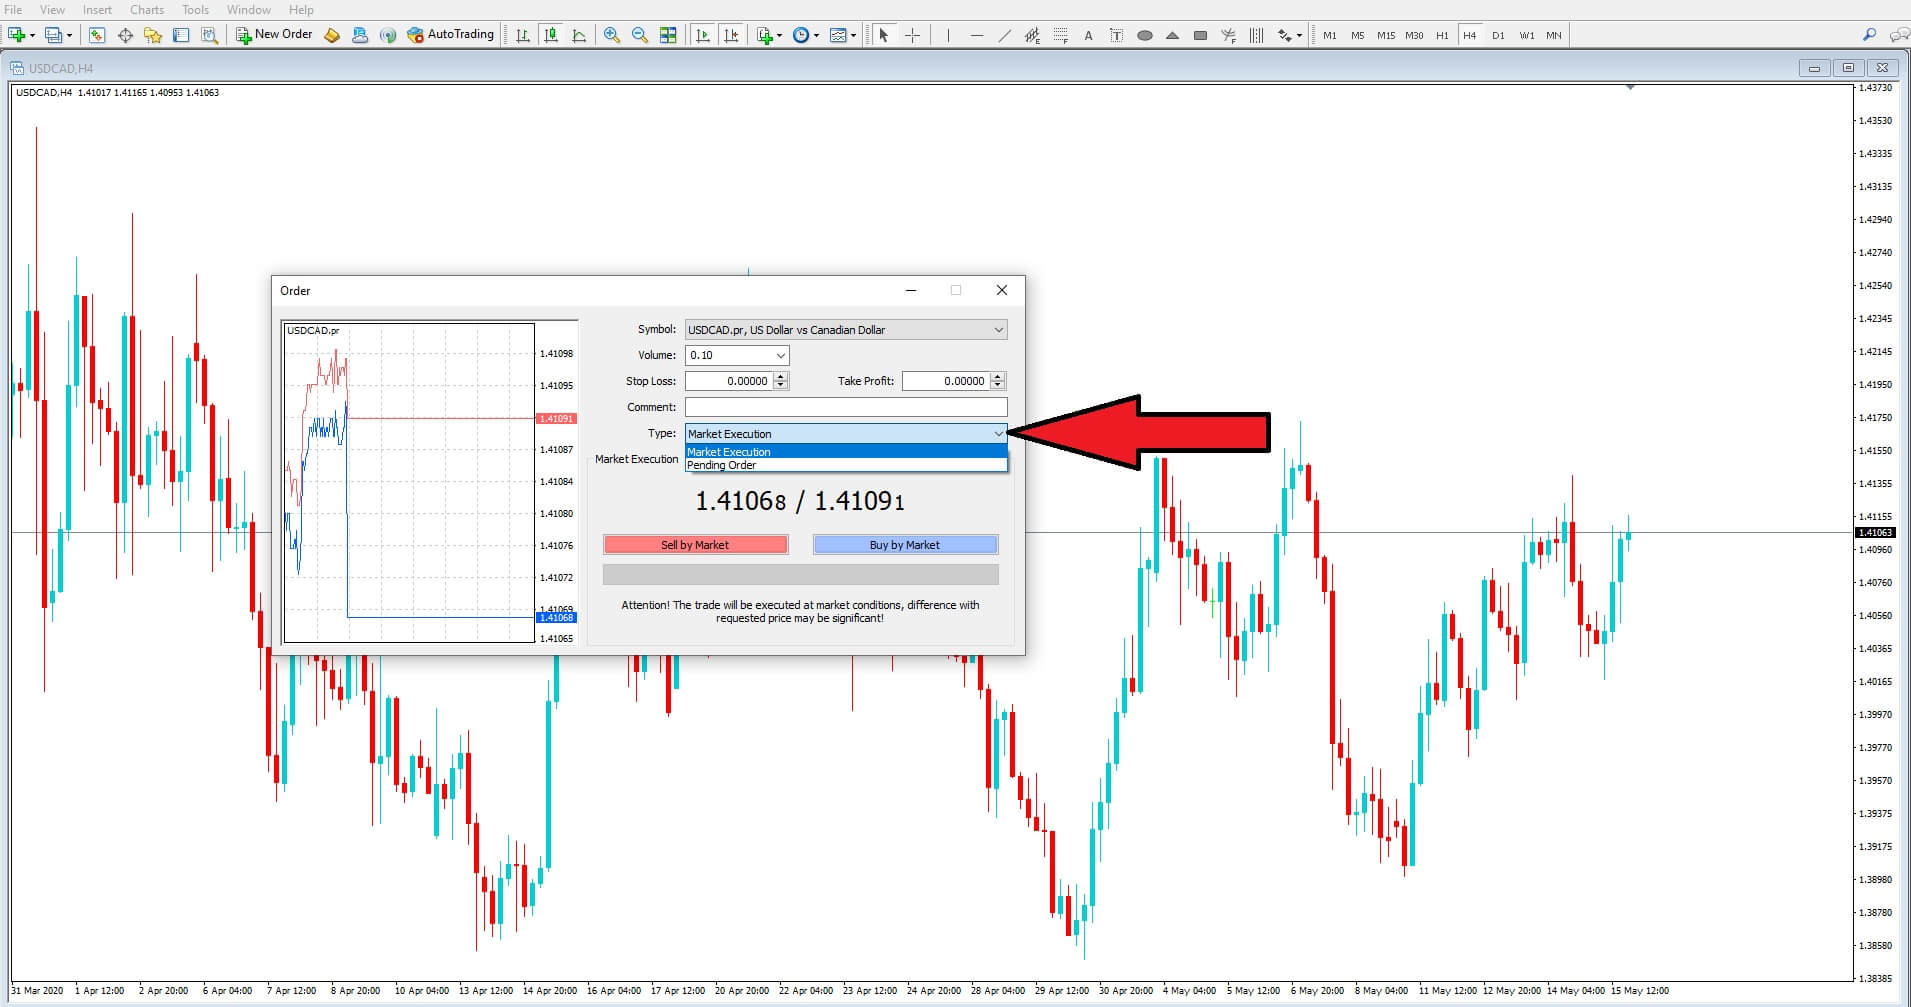
However, this is a pending order which we need to select from the type of trade drop-down menu.

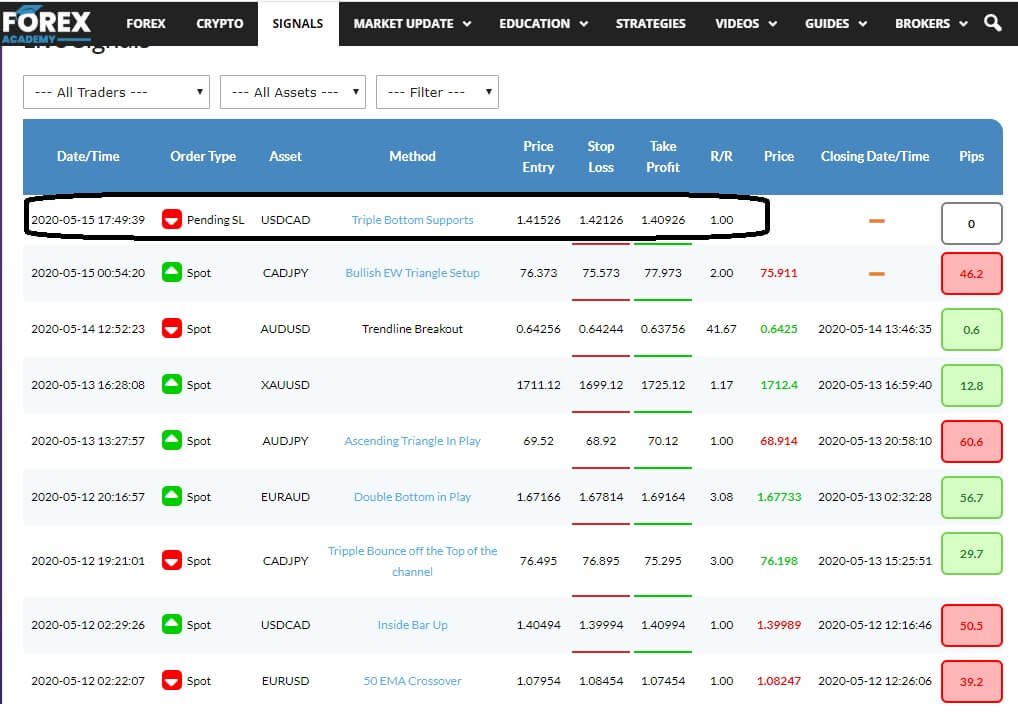
Let’s quickly remind ourselves of the trade we are copying. this is a Sell-limit pending order of the US dollar Cad pair, with an order to sell the pair at some point in the future with no specified cancellation date at an exchange rate of 1.41526 with a stop loss of 1.42126 and a take profit of
1.40926. This represents Minus 60 pips or plus 60 pips, where the risk to reward has a ratio of 1:1. So for every unit traded in a standard lot of 1.0, which equals 10 units of the base currency traded, you would win or lose $600. Or if traded with a mini lot equal to 0.1 unit of volume you would win or lose $60 and if you were trading in micro-lots of 0.01 units of volume you would win or lose $6


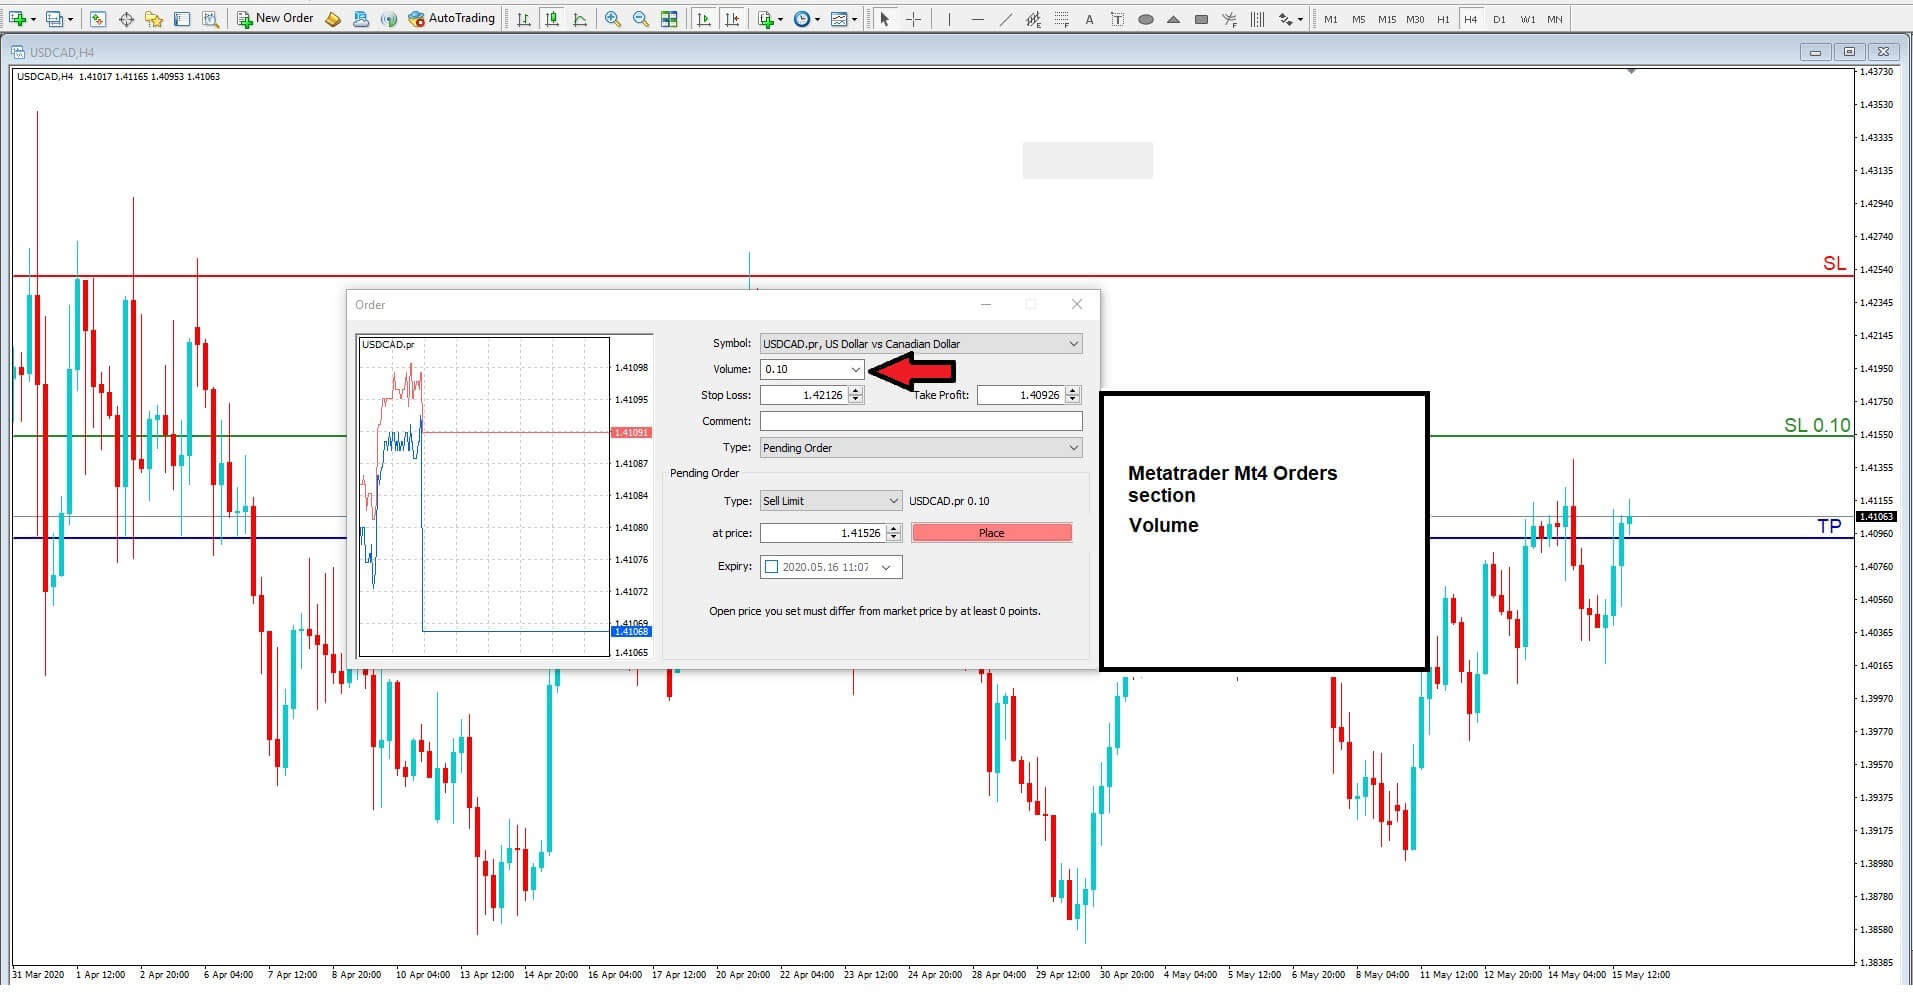
We now take this information and add it to our order box. Firstly you will need to put in the volume of currency you want to trade. Here we have added a volume of 0.10 units, which equates to around about $1 for every pip in movement.
We then complete the stop loss box by entering in the exchange rate 1.42126, the take profit at

1.40926, and then in the pending order section itself, click on the sell limit for the type of pending order. Enter an exchange rate of 1.41526.


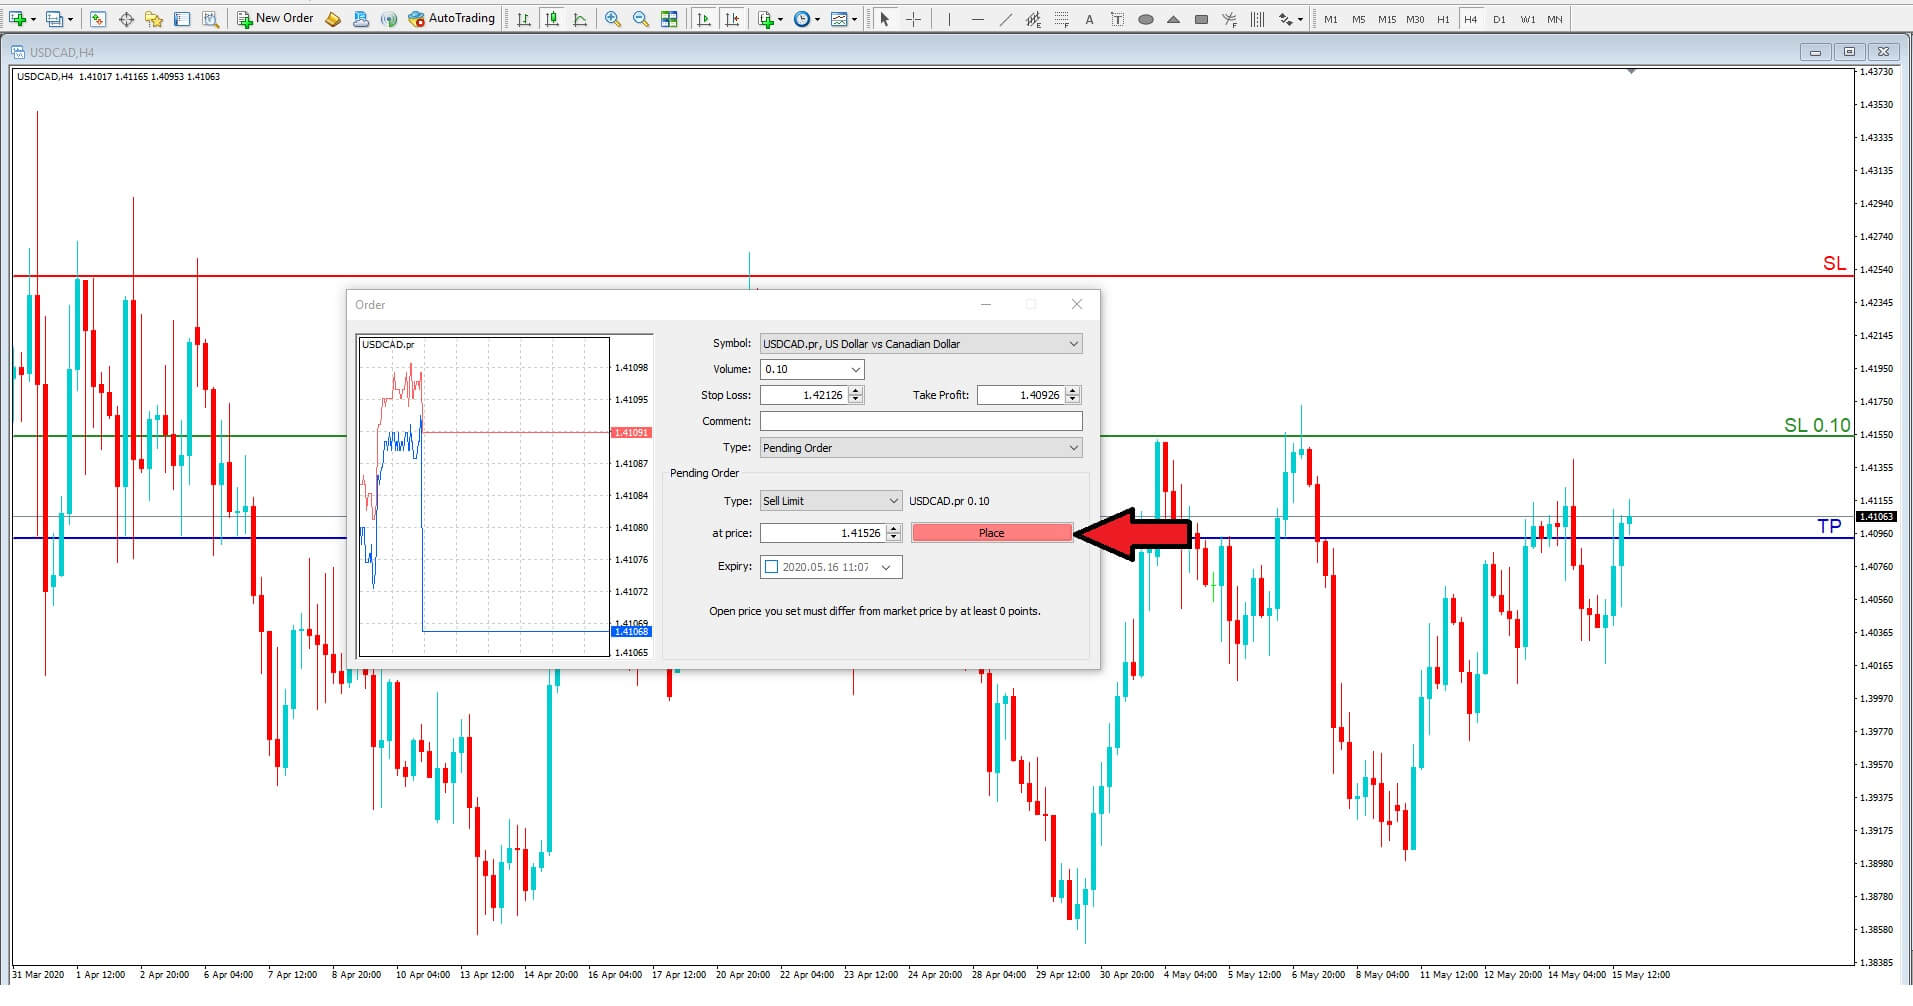
Then simply click on the place tab, and if the server accepts your trade, it will be confirmed by three lines popping up on to your chart. One is the sell limit order with the volume you have chosen at the exchange rate at which the trade will be executed if the price reaches it at some certain point. The second will be the level at which the trade will be stopped out should it move against you, and the setup fail. And the third line is the take profit where the trade will close out if price action moves to this exchange rate level should the trade have been opened having gone to plan.


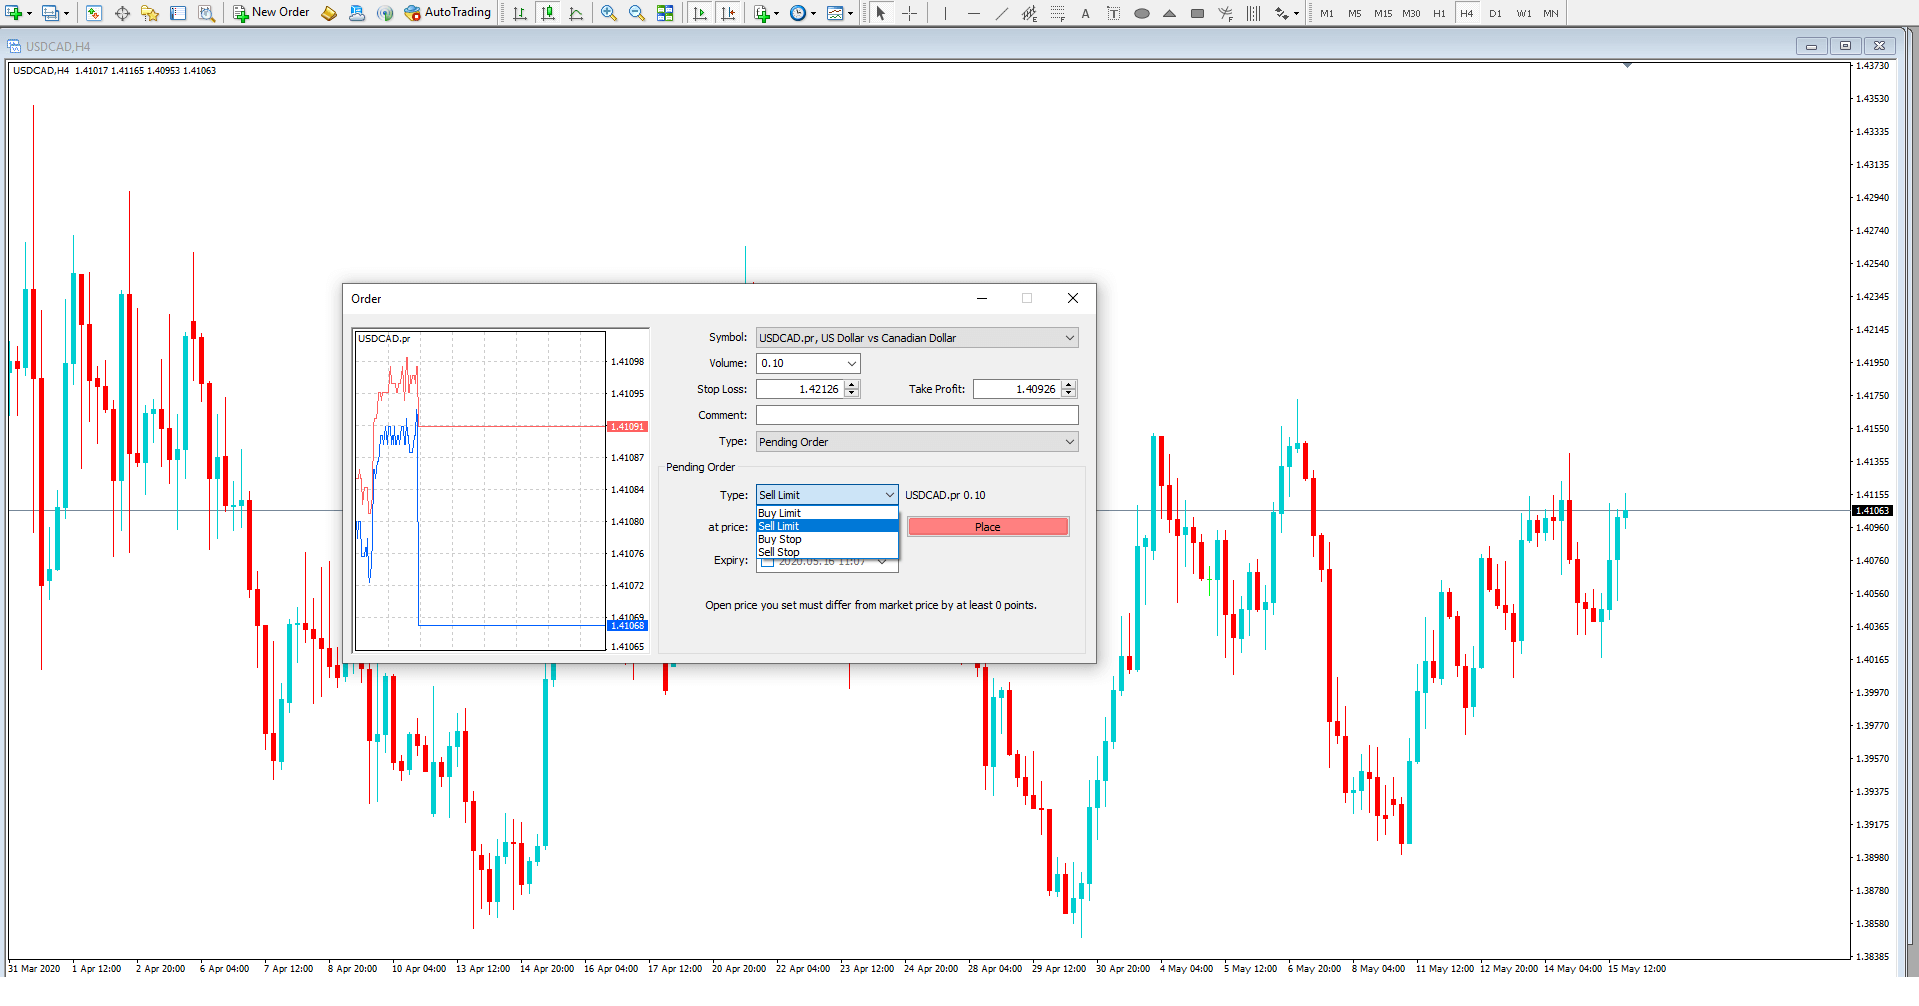
Should the trade you are looking at copying require a different type of pending order this can be found in the order type drop-down box and will include buy limit, sell limit, buy stop and sell stop orders.


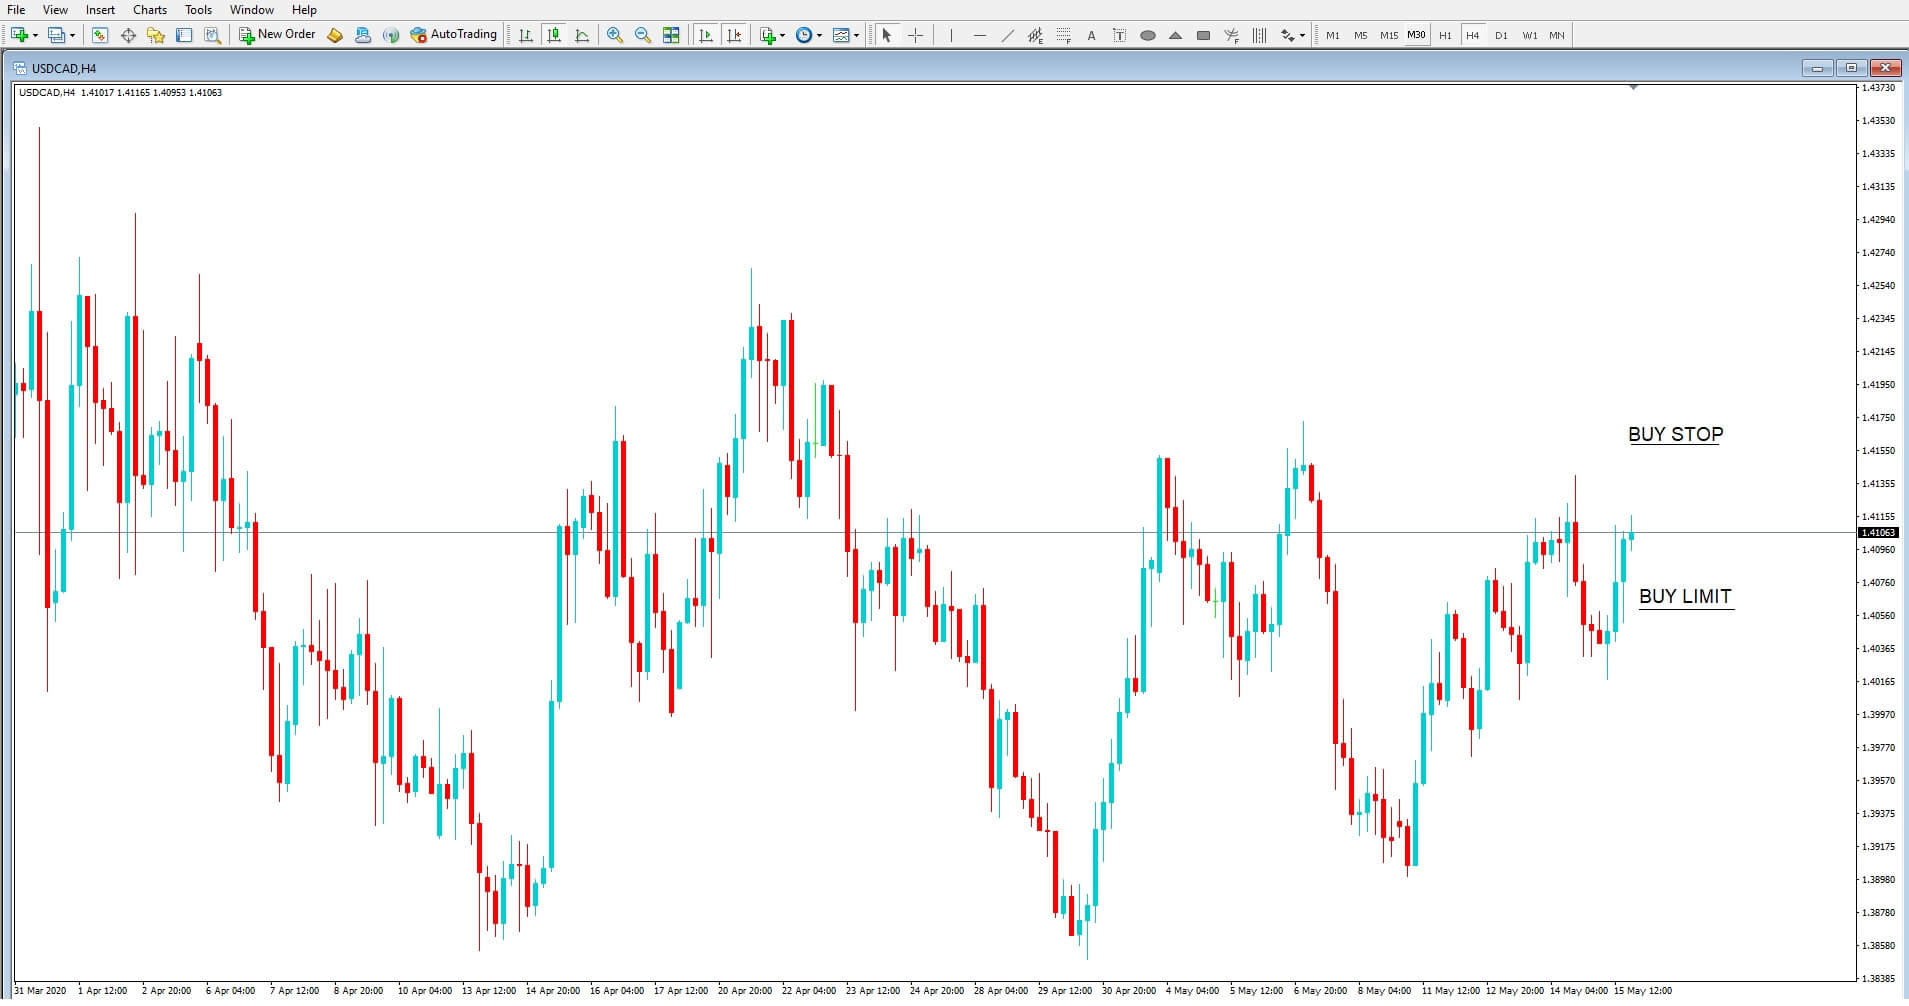
Different types of pending orders are buy-limit, where a trader expects that the current exchange rate will fall lower before continuing in an upward trend, In which case he would use a buy limit order to enter a trade at a lower point than the current exchange rate.
Or the trader would use a buy stop order to enter a trade which is above the current exchange rate, and where he or she might use such an order anticipating that an upward trend would continue.


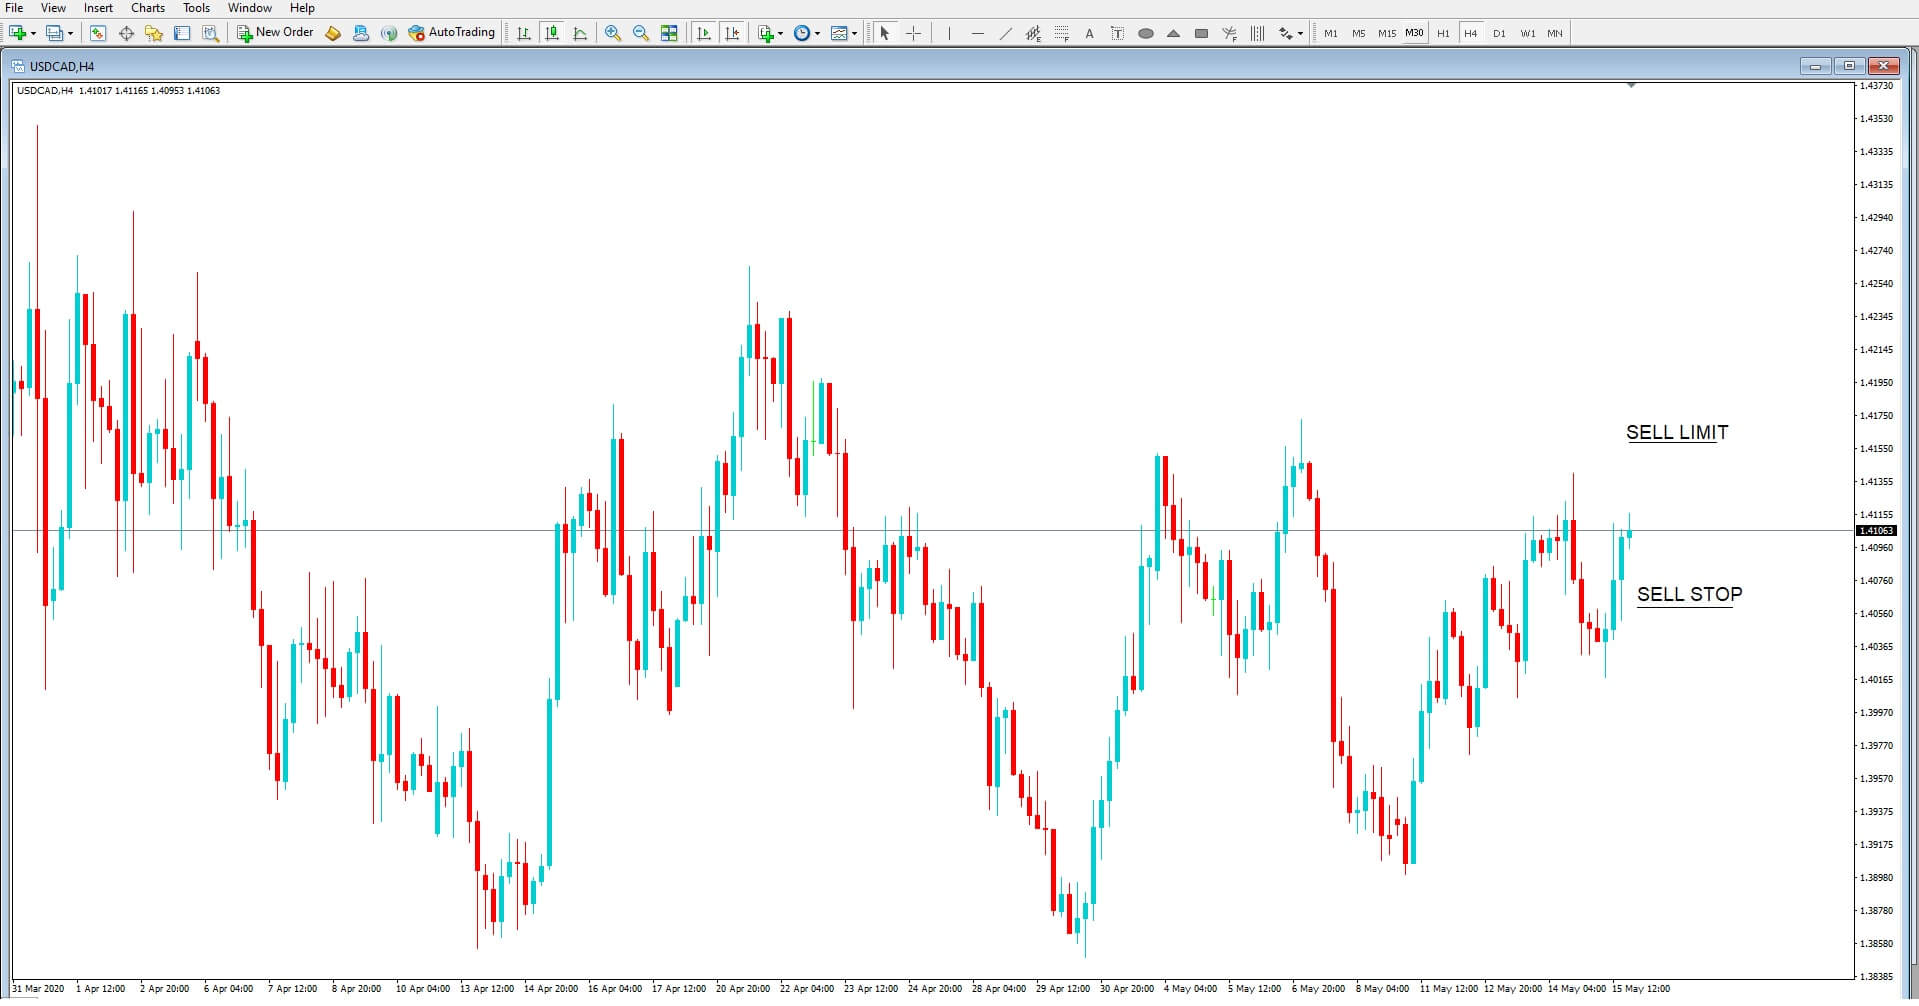
Conversely, a trader would use a sell limit pending order if they thought that the exchange rate was going to move slightly higher before reversing into a downward trend. This provides them with the possibility of gaining some extra pips. Or they use a sell stop order where they presume the exchange rate will move lower than where it is currently.
Other trading platforms have similar trade order systems, and so if you are not using the MT4, you will just need to research a little to find the trade execution setups.


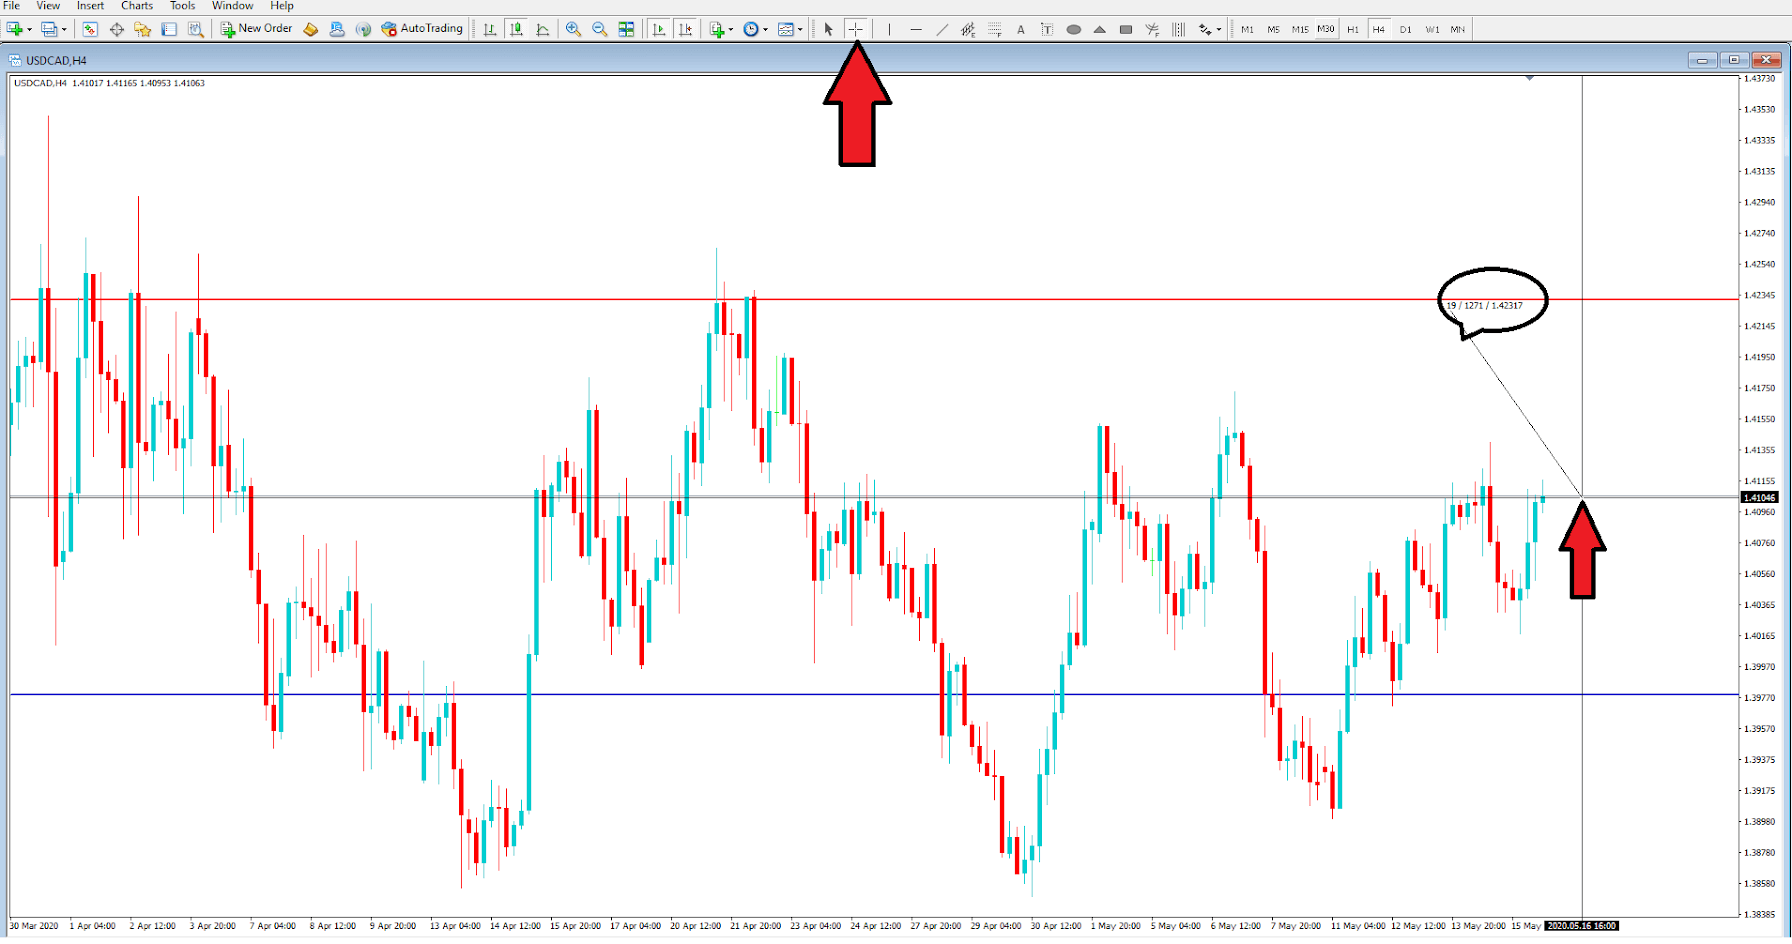
To calculate your risk, most platforms, including the MT4 offer a cross-hair feature which you can drag onto your chart and by clicking on the current price exchange rate, or anywhere else, you can drag the cross-hair to any level on your chart, and it will show you the number of pips that you might lose or gain. In this example we can see that should a trade be executed at the current exchange rate the level to the stop loss we have chosen by the introduction of the red line is 127 pips away, and where one pip typically will equate to one US dollar with a volume of 0.10 units traded.

On that basis, if we were to go short on this pair at the current exchange rate with the current stop loss in place, we would have lost $127 should the pair have moved up to our stop loss. We can also simply drag the cross-hair lower to calculate possible winnings in pip amount values too.

Categories
Forex Market Analysis

Daily F.X. Analysis, May 15 – Top Trade Setups In Forex – U.S. Retail Sales in Highlights!

On the news front, the economic calendar remains busy on Friday. Today’s releases may trigger some price action in the Euro and U.S. related pairs, especially on the release of German GDP, Eurozone Flash GDP, and U.S. core retail sales figures, which are due to come out during European and U.S. session respectively.

Economic Events to Watch Today 


EUR/USD – Daily Analysis

During the early Asain trading session, the EUR/USD currency pair flashing green, but remains trading in the confined range around above the 1.0800 level ahead of Germany’s preliminary gross domestic product (GDP) for the first quarter. The broad-based U.S. dollar modest weakness helping the currency pair to stay positive and kept a lid on any additional losses, at least for now. For example, the currency pair is looking directionless as the S&P 500 is sidelined, and the Asian stocks are adding in a mixed performance. 

The EUR/USD is trading at 1.0806 and consolidates in the range between the 1.0798 – 1.0809. However, the traders are keenly awaiting Germany’s preliminary gross domestic product ahead of a strong position.

At the data front, Germany’s preliminary gross domestic product (GDP) for the first quarter, which is scheduled to publish at 06:00 GMT, is anticipated to show the old continent’s biggest economy declined by 2.2%, having increased by 0.4% in the final 3-months of 2019. It should be noted that the GDP prints of -2.2% or lower would be considered the worst reading since the ist-quarter of 2009. 

Germany had declared a secure national lockdown on March 22, which meant the economic activity came to a stop only in the last 8 or 9 of the 1st-quarter. In contrast, Germany is dependent on the dragon nation, which had already faced a sharp recession in the activity in the first two months of the year, mainly due to the coronavirus pandemic.

Therefore, there are many chances that Germany reporting a bigger-than-expected recession in the first quarter will not be rejected. As we already mentioned, the economists are expecting a 2.2% decrease, as per Germany’s DIW economic institute, the economy expected declined by 2% in the first quarter. Alternatively, the DIW expects a 10% decline in the GDP in the second quarter. 

Moving on, the EUR/USD currency pair may not pay any significant attention if the GDP prints in line with estimates as the market already priced in the worst condition of significant economies during the March and more so in April caused by coronavirus outbreak.

The currency pair could be able to take bids only if prints would be a surprise beat on expectations, but the gains would be temporary or short-lived if the risk sentiment turns heavy. Looking forward, market participants now look forward to Germany’s preliminary gross domestic product (GDP) for the first quarter, which is scheduled to publish at 06:00 GMT. The trade/virus updates could also entertain market traders.

Daily Support and Resistance

  • S1 1.0673
  • S2 1.0758
  • S3 1.079
  • Pivot Point 1.0843
  • R1 1.0874
  • R2 1.0928
  • R3 1.1013

EUR/USD– Trading Tip

On Friday, the EUR/USD is trading at 1.0807, bouncing off over the double bottom support level of 1.07756. On the 4 hour chart, the EUR/USD is closing bullish candles above upward channel trendline, but at the same time, the 50 EMA and horizontal resistance seem to drive bearish sentiment for the EUR/USD pair. Extension of selling below 1.0843 level may lead the EUR/USD prices towards 1.07782 level, and below this, the next support is likely to be found around 1.0730. Consider staying bullish above and bearish below 1.0770 level today. 


GBP/USD – Daily Analysis

The GBP/USD currency pair failed to stop its 5-day losing streak and dropped below the 1.2210 level while representing 0.15% losses on the day mainly due to the Brexit worries and coronavirus crisis. The broad-based U.S. dollar over-all bullish sentiment also weighed on the currency pair and kept the pair down. The GBP/USD is trading at 1.2208 and consolidates in the range between the 1.2203 – 1.2237. However, the traders are cautious about placing any strong position as they are keenly awaiting today’s U.S. consumer-centric data.

At the Brexit front, the European Union (E.U.) and the United Kingdom moderators are still pushing to cancel Brexit talk, which decided to happen through video conferences. At the same time, the European Commission’s (E.C.) took legal action against the U.K., which made talks tougher to happen. The European Commission initiated legal proceedings against the U.K. on Thursday, while accusing the U.K. about failing to comply with E.U. law on free movement which eventually keeps the cable currency under pressure and contributes to the pair’s declines.

On the flip side, the UK PM Boris Johnson keeps its preference high toward border checks at the Northern Ireland (N.I.) while the N.I. Secretary Brandon Lewis has repeatedly said there shall not be a border down the Irish Sea.

At the coronavirus front, the infected cases by coronavirus reached around 233 thousand overall in England, including 25 thousand in London,

as per the latest research by the Public Health England (PHE) and Cambridge University. In the meantime, the United Kingdom is talking with Swiss drugmaker Roche Holding AG about to buy an accurate COVID-19 antibody test after getting preliminary approval by the European Union and the United States.

Apart from this, the Bank Of England governor Andrew Bailey showed a willingness to take further action but denied rate cuts. The reason for the pairs bearish moves could also be attributed to the statement of the British central bank’s citizen panel in which they expect COVID-19 to have a large and enduring influence on the economy and society more broadly.

At the USD front, the broad-based U.S. dollar bolsters by the receding expectations of negative Fed rate and the increased probabilities of further stimulus from the government. While the Dollar Index (DXY), a gauge of the greenback versus significant currencies, remains mildly bid around 100.30 by the press time.

Daily Support and Resistance

  • R3 1.2577
  • R2 1.2508
  • R1 1.2422

Pivot Point 1.2353

  • S1 1.2268
  • S2 1.2198
  • S3 1.2113

GBP/USD– Trading Tip

On the last trading day of the week, the GBP/USD is trading sideways at 1.2200 after breaking below the narrow trading range of 1.2320 – 1.2245. The Cable has formed a new range of 1.2245 – 1.2186, however it’s still holding below 50 EMA, which is extending resistance around 1.2260 level today. On the 4 hour chart, the GBP/USD is gaining support at 1.2180 level while the 50 EMA and horizontal resistance stay at a level of 1.2245. 

The violation of the sideways trading range of 1.2245 – 1.2180, and the release of U.S. retail sales may help drive breakout in the GBP/USD pair. 

The GBP/USD pair may lead its prices towards an immediate support level of 1.2190 and 1.2150 in case of positive date; elsewhere, the GBP/USD pair may soar towards 1.2240 and 1.2310. 


USD/JPY – Daily Analysis

The USD/JPY pair was closed at 107.224 after placing a high of 107.363 and a low of 106.773. Overall the movement of the USD/JPY pair remained bullish throughout the day. After dropping below 107 level on Thursday, the USD/JPY pair regained its strength and posted gains for the day on the back of the improved market sentiment. The increased claims for jobless benefits from the United States during the last week failed to weigh on the U.S. dollar. A total of 2.9M Americans applied for unemployment benefits in the previous week against the expected 2.5M.

At 17:30 GMT, the Unemployment Claims for last week exceeded the expectations of 2500K and came in as 2981K and weighed on the U.S. dollar. The Import Prices for April were declined by 2.6% against the forecasted decline by 3.1% and supported the U.S. dollar.

The U.S. Dollar Index ignored the job data from the United States and moved above 100.40 level on Thursday, which helped USD/JPY pair to stretch its gains. Another factor adding in the upward trend of the USD/JPY pair was the comments from Donald Trump in support of the dollar. He said that a strong dollar was a great thing that could help in fast economic recovery after the coronavirus, this triggered the U.S. dollar buying wave and extended USD/JPY pair’s gains.

From the Japan side, at 4:50 GMT, The M2 Money Stock for the year from Japan was recorded as 3.7% against the forecast of 3.4% and supported Japanese Yen. At 10:59 GMT, the Prelim Machine Tool Orders for the year showed a decline of -48.3% in comparison to the previous -40.7%. 

Daily Support and Resistance    

  • R3 109.37
  • R2 108.57
  • R1 108.12

Pivot Point 107.33

  • S1 106.88
  • S2 106.09
  • S3 105.64

USD/JPY – Trading Tips

The safe-haven Japanese yen continues to trade in line with our previous forecasts. On Friday, the USD/JPY traded bearishly to trade below the support level of 107, which marked the 50% Fibonacci retracement level. The USD/JPY is holding at 107.05, where the 50 EMA is supporting the pair, and it may drop further below the 107 level. At the moment, the 4-hour candle appears to close below 107 support become resistant, and this may drive more selling in the USD/JPY pair. The pair may extend selling until 106.600 level, whereas the closing of buying candles above 107 can trigger bullish bias until 107.50. By the way, bearish bias seems solid today. All the best for today! 

Categories
Crypto Videos

Crypto Trading For Beginners!

The Easiest Profitable Bitcoin Strategy

So many traders struggle with making a profit in the volatile crypto market. They test several indicators by themselves or maybe even in a couple of indicators together, but with no success. Even if they found success during a bull market phase, they started losing money once the market changed directions.

Backtesting

Harry Nicholls backtested various crypto trading indicators in order to find the one that works best. He tested RSI, Stochastic, Bollinger Bands, MACD, Parabolic SAR, and Ichimoku Cloud.

All of the strategy parameters were kept to default. What he found out is that, at the time of the experiment, some indicators performed better than the other. While some netted over 20% gains overall, some lost over 15%.

If we take his research up to here, we can clearly see that the MACD is the clear winner among the indicators tested. However, is it? While the MACD was profitable and netted 22.51% after over three years of trading, the market itself went from $300 to, at one point, $19,900, which is far more than 22.51%.

The Buy and Hold method

After seeing that, he implemented the Buy and Hold method, which simply bought in the first time the indicator notified that it is a good time to buy, and held until the present. As the picture shows, the gains are immeasurable compared to the previous ones. The worst-performing indicator was Parabolic SAR, with the gains of 2,125.07%, just under 100 times the gains of MACD trading.

It is clear that the Buy and Hold method works so much better than trading based on one indicator, which is the whole point Nicholls was trying to make. Relying on just one trading indicator or tool is simply far too unpredictable for constant trading. Inexperienced traders do not have to dive into trading head-first and lose a lot of money in order to learn how to profitably trade. They can rather learn on the go while investing safely, as Bitcoin and the rest of the crypto market are already making amazing gains by themselves.

Categories
Crypto Videos

Crypto! The Most Important Altcoin Trading Rule!


The Most Important Altcoin Trading Rule

While most people are introduced to cryptocurrencies through Bitcoin investing and trading, the cryptocurrency market is much more than just Bitcoin. There are countless altcoins out there that compete with Bitcoin or try to solve some other problems existing in the world.
Whether traders support certain altcoins or not, the fact is that altcoins trading can be extremely profitable. However, not many people know how to properly trade altcoins as the profit has to be tracked both against the fiat currencies and against Bitcoin.

Altcoin Trading

Altcoin trading is not much different from Bitcoin trading in terms of indicators and tools traders use to trade it. It is just as volatile and just as predictable (or rather unpredictable) as Bitcoin is. However, one main difference is that it is highly correlated to Bitcoin and that altcoins traders need to take Bitcoin’s price movement into consideration when trading altcoins.
When Bitcoin moves in the same directions altcoins are moving, traders need to think of whether their money will grow more while sitting in Bitcoin or altcoins. When Bitcoin is about to move in the opposite direction to altcoins, traders have to think about whether altcoins will be “pulled” in Bitcoin’s direction, and how much. In a market where Bitcoin’s price is stable, altcoins trading certainly becomes superior to just holding Bitcoin as traders can make greater profits off of altcoins price fluctuations.
Altcoin traders need to watch the general trend of the specific altcoins as well as Bitcoin’s trend prior to engaging in trades.

Conclusion

This guide should be considered advice to all traders willing to go into altcoins trading. As with everything, with more risk comes more opportunity, and altcoins trading is no different. If you learn to incorporate and merge Bitcoin analysis with altcoins analysis, your altcoins trading will be far more profitable.

Categories
Forex Market Analysis

Daily F.X. Analysis, May 14 – Top Trade Setups In Forex – U.S. Jobless Claims in Focus! 

The reason for the risk-off market sentiment could be attributed to the latest disagreeability about negative rates showed by Fed Chair Powell as well as Powell’s comments on the economy keep the market risk-tone heavy and helping the greenback to take bids. Let’s wait for the U.S. Jobless claims to predict further price action in the market. 

Economic Events to Watch Today 


EUR/USD – Daily Analysis

The EUR/USD currency pair flashing red and dropped from 1.0896 to 1.0812 on Wednesday while representing 0.10% losses on the day and currently drawing offers near below 1.0810 mainly due to the broad-based U.S. dollar strength in the wake of risk-off market sentiment. The reason for the risk-off market sentiment could be attributed to the latest disagreeability about negative rates showed by Fed Chair Powell as well as Powell’s comments on the economy keep the market risk-tone heavy and helping the greenback to take bids. The EUR/USD pair is trading at 1.0808 and consolidates in the range between the 1.0804 – 1.0825. However, traders are keenly awaiting the U.S. key data ahead of placing any strong position.

As we already mentioned that the market participants avoided risker assets and started buying the U.S. dollar mainly due to the risk-off market sentiment in the wake of renewed growth concerns. The Federal Reserve’s chairman gave warning on Wednesday about the scope and speed of the ongoing economic downturn while compared the slowdown pace with the World War II recession. Whereas, the Fed Chair Powell hints that the ongoing recession could be for the long-term if Congress fails to provide additional fiscal support.  

Moreover, the Fed Chair Powell said we are not looking forward to keeps the negative rates. As well as, the Cleveland Federal Reserve President Loretta Mester said, “Negative rates not a tool we think we would use to support the economy. The reasons for the heavy risk-tone could also be attributed to the US-China tussle. It should be noted that the recent fire shots of words from China came after the U.S. President Trump ended Federal retirement savings fund from diversifying into the Chinese stocks.

On the other hand, the final German Consumer Price Index for April, which is scheduled to release at 06:00, could fail to leave any strong impact on the market until or unless the number prints significantly below estimates. As in result, the shared currency may face stronger bearish moves. At the coronavirus front, the number of confirmed coronavirus cases increased to 172,239, with a total of 7,723 deaths reported according to the latest figures from the German disease and epidemic control center, Robert Koch Institute (RKI).

On the other hand, from the United States, the PPI data came in poor than expected and was almost ignored by the market traders. The Producer Price Index from the U.S. for April was dropped by -1.3% against the forecasted -0.5%. The Core PPI from the U.S. for April also dropped to -0.3% against the expectations of -0.1%. The U.S. dollar ignored the data and was supported by Powell’s speech on Wednesday, so the strong U.S. dollar dragged down the upward movement of EUR/USD pair on Wednesday and ended the pair’s day with a bearish candle. 

Market participants look forward to the key U.S. data, which highlights the U.S. Initial Jobless Claims, scheduled to release at 12:30 GMT, and final German Consumer Price Index for April, which is scheduled to release at 06:00, as these key data could influence the market moves. The trade/virus updates also will be key to watch.

Daily Support and Resistance

  • S1 1.0722
  • S2 1.0783
  • S3 1.0811

Pivot Point 1.0843

  • R1 1.0871
  • R2 1.0904
  • R3 1.0964

EUR/USD– Trading Tips

On Thursday, the EUR/USD price dropped to test the support level of 1.0800, which is extended bu the upward channel. On the chart, the EUR/USD os closing a Doji above upward channel trendline, but at the same time, the 50 EMA and horizontal resistance seems to drive bearish sentiment for the EUR/USD pair. Continuation of selling until 1.0778 level may lead the EUR/USD prices towards 1.07782 level, and below this, the next support is likely to be found around 1.0730. 


GBP/USD – Daily Analysis

During Thursday’s early Asian trading hours, the GBP/USD currency pair failed to stop its 4-day losing rally and dropped around 1.2200 while representing 0.26% losses on the day mainly due to the Wednesday’s downbeat performance of the U.K. data. The Brexit and coronavirus fears also weighed on the British Pound. Moreover, the broad-based U.S. dollar bullish trend in the wake of risk-off market sentiment keeps the currency under pressure. At the press time, the GBP/USD currency pair is currently trading at 1.2189 and consolidates in the range between the 1.2187 – 1.2242. However, traders are keenly awaiting the U.S. Jobless Claims for near-term direction in the greenback.

As we already mentioned that the reason for the pair’s declines could be attributed to the multiple factors, like downbeat U.K. fundamentals, comprising sluggish data, coronavirus outbreak, Brexit worries, and most impactful is U.S. dollar strength.

The broad-based U.S. dollar is taking bids due to its safe-haven demand in the wake of risk-off market sentiment. Also, the Federal Reserve’s latest disagreeability from the negative rates bolstered the U.S. dollar strength. As well as, the ongoing uncertainty about coronavirus and the US-China trade war also keeps the market risk-tone heavy, which also contributed to the greenback’s gains. The U.S. Dollar Index that tracks the greenback against a basket of other currencies gained 0.03% to 100.317 by 11:47 AM ET (4:47 AM GMT).

However, the risk-off market sentiment further bolstered by the second wave of virus spread in major economies as well as the US-China tussle. At the U.K. data front, yesterday’s downbeat performance of the U.K. data urged the British Chancellor Rishi Sunak to say that there are many chances that the Uk economy will suffer in the deeper recession this year, and we’re already in the middle of that as we speak.

Powell said that Fed would continue using its tools in the betterment of economic recovery; however, it would need White House and Congress by its side for new fiscal aid. Powell stressed that the outlook of the economy was still uncertain, and risks remain downside. He did not give any signals about the negative interest rates and said that the need for them has not yet come. The pair dropped to 1.2210 level after Powell’s speech on the back of U.S. dollar strength on Wednesday and ended its day with a bearish candle.

Daily Support and Resistance

  • R3 1.2577
  • R2 1.2508
  • R1 1.2422

Pivot Point 1.2353

  • S1 1.2268
  • S2 1.2198
  • S3 1.2113

GBP/USD– Trading Tip

The GBP/USD bearish at 1.2200 after breaking below the narrow trading range of 1.2320 – 1.2245. The Cable is still holding below 50 EMA, which is extending resistance around 1.2350 level today. On the 4 hour chart, the GBP/USD is gaining support at 1.2185 level while the 50 EMA and horizontal resistance stay at 1.2365 level. Today, the U.S. jobless claims may drive the selling trend in the GBP/USD pair to lead its prices towards an immediate support level of 1.2190 and 1.2150. Conversely, the worse than expected Jobless Claims will lead the GBP/USD pair towards 1.2240 and 1.2310. 


USD/JPY – Daily Analysis

The USD/JPY pair was closed at 107.025 after placing a high of 107.275 and a low of 106.741. Overall the movement of USD/JPY remained Bearish throughout the day. The USD/JPY extended its previous day’s losses and continued its downward movement on Wednesday to post losses for the 2nd trading session

The pair followed the previous bearish trend in the early trading session, but after the speech from Jerome Powell, pair started to recover some of its daily losses and move in the reverse direction. However, the pair USD/JPY failed to reverse its direction due to poor than expected PPI reports from the U.S.

At 4:50 GMT, Japan’s Bank Lending figure for the year exceeded the expectations of 2.0% and came in as 3.0% in favor of Japanese Yen. The Current Account Balance from Japan’s Ministry of Finance showed a decline to 0.94T against the forecasted 1.29T for March. At 10:02 GMT, the Economy Watchers Sentiment dropped to a low of 7.9 against the forecasted 10.1 and showed that current economic conditions were not right.

Furthermore, Safe-haven Yen was also supported by the growing fears of the second wave of coronavirus along with the increased tensions between China &US, which weighed on the U.S. dollar.

From the American side, the Core Purchasing Price Index (PPI) for April showed a decline to -0.3% against the forecasted decline by -0.1% and weighed on U.S. dollar, which in turn added in the downfall of USD/JPY pair. The pair USD/JPY further dropped after the release of PPI, which also declined to -1.3% against the forecasted -0.5%.

Daily Support and Resistance    

  • R3 109.37
  • R2 108.57
  • R1 108.12

Pivot Point 107.33

  • S1 106.88
  • S2 106.09
  • S3 105.64

USD/JPY – Trading Tips

The USD/JPY traded bearishly to trade below the support level of 107, which marked the 50% Fibonacci retracement level. Currently, the USD/JPY is holding at 106.875, where the 50 EMA is resisting the pair, and it may drop further below the 107 level. At the moment, the 4-hour candle seems to close below 107 support become resistant, and this may drive more selling in the USD/JPY pair. The pair may extend selling until 106.600 level, whereas the closing of buying candles above 107 can trigger bullish bias until 107.50. By the way, bearish bias seems solid today. All the best for today! 

Categories
Forex Course Forex Daily Topic

Introduction To Forex Course 3.0

Hola Readers! We have successfully completed the first two courses and received an amazing response for both of them. We can’t thank you enough for that. Also, we hope these first two courses have helped you in understanding the most fundamentals basics of the Forex market. It is very important to know these basics in order to succeed in the Forex market. We have made a quick navigation guide for both the courses just for you to access the articles easily.

You can find them here the guides for – Course 1.0 | Course 2.0

With all these basics in mind, we will be moving on to our new course, which is a bit different than the other two courses. We are saying this because the first two courses are more inclined towards information and theory. But Course 3.0 is all about Technical Analysis. Hence most part of it deals with the practical applications that are involved rather than just theory. The quizzes and everything remain as is, but a lot more effort from your side is required to ace the knowledge that we are going to provide in the lessons.

Having said that, Technical Analysis has the most logical approach to the prediction of price movement than the Fundamental & Sentimental Analysis. There are a lot of components within the technical analysis, and some of them include Price-Action trading, technical tools such as Indicators & Oscillators, Volume based trading, etc. In this course, we will be going through all of them in detail.

Topics that will be covered in this course 

Everything About Candlesticks

Support & Resistance Levels

Moving Averages

Popular Indicators & Oscillators

Fibonacci Trading

In each of the topics, there will be about 7 – 10 article lessons where complete information is provided related to the topics. Quizzes will be available for each of the articles like before.

We are proud to present this course to you as it is prepared by some of the top technical traders with great expertise in this field. Aren’t you excited? We wish you all the best in studying and learning the concepts with at most interest. Cheers!

Categories
Forex Course

Introduction To The ‘Ultimate Forex Course’ By The Forex Academy!

At Forex Academy, we give utmost importance to education. To be successful, you need to learn before you Earn. So for that same purpose, we have designed a proprietory course helped by industry experts. This extensive course will cover almost everything one needs to know about the Forex market. All relevant aspects of the trading business will be discussed here, starting right from the fundaments to the advanced trading concepts. We will be publishing one article per day so that it will be a continuous learning process. And guess what? The curse is entirely free for our readers.

Introduction To The Course

In this one-of-a-kind course, we will explain everything you need to know about Forex trading. The Forex market has evolved rapidly in recent times. It is not the same that you would have seen or heard a decade ago. The fundamentals are changing, psychology is changing, and complexity has increased. Technology not available in the 90s has now become robust and is being used extensively by traders and banks. As retail traders, we should prepare as best as possible to meet these global changes.

We have created this course, keeping in mind the rapid changes happening in the forex market. You need to use a structural method of learning, which is what we have done. Education shouldn’t be in bits and pieces, this will only create confusion, and you cannot gain anything from that knowledge. You will gain an insight into fundamental and technical expertise and how you can use them together to make the best trades. We have compiled this information from the best sources. Most importantly, the course contents have been written based on the personal experience of the writers. Forex.Academy is the right place to start for any person looking to start his trading career.

Why should you take up this course?

If you want to achieve your investment goals, this course is for you. Trading is not an easy game. It requires a lot of hard work and dedication. This journey begins with learning, and learning starts here. This course is a complete package for all the aspiring traders. Also, experienced traders who are willing to expand their knowledge must try this course. The articles are more reader-friendly, where topics are explained in simple language. The most complex strategies are described in the easiest way possible. Without having the right knowledge, it is impossible to succeed in trading.

Structure of the course

The course is divided into 37 chapters which comprise of 350+ articles, where a wide range of topics are covered. The chronological order of topics is in such a manner that every chapter is linked to the next. We have made sure that it does not lead to confusion at any point. You will find information on fundamentals, technical analysis, and price action. Market psychology is one such topic, which has been written with a lot of attention. And you too, should follow these principles to gain control over your mind.

Keep track of your learning with the quizzes

At the end of each article, we have included a quiz that will test your understanding of the topic. To be confident about what you have read, try to answer all of them correctly. If you are unable to answer, that means you need to reread the article. Rereading the article will clear all your doubts and make you an expert. Once you got all the answers right, you are ready to go ahead to the next section.

What will you learn by the end of this course?

By the time you reach the end of the course, you will be halfway through your trading journey. The only thing left for you to do is to practice the trading strategies discussed along the course. You will have all the knowledge you need to be a successful trader. See you on the course.

All the best! Happy Learning!