Categories
Forex Videos

Market volatility continues into 2021, where next for Cable?


Market volatility continues into 2021, where next for Cable?


Thank you for joining this forex academy educational video.

In this session, we will be taking a look at how the pound is faring against the United States dollar as the UK leaves the European Union to go on its own way as an independent trading nation once again.

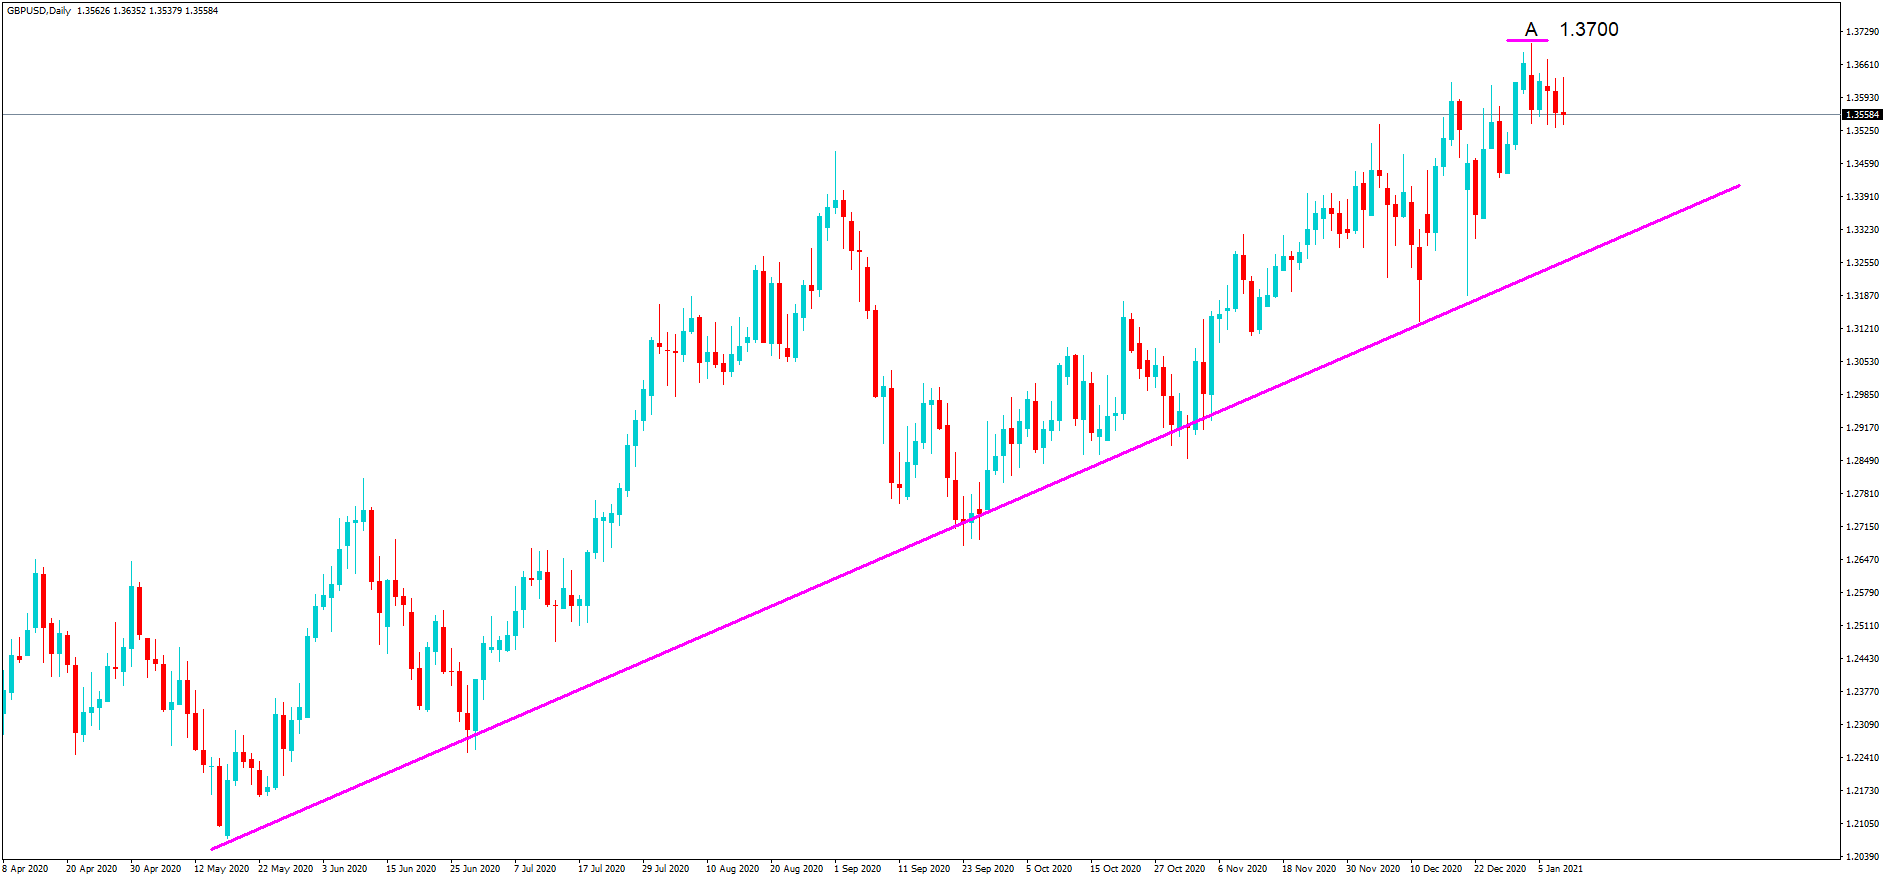
In this daily chart for cable, we can see a general trend higher from the 12th of May 2020, which culminated in a peak of 1.3700 at position A, which coincides with a future free trade agreement being announced between the United Kingdom and the European Union, which was generally seen by the market as going to happen, and which fuelled the bull rally as played out on the chart.

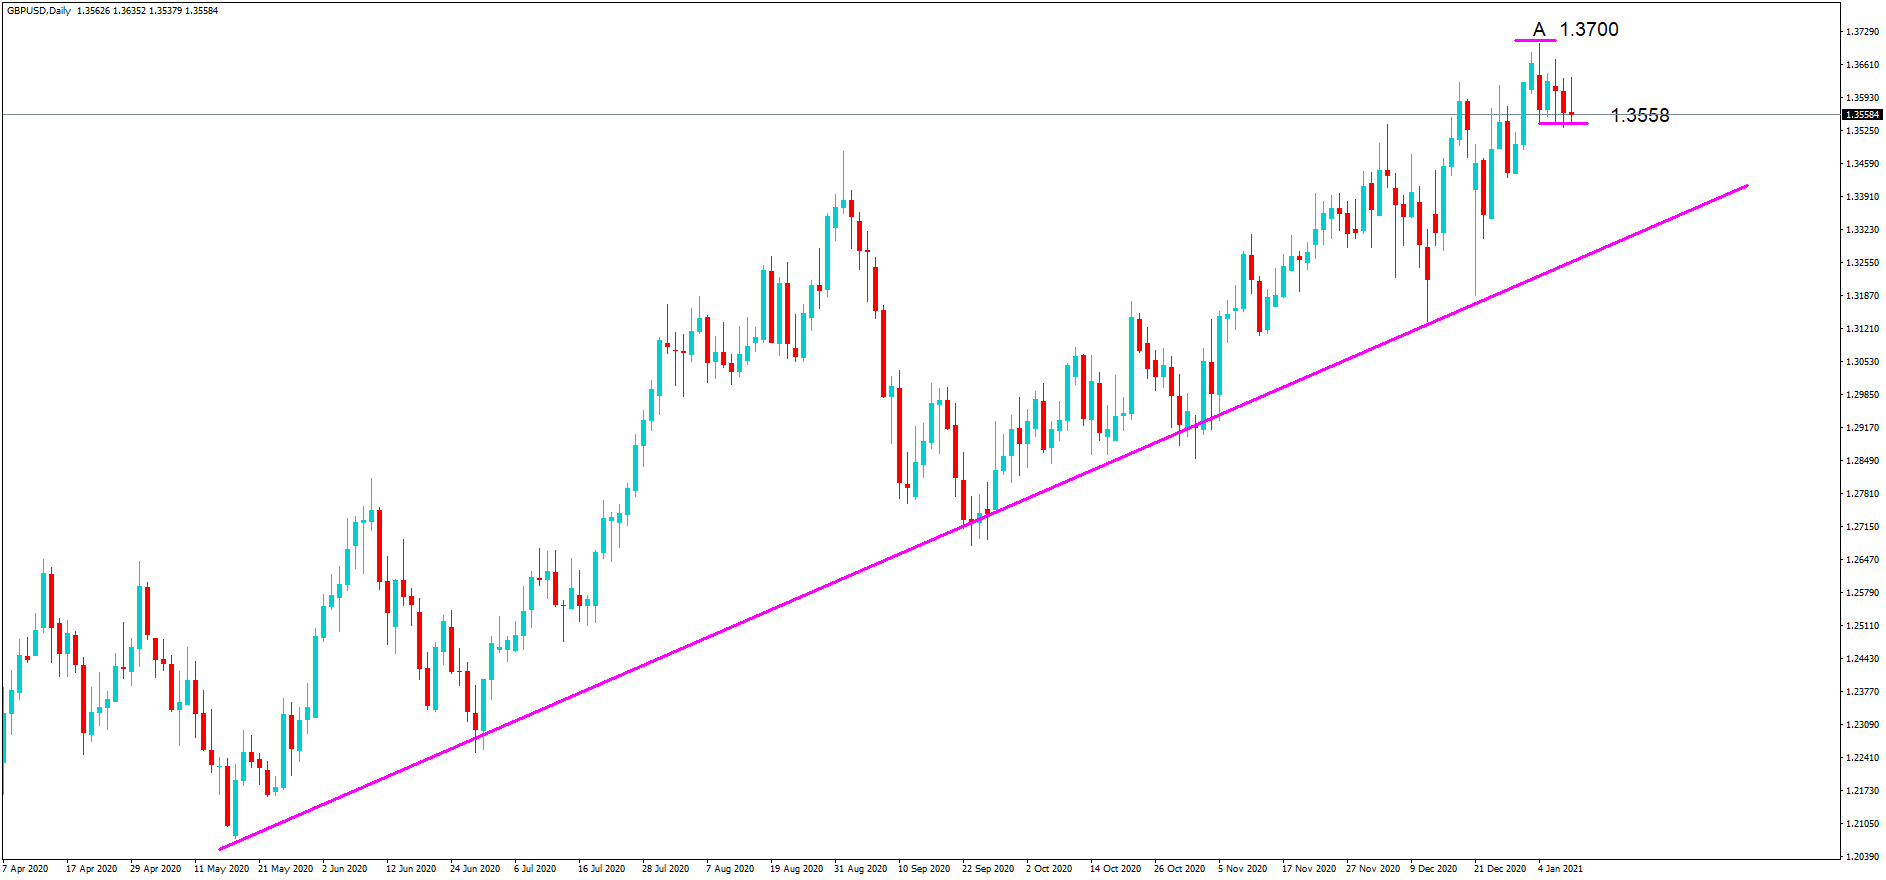
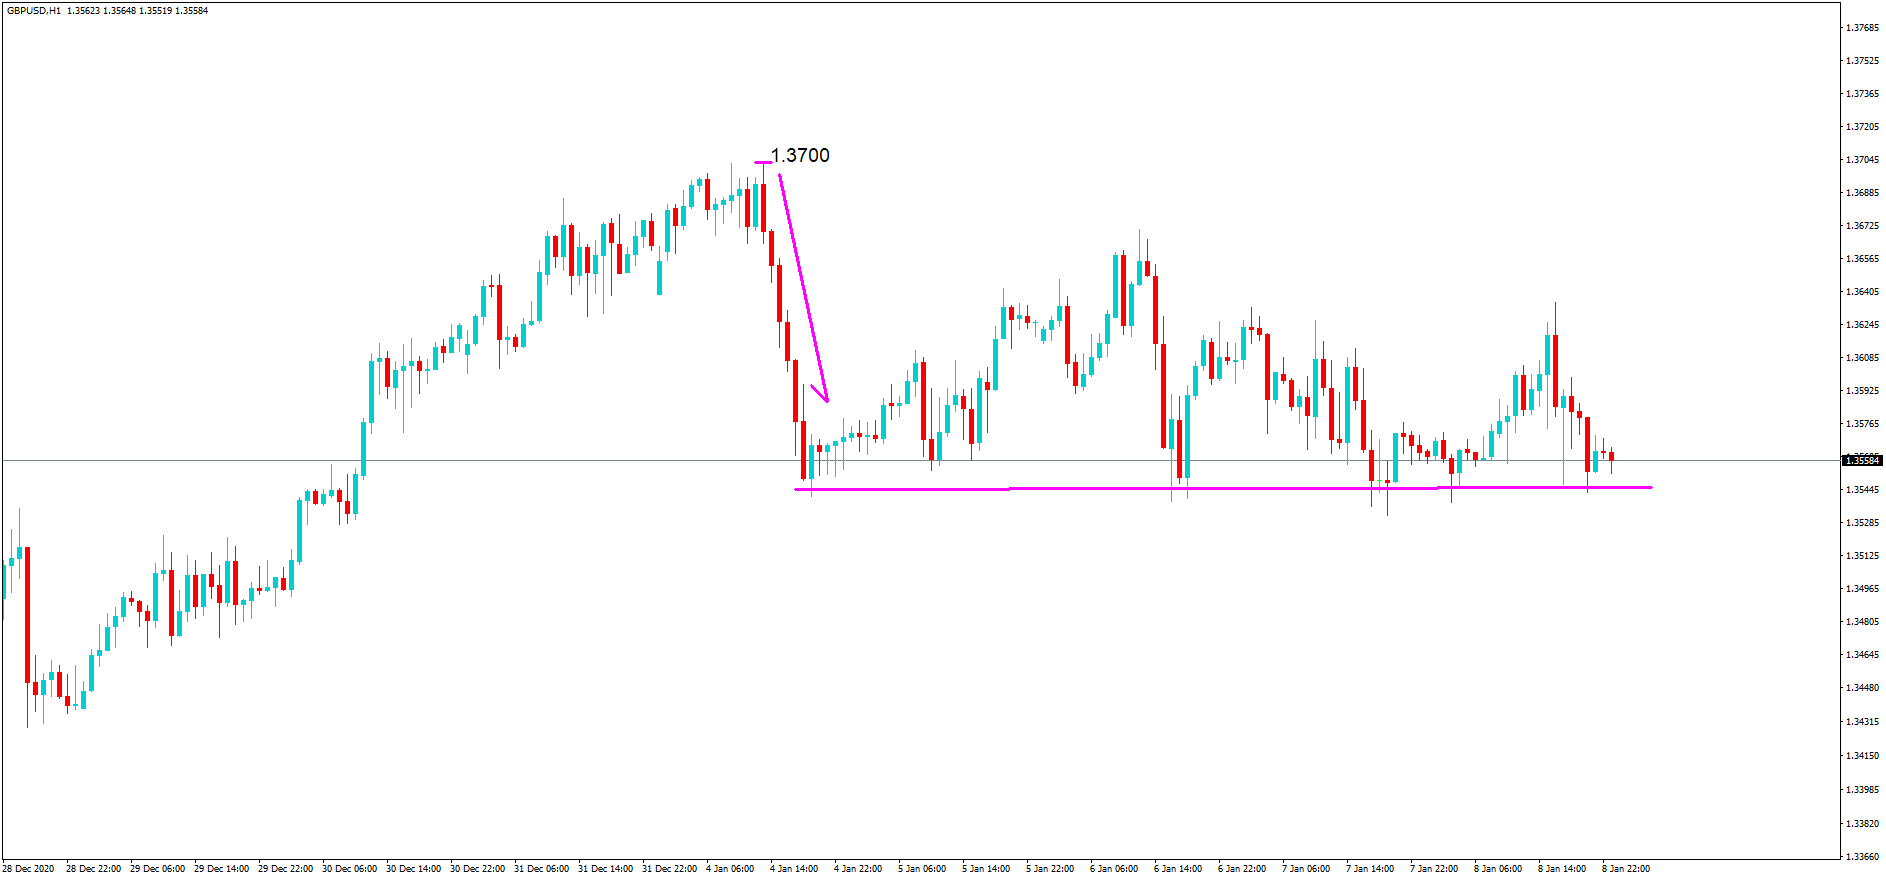
The pullback to the current level at 1.3558, at the time of writing, was to be expected, on the basis many traders work on the principle of buy the rumor and sell the fact, in which case we might naturally expect to see some traders exiting their long trades due to profit-taking, and a fear of a collapse due to this common market practice of buying the rumor and selling the fact. But the sell-off has been fairly muted, only flattening out to the current exchange rate.  

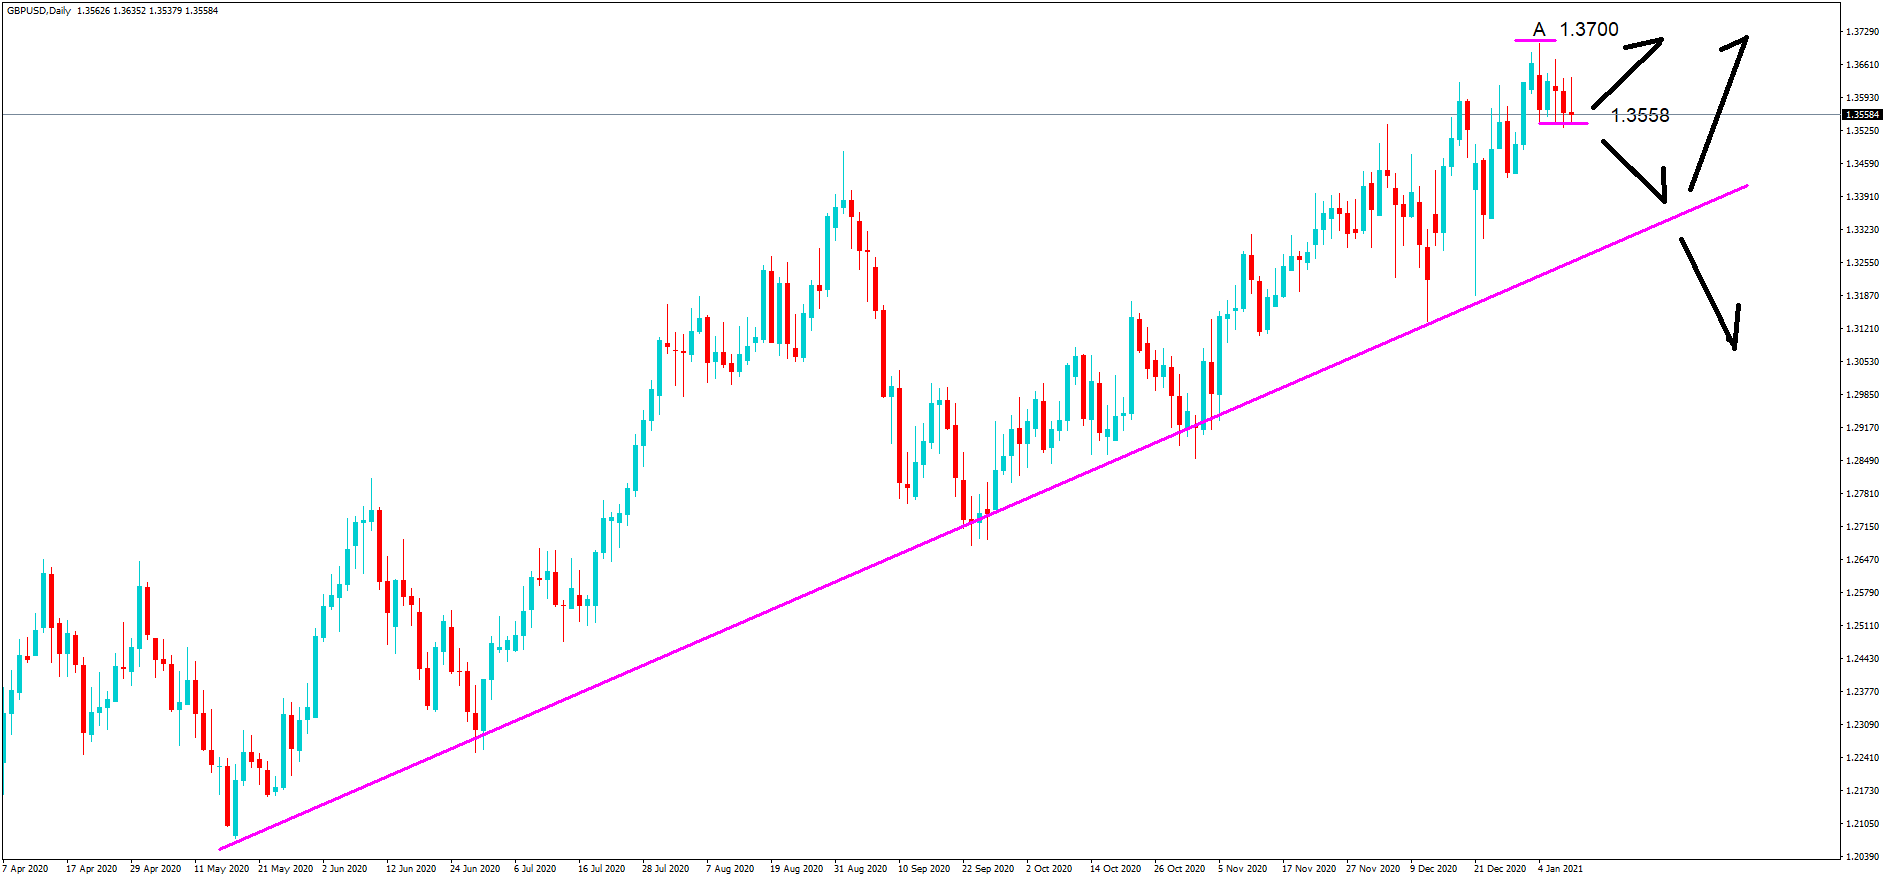
The real test here will be whether there is a move higher from position B to a retest of the 1.3700 line, which would then likely cause a push above it on towards 1.3800 and beyond, or a move lower towards the support line when longer-term institutional traders will be looking for the support line to breach, or price action to bounce higher and perhaps a retest of the 1.3700 figure from there.

Things to factor in are the extremely high rate of covid infections spreading through the United Kingdom and causing further lockdowns and loss of productivity within the UK, where long-term effects of this on the economy are not good.  The markets have been buoyed by the measures put in place by the government to protect businesses and inject money into the system.

We also have to consider a new United States president will be inaugurated in a couple of week’s time, and what effect this has on the United States dollar as he begins to introduce new legislation to raise income tax and increase red tape for businesses as he has pledged to do.

The recent pullback in the pound against the dollar has largely been a result of all of these factors and a slight improvement in US dollar sentiment. 

 Expect extreme volatility as we move in towards the middle part of January, especially around the time of the inauguration on the 20th of January.

Categories
Forex Videos

Forex GBPUSD Breakdown 14th-24th July 2020


A detailed look at Cable price action 14th to 24th July 2020


What is going on with the GBPUSD pair, AKA Cable?

Thank you for joining the forex academy educational video. In this session, we will be looking at what has been happening with the Great British pound US Dollar pair, also known as Cable between the 14th to the 24th of July 2020.
The idea behind this video is to show you what professional traders look for in their technical analysis in order to try and determine the future movement of price action.


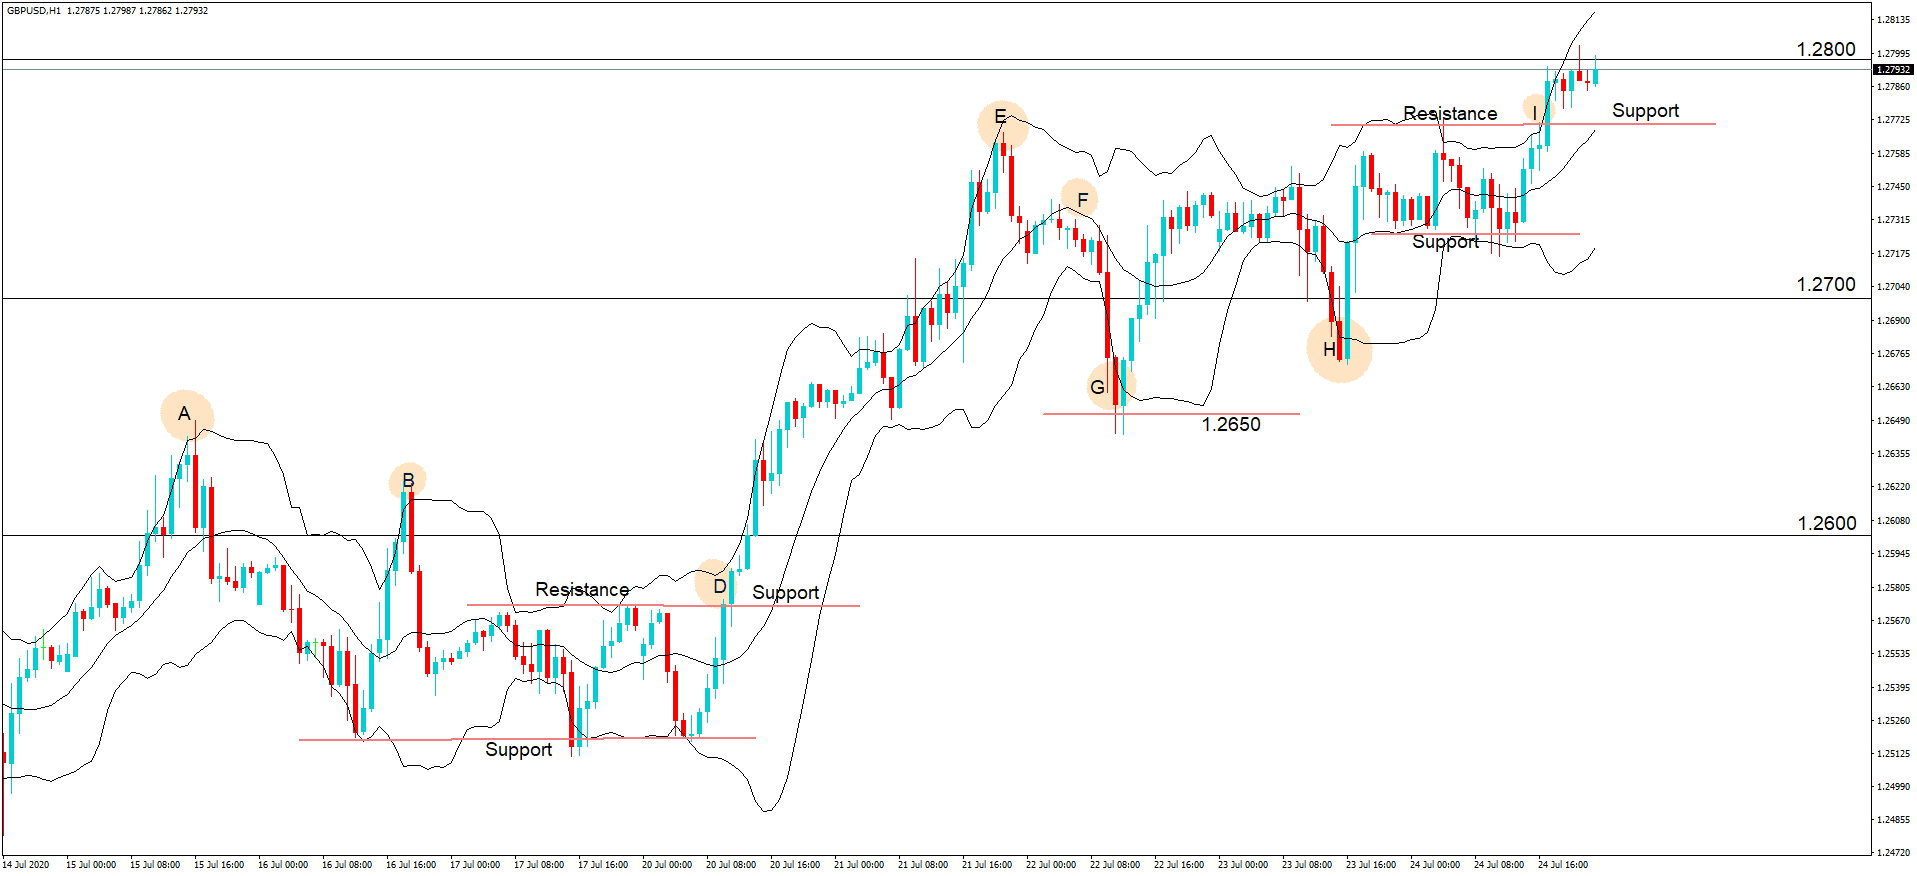
This is a 1-hour chart of Cable for the period of the 14th to the 24th of July 2020.
One of the biggest mistakes that new traders make is that they do not look at historical price action before putting on a trade. Technical analysis is a trader’s best friend and should be looked at holistically before for taking on a trade. Technical charts should be looked at from left to right because they tell a story.

We can see that the price action of this pair was bid up to position A, which was a new recent high and, importantly, above the key figure of 1.2600, a multi-month high for the pair. Traders will have taken some profits after this push, and we see price action fall back to the support line, before a second push higher to position B, and where position B is lower than position A. This tells us that the strong bull move was running out of steam. Buyers were worried about a possible double top rejection of position A, and this left the door open for sellers to come in because the price could not be sustained above the key 1.26 level.

We then have a period of sideways consolidation between the support and resistance line and more importantly between the two key levels of 1.25 and 1.26, however, there is a breakout of this consolidation period at position D, where the bulls gain control and where the resistance line becomes support and we see an aggressive move higher from here position E. support lines often become resistance lines and vice versa. The other critical component of this bull move was the fact that the EU Brexit negotiator Mr. Barnier was holding talks with a British government regarding the future trading arrangements, post-Brexit, and a potential new trade deal. The market was expecting that a possible deal could be reached, and this was seen as positive for the British pound.
Meanwhile, profit-taking was taking place at position E and where subsequent price action began to fall back to position F and where technical analysis traders saw a bear formation and pushed pair down to position G, which is an important round number of 1.2650.

Looking for an opportunity to enter the market, bears again took control and pushed the pair higher. However the fading arch formation was reflective of uncertainty, and where the market was braced for an EU press conference, where Michael Barnier, the lead negotiator for a new EU/UK trade deal, said that a deal was unlikely with the British government due to substantial differences and so-called red lines around fishing rights and possible divergences in standards, which would likely prevent a deal being reached. This was seen by the markets as bad for the British pound and activated an initial sell-off in the pair, which was only stopped in its tracks when the United States released worse than expected initial jobless claims data for June, which reversed the pair at position H, coupled with the fact that Mr. Barnier said that there was still an opportunity to secure a deal with a British government and that talks would resume again in August. This gave a more positive sentiment to the pound, and the pair lifted to the second period of support and resistance, importantly, this was above the key 1.27 level.

In thin trading on Friday evening, BST, after the European and London sessions had finished, and with China and US tensions rising because of a breakdown in relations and a lack of trust growing on either side, the US dollar was generally sold off across the board and Cable lifted to a new multi-month high of 1.2800.
A large part of the bid tone in this pair is because of a bad sentiment for the United States economy due to the growing number of Covid cases which is seen as being almost out of control, and where are Great Britain has largely surpassed the worst of the disease and whereby the economy is opening up, and things are returning to some kind of normal.

The scope is for further upside in this pair due to the ever-increasing bad sentiment for the United States dollar and slightly better sentiment for the British pound, where there is still hope that an EU UK trade deal can be completed by December.

Categories
Forex Videos

Forex! GBPUSD/Cable looks towards 1.3200!

Cable looks towards 1.3200

Thank you for joining this forex academy educational video. In this session, we will be looking at the GBPUSD pair, also known as cable.
The idea is to show you recent price action on a 1-hour chart so that you can apply the related methodology to your own trading style.


Always read your chart from left to right because it tells a story of historical price action key levels and what potentially is driving a particular currency pair.
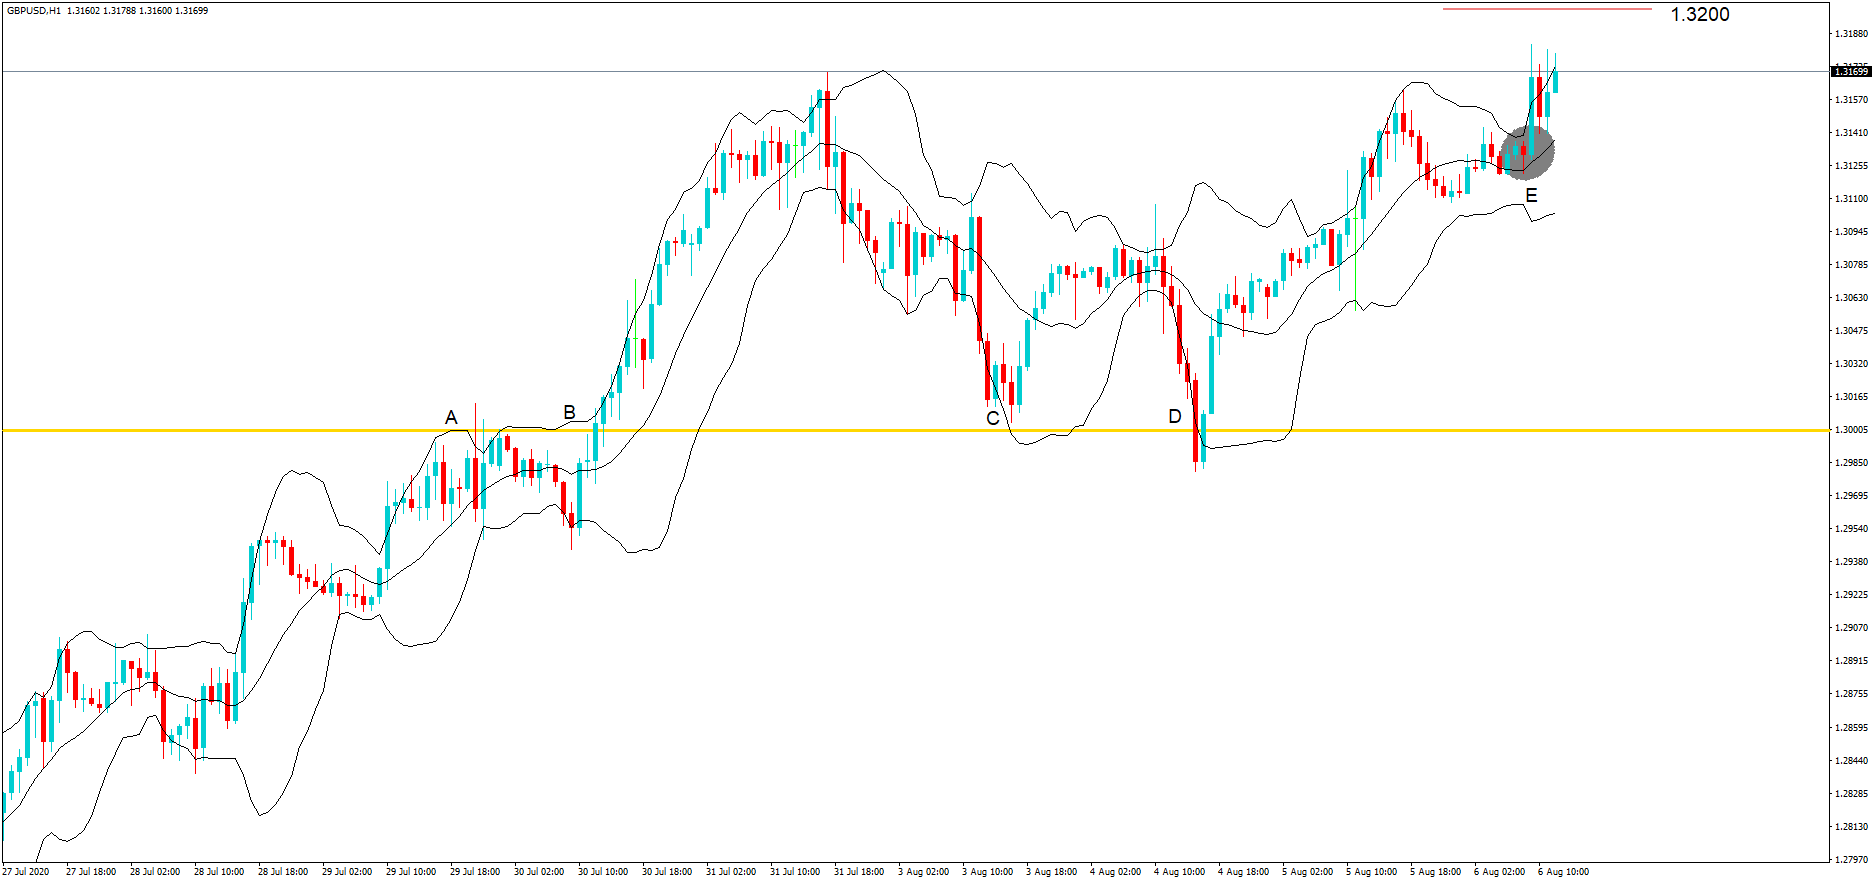
Here we can see that price action remained bullish from the 27th of July, and moved up to a significant key level at 1.300. It Immediately found some sellers at the position, and where 1.300 was then seen as an area of resistance. After such a bullish move, traders will typically take some profit and wait for the next significant move in price action before they re-join. Here on our chart, we can see that at position B, here was a retest of the 1.300 and where this level subsequently became an area of support. Again, we see a nice bull rally before price action falls back to the key level at 1.30 at position C and D, where subsequently, the bulls finally start buying the pair ad where 1.300 is then seen as a significant area of support.
Price action goes on to breach the 1.3100 key level, and then at position E Andrew Bailey, Governor of the Bank of England left its interest rates on hold for the August meeting and left its policy unchanged. Importantly all nine members of the monetary policy committee voted to leave interest rates and changed.

Because there was market speculation that the Bank of England might introduce negative interest rates to try and mitigate against the negative economic effects of the covid pandemic, this was largely discounted by the governor of the Bank of England who said after the announcement that negative interest rates would be useful and remain in the toolbox, but they have no plan to introduce them at the moment.
Again, this provided a lift for cable, which was driven up on the good news to 1.3183. 1.3200 will be on traders’ minds as the next significant test.
Things to consider are that growth forecasts have been upgraded with positive data releases in recent weeks for Great Britain. And Mr. Bailey said that “The British economy is still set to contract in 2020 – COVID-19 is taking its toll. Nevertheless, this decline has now been trimmed to single digits – 9.5% against 14% beforehand. That is a substantial upgrade. While the BoE also trimmed growth forecasts for the next two years – a slower recovery – it is hard to foresee too far into the future given the high uncertainty surrounding the virus.” However, the Bank of England remains wary of further outbreaks of the virus, hampering the economic recovery for the United Kingdom.
Cable will need to push up and find a support area above 1.3170 in order for a sustained push up to the 1.3200 level. We would imagine an initial rejection of this key exchange rate, however, if the market goes on to attack it on a number of occasions, it could be breached and leave the door open for a push-up to 1.3250. Failure will see a push down to the low 1.30’s

Categories
Forex Videos

Forex! What’s Driving Cable & Where You Should Be Trading!

What’s Driving Cable?

Welcome to the Forex Academy educational video in this session we will be looking at the British pound and discuss what might be driving it within the realms of the pound vs. the United States dollar also known as Cable.


What is driving Cable? 

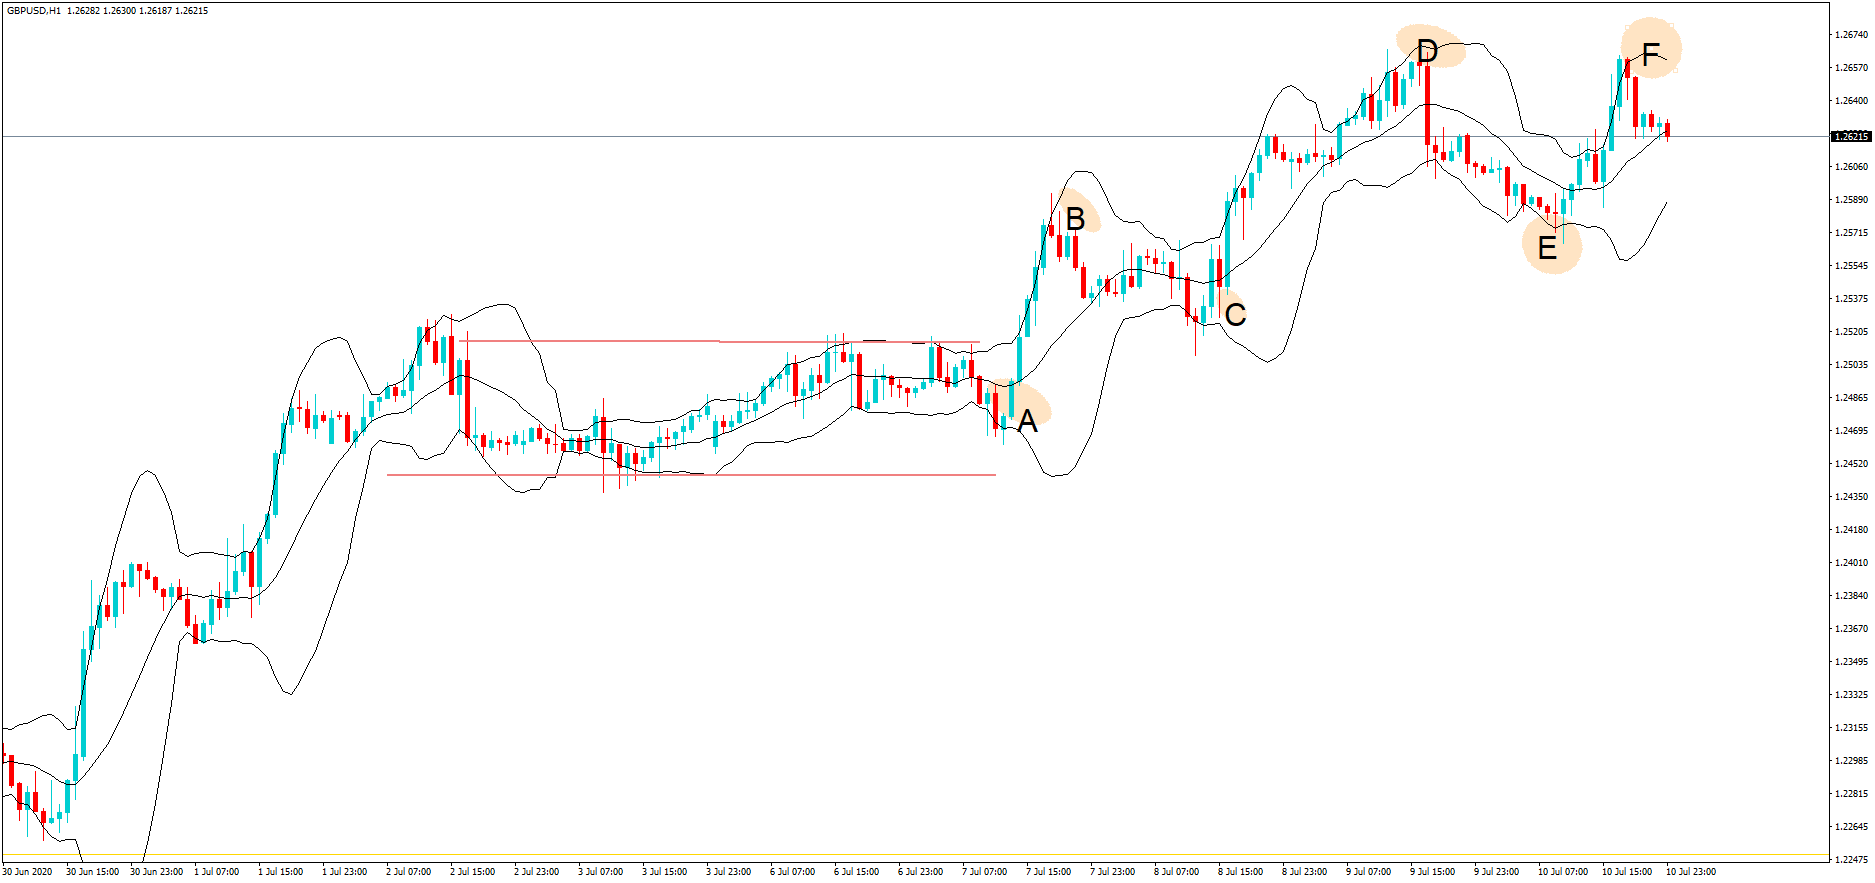
After a bullish rally at the end of June, where price action had consolidated due to end of the month, end of quarter rebalancing, the Great British pound found some buying pressure at the beginning of July and where price action in Cable largely consolidated for a few days due to the fact that Britain and the European Union had completed a recent round of trade negotiations, which had fallen largely flat and all come to nothing.

However, at position A, the European Union chief Negotiator Michael Barnier announced he would be having dinner with the UK’s trade negotiator, David Frost, at Number 10 Downing Street. That evening. No doubt, they would be eating fish and chatting about fisheries, which is one of the biggest stalling points between in the UK and the EU you being able to reach an agreement on a future trading deal.

However, the announcement of the meeting gave a lift to the pound, causing Cable to make fresh highs, just below the key 1.26 level at position B.


The morning after the night before induced some negative tones from Barnier who declared there had been no major developments and cable consolidated and pulled back to position C, which was just before the Chancellor of the Exchequer, Rishi Sunak released an emergency budget. This was largely well-received by the market because it will help people retain their jobs as the UK tries to recover from the COVID pandemic, especially the younger generation of the United Kingdom. Job losses would be limited UK Gov offering a further olive branch in the form of £1,000 payments to companies in order to retain staff after the end of the furlough arrangement.

After a strong move above the 1.26 level sentiment shifted to a downbeat United States dollar which began to reverse some of its bad performance across the board on all the major currencies, mostly driven by better than expected US data releases, and which sent Cable back down to position E. Some of this would have been down to profit-taking. However, we see an uptake in the pair again during Friday’s European session to retest the previous high at around 1.2663 level. A double top always makes the markets nervous.

However, around this time, President Donald Trump came out and said that there would likely be no Phase 2 to deal with China. It simply wasn’t on his mind.  This sent a shockwave through the market where US equities initially were sold off and which saw buying pressure on the United States dollar and a pullback in Cable.

The financial markets and especially the forex markets are extremely volatile at the moment and liable to huge swings caused by a myriad of reasons but mostly centered around the fallout from the Covid pandemic, of course. Tensions are building with China as it flexes its muscles over its new security law regarding Hong Kong and which is causing fall out with most of its trading partners. The UK government is about to make a decision with regards to the Chinese technology firm Huawei and whether or not to implement its 5G technology within the UK communications infrastructure.  Declining the use of Huawei technology may be seen by the Chinese government as a further indication that relationships are souring between the two nations.  Any increased tensions could also cause downward pressure on the Pound Sterling.

Categories
Forex Market Analysis

Daily F.X. Analysis, May 20 – Top Trade Setups In Forex – European CPI Figures Ahead! 

The U.S. Federal Reserve will release its latest FOMC meeting minutes. The European Commission will post the May Consumer Confidence Index (-23.7 expected) and final readings of April CPI (+0.4% on-year expected). The U.K. Office for National Statistics will release April CPI (+0.9% on-year expected).

Economic Events to Watch Today 


EUR/USD – Daily Analysis

The EUR/USD prices were closed at 1.09228 after placing a high of 1.09759 and a low of 1.09020. Overall the movement of the EUR/USD pair remained bullish throughout the day. After gaining almost 100 pips on Monday, the EUR/USD pair rose to near its highest level in 2 weeks of 1.0976 level on Tuesday. The upbeat market mode was derived by the Franco-German recovery fund proposal, which was announced on Monday and provided a boost to the single currency EUR. 

The Vice President of the European Commission, Valdis Dombrovskis, said that the European Stability Mechanism (E.S.) strongly supported the Franco-German proposal. Commission was also looking forward to presenting the proposal in the upcoming European summit on May 27.

Following the previous day’s gains, the EUR/USD pair continued to rise and was further supported by the better than expected economic data release on Tuesday.

At 14:00 GMT, the ZEW Economic Sentiment from the European Union showed that the economic outlook of the Eurozone in the view of institutional investors and analysts increased to 46.0 from the expected27.4 and supported EUR. 

The German ZEW Economic Sentiment also showed an improved economic outlook after releasing as 51.0 against the expected 30.0 during the month of May and supported EUR.

The better than the expected economic outlook of the whole bloc, along with Germany even in the lockdown time, gave a sudden push to the already prevailing bullish trend in EUR/USD and rose its prices above two weeks high. However, pair failed to hold its gains and started to drop in late-session but managed to end its day with a bullish candle.

On the other hand, the greenback lost its demand in the absence of any significant economic data. Only Housing Starts in the month of April were released from the U.S. on Tuesday, which declined to 0.89M against the 0.95 forecasted and weighed on the U.S. dollar.

Meanwhile, the Fed Chair Jerome Powell also refrained from providing any specific surprising remarks about the economy or policy outlook and hence kept the U.S. dollar under pressure. He said that the Fed would remain committed to using its all tools to recover the U.S. economy from a corona-induced crisis. U.S. Dollar Index fell near 99.50 level on that day.

Daily Support and Resistance

  • R3 1.1089
  • R2 1.1008
  • R1 1.0961

Pivot Point 1.088

  • S1 1.0833
  • S2 1.0752
  • S3 1.0705

EUR/USD– Trading Tip

The technical outlook for EUR/USD pair seems bullish as the pair is trading at 1.0938, having formed a bullish engulfing pattern above an immediate support level of 1.0918 level. On the 4 hour timeframe, the pair is also forming a higher high and higher low pattern, which can drive further buying trends in the EUR/USD pair. The MACD is bullish, while the 50 EMA is also supporting the bullish bias among traders. The pair has the potential to trade towards north to target 1.0993 triple top area while support holds at 1.0918 and 1.08850 level today.


GBP/USD – Daily Analysis

The GBP/USD prices were closed at 1.22482 after placing a high of 1.22961 and a low of 1.21839. Overall the movement of GBP/USD pair remained bullish throughout the day. The GBP/USD pair rose for 2nd consecutive day on Tuesday amid the broad-based U.S. dollar weakness and better than expected employment data from the U.K. 

The U.S. dollar was already under pressure the previous day after the announcement of the Franco-German recovery fund proposal, which consists of 500 Billion euros. The increased risk appetite in the market also made the U.S. dollar weaker on Tuesday. 

Furthermore, better than expected U.K. employment data on Tuesday gave strength to GBP and raised GBP/USD prices. The office for National Statistics reported that U.K. Unemployment Rate in April dropped to 3.9% from the expected 4.4% and supported GBP.

Despite the decreased unemployment rate, around 857K people filed for jobless claims in April against the forecasted 675K. The decreased unemployment rate, which covers three months to March, showed that unemployment might have fallen sharply during April considering the increased numbers of jobless claims that month.

Meanwhile, U.K. announced a new tariff regime for Brexit that will remove tariffs on 30 billion pounds worth of imports or about 60% worth of trading coming into the U.K. The latest tariff named U.K. Global Tariff (UKCT) will become effective from January 2021 when the transition period will end.

AT 11:00 GMT, the Claimant Count Change for April showed that almost 856.5K people applied for jobless benefit claims against the expectations of 675.0K and weighed on Sterling. At 11:02 GMT, the Average Earning Index for the quarter showed a decline to 2.4% from the expected 2.7% and weighed on U.S. Dollar. However, the Unemployment rate for March showed a decline to 3.9% against the anticipated 4.4% and supported Pound.

Daily Support and Resistance

  • R3 1.2411
  • R2 1.2319
  • R1 1.2257

Pivot Point 1.2166

  • S1 1.2104
  • S2 1.2013
  • S3 1.195

GBP/USD– Trading Tip

On Wednesday, the GBP/USD traded sharply bullish to trade at 1.2245 level despite the release of worse than expected Labor market reports from the U.K. At the moment, Cable faces resistance around 50 EMA, which holds at 1.2255 level. The closing of candles below 1.2260 can drive selling. Still, considering the recent bullish engulfing and long histograms of GBP/USD pair, we may see a continuation of a bullish trend in the Sterling. On the upper side, the violation of 1.2246 level may lead Sterling towards 1.2318 today.  


USD/JPY – Daily Analysis

The USD/JPY pair was closed at 107.700 after placing a high of 108.086 and a low of 107.261. Overall the movement of the USD/JPY pair remained bullish throughout the day. The pair USD/JPY moved above 108.00 level on Tuesday, which was the one-month top-level amid increased risk-on market sentiment. The safe-haven Japanese Yen was under pressure after the latest optimism related to the encouraging initial results of coronavirus vaccine trials. Weaker Yen moved the USD/JPY pair in the opposite direction and made it to post gains above 108.00 level.

The intraday selling bias towards the Japanese Yen increased after the Bank of Japan called out for an unscheduled meeting on Friday. This fueled speculations that Bank would announce more easing measures.

The strong positive momentum due to weakened Yen lifted the USD/JPY prices to its highest level since April 13. However, the rally remained limited due to the rising concerns about the US-China relationship.

Another reason behind the limited rally on Tuesday was the fears about the second-wave of coronavirus. Senators questioned the Fed Chair Jerome Powell and the U.S. Treasury Secretary Steven Mnuchin about their stewardship of specific aspects of the $2 trillion package on Tuesday.

The Senate Banking Committee held its first look at spending under the package announced in March to assist people affected by the coronavirus pandemic. Mnuchin and Powell showed different perspectives on the economic outlook. Mnuchin remained optimistic and said that in the second half of 2020, the economy would see an upturn, while Powell suggested that congress might need more than trillions to aid the economy.

Daily Support and Resistance    

  • R3 108.04
  • R2 107.78
  • R1 107.56

Pivot Point 107.3

  • S1 107.09
  • S2 106.82
  • S3 106.61

USD/JPY – Trading Tips

On Wednesday, the USD/JPY mostly remains mostly bearish following a bullish breakout of the choppy trading range of 107.480 – 107.029 level. For now, the pair is holding at 107.630, having immediate support around 107.500. Above this level, we may see USD/JPY prices heading towards the next resistance level of 108.130. The ascending triangle pattern has already been violated, and it’s expected to kee the USD/JPY supported around 107.500. So let’s consider taking buying trades over 107.500 today. All the best for today! 

Categories
Forex Market Analysis

Daily F.X. Analysis, April 22 – Top Trade Setups In Forex -U.K. Inflation Stabilises! 

On the forex front, the U.S. dollar gained traction against other major currencies, with the Dollar Index climbing 0.3% on the day to 100.20. The U.S. official data showed that Existing Homes Sales fell to an annualized rate of 5.27 million units in March (5.25 million units expected).

The British Consumer Prices Index (CPI), including owner-occupiers’ housing inflation rate, came out at 1.5% in March 2020. Although it’s down from 1.7% in February 2020, it’s not as bad as investors were expecting considering the lockdown in global markets. 

Economic Events to Watch Today     


 EUR/USD – Daily Analysis

The EUR/USD fell by nearly 0.1% to trade at 1.0865. While Spain’s central bank announced, the country’s GDP could fall by 6.8% to 12.4% this year. Later in the today, the major focus will stay on the German ZEW Current Situation Index for April will be released (-75.0 estimated).  

After the Eurozone divided on community debt, most of the analytes are worried that the finance ministers’ may unable to provide a suitable fiscal stimulus to support growth. So, the shared currency could remain under pressure ahead of the Thursday summit.

At the coronavirus front, as per the latest report, the number of confirmed coronavirus cases grew to 145,694, with 4,879 deaths reported in Germany so far. As the cases increased by 2,237 in Germany, a 1.6% rise picking-up pace from Tuesday’s 1.3% increment, the death toll moved sharply up by 281 vs. 194 a day before.

Looking forward, the upbeat Eurozone Consumer Confidence, which is scheduled to release at 14:00 GMT, may put a bid under EUR/USD currency pair. However, the pair trend will remain sluggish until the pair break the trading range of 1.0897 to 1.08616. 

Daily Support and Resistance

  • S1 1.0724
  • S2 1.0788
  • S3 1.0823

Pivot Point 1.0852

  • R1 1.0887
  • R2 1.0916
  • R3 1.098

EUR/USD– Trading Tips

On Wednesday, the EUR/USD is trading sideways at 1.0825, as investors seem to wait for a solid reason to enter the market. The overall bias remains bearish as the EUR/USD prices are holding below 50 EMA, which is extending resistance around 1.08945 level. Continuation of a selling trend below 1.08945 level can continue selling until the next support area of 1.0772, but on the way, the pair may find support around 1.0815 level. 

The EUR/USD is likely to find support around 1.0772, but below this, the next support prevails around 1.0652 level. The pair may find an immediate resistance level of around 1.09230, where the bullish breakout of this level can extend buying until the next resistance level of 1.1036. Conversely, we should look for selling trades below 1.0894.  


GBP/USD – Daily Analysis

The GBP/USD soared 0.3% to trade at 1.2318 as the British Consumer Prices Index (CPI), including owner-occupiers’ housing inflation rate, came out at 1.5% in March 2020. Although it’s down from 1.7% in February 2020, it’s not as bad as investors were expecting considering the lockdown in global markets. 

 At the USD front, investors prefer to choose the U.S. dollar because of its safe-haven-demand in the market due to the fears of economic fallout, which is caused by the coronavirus outbreak. The dollar index, which measures the worth of the greenback against majors, rose 0.20% to levels above 100.00.

The reason behind the decline in GBP/USD pair could also be the immediate rise in COVID-19 cases, with the curve still not notably peaking. It indicates that there is still a high chance that lockdowns could last longer than expected, while the Bankruptcy and bad loans will likely boost the risk-off sentiment in the market and provide further support to the U.S. dollar again.

Apart from the U.K., U.S. President Donald Trump suggested that approximately 20 states ready for re-open while also showing a willingness to sign the bill that stops immigration into the U.S. for 60 days. As in result, the risk sentiment remains under pressure.

The reason behind the risk-off market sentiment could also be the early Asian news surrounding the U.S. Senate’s passage of $484 billion COVID-19 relief package and BOJ’s likely decline of economic and price forecasts. Moreover, statements from the BOE’s Bailey were also necessary to remark during the early Asian session.

As in result, the U.S. 10-year Treasury yields declined by 2-basis points (bps) to 0.55%, after dropping 4-bps on Tuesday, while the most stocks in Asia-Pacific flashing losses by the pres time.


Daily Support and Resistance

  • S1 1.1974
  • S2 1.2148
  • S3 1.2223

Pivot Point 1.2322

  • R1 1.2397
  • R2 1.2496
  • R3 1.2671

GBP/USD– Trading Tip

Yesterday, the GBP/USD fell sharply to trade at 1.2250 after violating the horizontal support level of 1.2424. On the 4 hour chart, the Cable has closed Doji candle above 1.2250 level can drive bullish bias until 1.2350. On the upper side, the Sterling may find next resistance around 1.2426, it’s the same level that supported the pair previously, and now it’s likely to drive selling bias in the GBP/USD pair. On the lower side, the violation of the 1.2265 level can lead the GBP/USD prices towards 1.2175. The 50 EMA and MACD are both are suggesting selling bias in the Cable. So let’s look for selling trades below 1.2322 and bullish above the same level today. 

USD/JPY – Daily Analysis

On Wednesday, the USD/JPY is trading around 107.500 level, mostly exhibiting sideways trading due to a lack of major economic events in the market. The U.S. dollar index slipped to the fresh lows of 100.07 ahead of recovering some ground, still bearish by 0.15% on the day.

The Japanese yen seems to suffer due to a lack of confidence when the state of emergency is being lifted in Japan. While drop-in, the domestic macroeconomic indicators are expected to keep the Japanese yen’s in a bearish mode while maintaining the USD/JPY bullish. Lately, the uptrend in the JPY could be limited due to the forecast of the Bank of Japan (BOJ) support measures to boost funding for the companies due to be announced next week. 

The U.S. Treasury prices advanced as investors continued to seek safe-haven assets. The benchmark 10-year U.S. Treasury yield declined to 0.571% from 0.625% Monday.

On the negative side, the greenback gained ground due to the oil price crash triggered a dash for cash. The high uncertainty in the market also boosted the greenback demand. So, if that trend continues during the ay ahead, the yellow metal could come under pressure.

Daily Support and Resistance    

  • S1 105.92
  • S2 106.84
  • S3 107.44

Pivot Point 107.76

  • R1 108.36
  • R2 108.69
  • R3 109.61

USD/JPY – Trading Tips

The USD/JPY is trading mostly sideways within a narrow trading range of 108.020 – 107.300 zones. At the moment, it’s holding at 107.597, having formed a descending triangle pattern on the 4-hour timeframe. The triangle pattern is extending resistance around 107.850, along with support around 106.980.  

In case, the USD/JPY violates the descending triangle pattern; we may see pair dropping towards 106.200. While on the upper side, a bullish breakout of 108 can lead USD/JPY prices towards 109.100. The leading indicator, such as MACD and 50 EMA, are supporting bearish bias in the market today. Let’s wait for a breakout before taking more trades today.

All the best for today!