Introduction
In the global macro analysis of the AUD/USD pair, we will look at the endogenous economic factors that drive GDP growth in both Australia and the US. We’ll also analyze the exogenous factors that affect the exchange rate dynamic between the AUD and the USD.
Ranking Scale
We will use a sliding scale from -10 to +10 to rank the impact of the endogenous and exogenous factors. When the endogenous factors are negative, it means that they resulted in the depreciation of either the USD or the AUD. When positive, it implies they resulted in the appreciation of the individual currencies. Similarly, negative endogenous factors result in a bearish trend for the AUD/USD and a bullish trend for when they are positive.

USD Endogenous Analysis – Summary
A -19.1 score on Endogenous analysis on USD implies a deflationary effect on this currency. It means that the US Dollar has lost its value since the starting of 2020.

You can find the complete USD Endogenous Analysis here.
AUD Endogenous Analysis – Summary
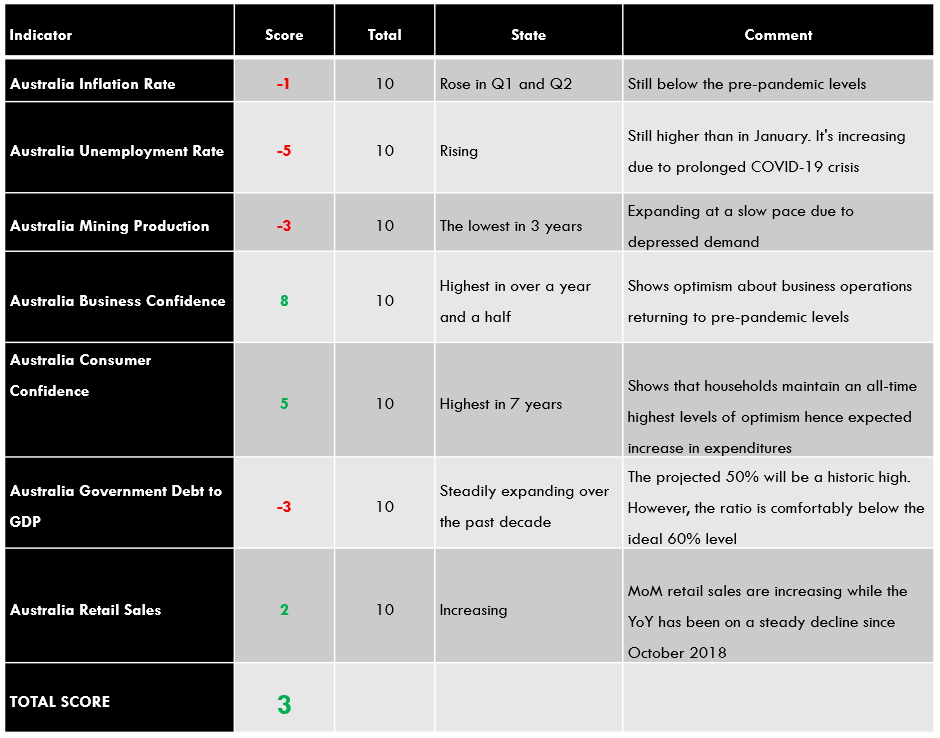
The endogenous factors have an overall score of 3, implying that the AUD has appreciated in 2020.
- Australia Inflation Rate
The consumer price index in Australia is calculated quarterly. Housing accounts for 22.3% of the total CPI weight, food and non–alcoholic drinks 16.8%, recreation 12.6%, transportation 11.6%, household goods and services 9.1%, alcohol and tobacco 7.1%, healthcare 5.3%, financial service 5.1%, clothing, education and communication 10.2%.

In Q3 of 2020, the YoY Australian CPI increased by 0.7% from a drop of 0.3% in Q2. The QoQ CPI rose by 1.6% compared to 1.9$ in Q2. Note that the Q3 CPI is marginally lower than in the pre-pandemic levels in Q1. Based on inflation’s correlation with GDP growth, we assign a score of -1.
- Australia Unemployment Rate
The unemployment rate is the percentage of the labor force that is actively looking for employment opportunities. The unemployment rate can be used to show the state of the economy. When high, it means that the economy is shedding jobs faster and can be said to be contracting.
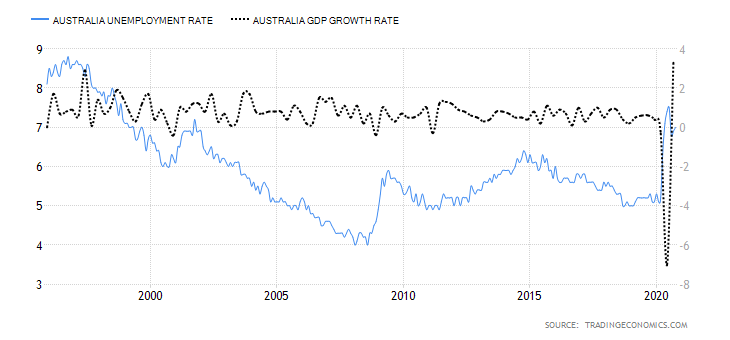
In October 2020, the Australian unemployment rate was 7% up from 6.9% in September. The increase in the Australian unemployment rate can be attributed to the prolonged COVID-19 crisis. Note that during the period, the employment rate increased to 61.2% from 60.4% in September. This was mainly driven by the surge in full-time, part-time job numbers coupled with a drop in the underemployment rate to 10.4% from 11.4% in September.
From January to date, the unemployment rate has increased by 1.7% while the employment rate has dropped by 1.4%. Based on its correlation with GDP, we assign a score of -5.
- Australia Mining Production
The Australian economy significantly relies on mining, which accounts for up to 11% of the GDP. Australia is among the top producers of precious metals in the world. Therefore, a significant portion of the labor market is dependent on the mining sector.

The YoY mining production increased by 1.2% in the second quarter of 2020, down from a 5.1% increase in Q1. In Q3, it is projected to increase by at least 2.5% and 5% by the end of 2020. This would mean that the end of year levels would be equivalent to the pre-pandemic levels.
Based on our correlation analysis, we assign Australia mining production a score of -3.
- Australia Business Confidence
The National Australia Bank (NAB) surveys about 350 leading companies in Australia to establish the prevailing business conditions. Typically, the present business sentiment can be used as a leading indicator of future business activities such as hiring, spending, and investments. We can say that business confidence is a leading indicator of GDP change.
Reading above 0 shows that business conditions are improving, while below 0 shows that business conditions are worsening.

In October 2020, Australian business conditions improved to 5 from -4 in September. The October reading is the highest since August 2019. The increase was primarily driven by improvement in sentiment profitability and employment in the mining and transportation sectors.
Based on correlation with GDP, we assign a score of 8.
- Australia Consumer Confidence
The Melbourne Institute and Westpac Bank aggregate consumer confidence in Australia. The survey 1200 households representative of the entire households in Australia. The index is based on the five year average of these components: anticipated economic conditions, personal finances, and purchase of essential household goods. Consumer confidence is a leading indicator of consumer expenditure, which is a significant driver of the GDP.
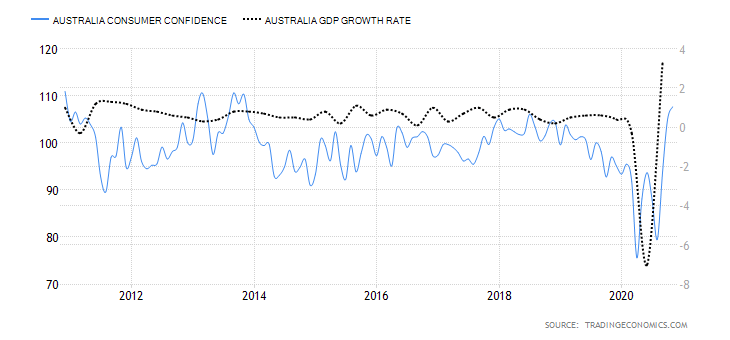
In November 2020, the Australian consumer confidence increased to 107.7 from 105 in October. This is the highest level in 7 years, indicating that consumers are highly optimistic about the future despite the COVID-19 challenges.
Based on correlation analysis with the Australian GDP, we assign it a score of 5.
- Australia Government Debt to GDP
This measures the levels of indebtedness of the Australian government. Domestic and foreign lenders use this ratio to estimate the ability of the government to service its debts without straining the growth of the economy. Generally, a ratio of below 60% is considered to be ideal.

In 2019, the government debt to GDP in Australia jumped to 45.1% from 41.5% in 2018. In 2020, it is projected to reach 50%. Therefore, we assign a score of -3.
- Australia Retail Sales
The change in retail sales shows the trend in household expenditure on final goods and services in the economy. An increased expenditure corresponds to an increase in GDP levels.
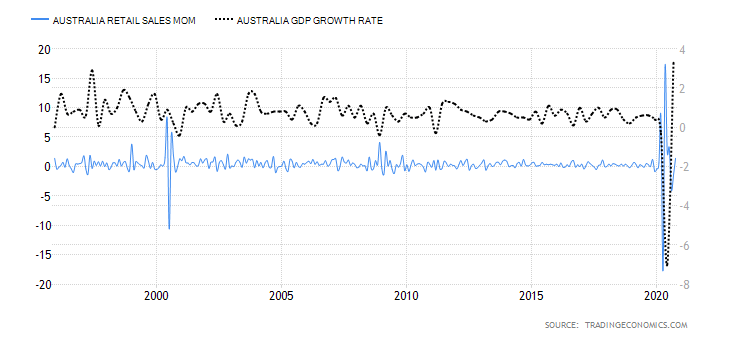
In October 2020, the MoM retail sales increased by 1.4% compared to a 1.1% drop in September. Based on the correlation with the GDP growth rate, we assign a score of 2.
Now we know that USD has depreciated and AUD has appreciated according to their respective endogenous indicators. In the very next article, let’s see if this pair is bullish or bearish according to the exogenous indicators.