Categories
Forex Fundamental Analysis

EUR/CHF Global Macro Analysis – Part 1 & 2

Introduction

In conducting the global macro analysis of the EUR/CHF pair, we’ll focus on endogenous economic factors that contribute to the growth of GDP in the EU and Switzerland. Exogenous factors that influence the exchange rate of the EUR/CHF in the forex market will also be analysed.

Ranking Scale

A sliding scale of -10 to +10 will be used to rank the impact of endogenous and exogenous factors.

The ranking of the endogenous factors will be based on their correlation analysis with the GDP growth rate. A negative score implies that they resulted in the contraction of the economy hence depreciating the domestic currency. A positive score implies that they led in economic expansion hence appreciation of the domestic currency.

The exogenous factors are ranked based on their correlation with the EUR/CHF exchange rate. A positive score means that the pair lead to an increase in the exchange rate, while a negative ranking means that the exchange rate has decreased.

EUR Endogenous Analysis – Summary

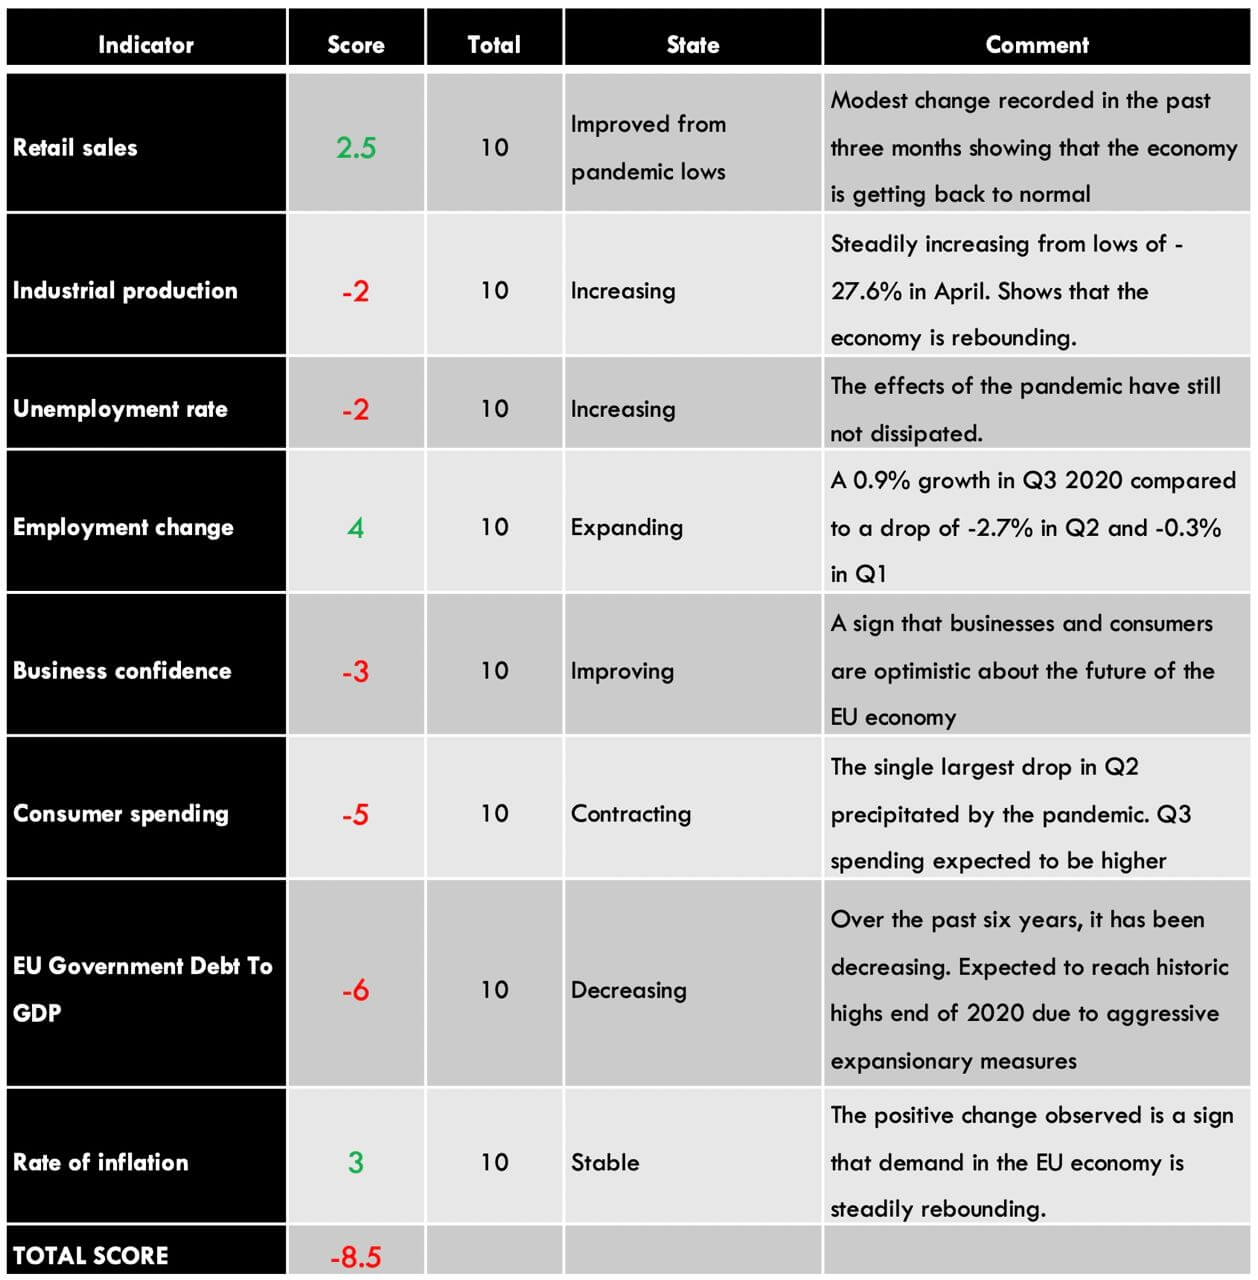
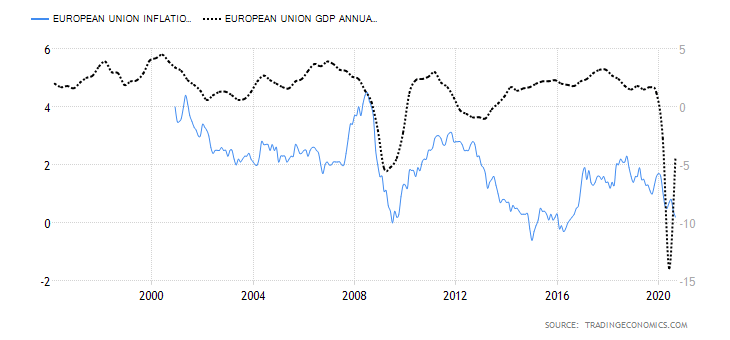
The EUR’s endogenous analysis has a score of -3. This implies that the Euro had marginally depreciated in 2020.

CHF Endogenous Analysis – Summary
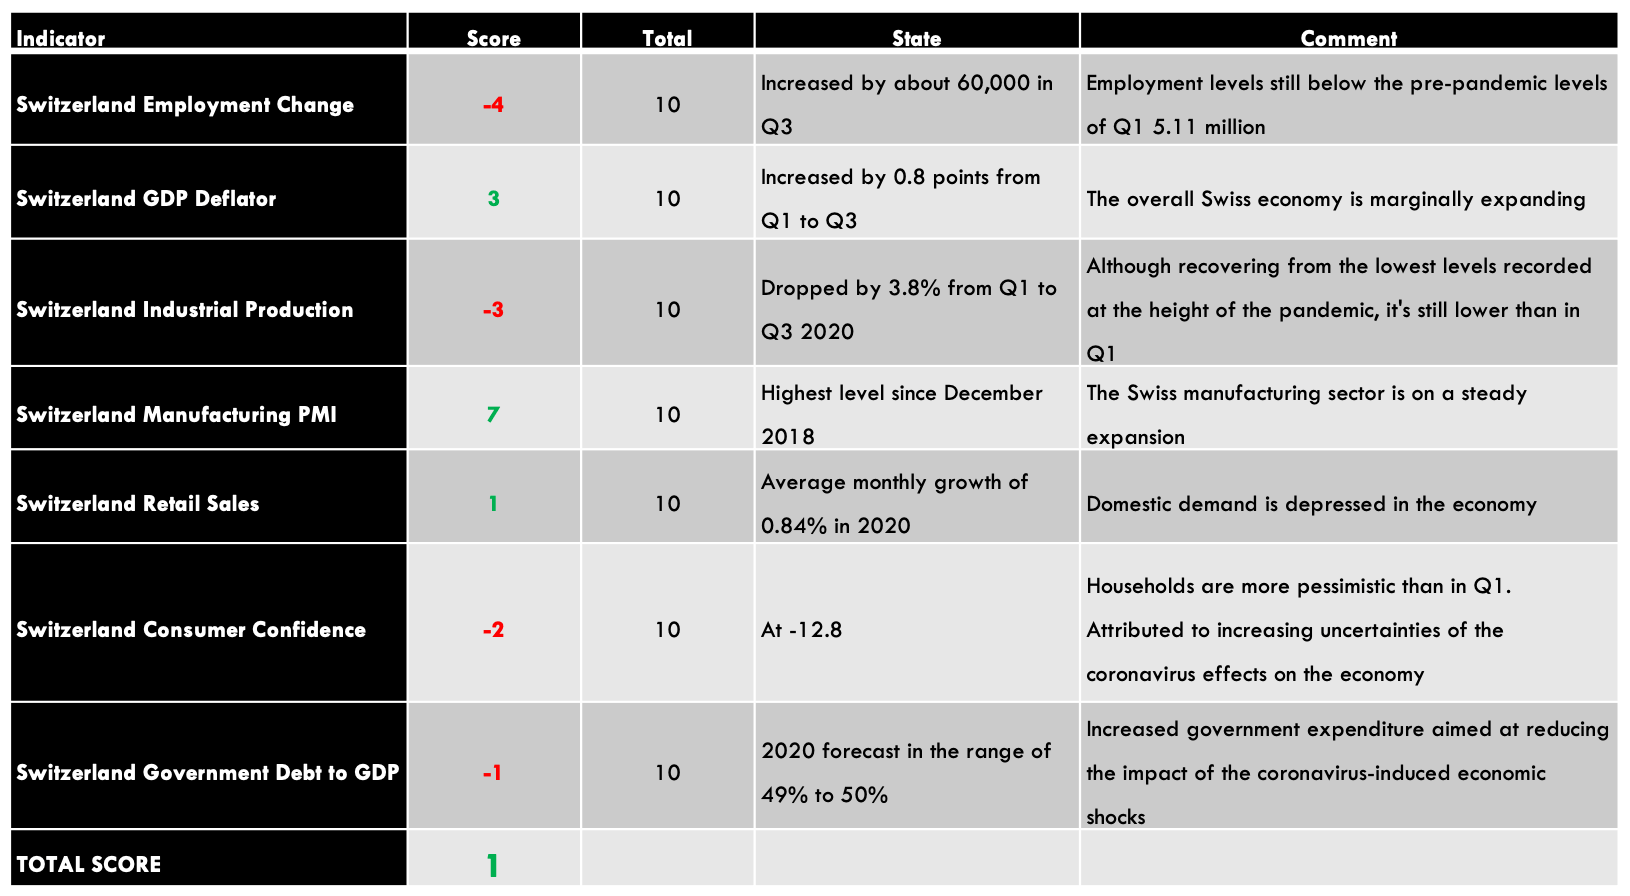
The change in the level of employment covers the quarterly developments in the labour market in Switzerland. The statistic includes the changes in both fulltime and parttime employment. Typically, changes in employment is a result of changes in business activities.

In Q3 of 2020, 5.08 million people were employed in Switzerland compared to 5.02 million in Q2. The employment level is still below the 5.11 million registered in Q1. We assign a score of -4.

  • Switzerland GDP Deflator

Switzerland GDP deflator is used to calculate the change in real GDP in terms of prices of all goods and services produced within the country. This is a comprehensive measure of inflation compared to measures like CPI and PPI, which only focus on a small portion of the economy.

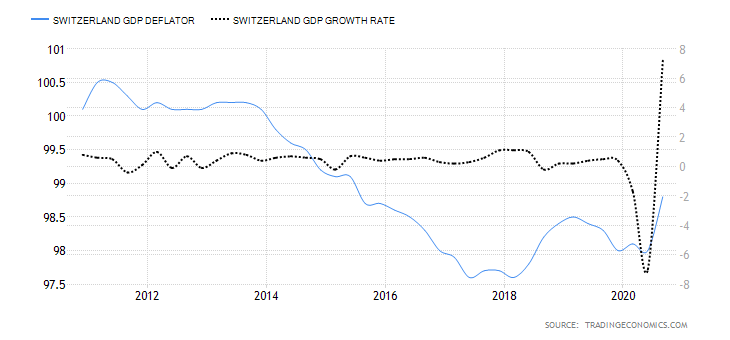
In Q3 2020, Switzerland GDP deflator rose to 98.8 from 98 in Q2.  Up to Q3, the GDP deflator has increased by 0.8 points. The increase in inflation can be taken as an indicator that the economy is bouncing back from the economic shocks of the coronavirus pandemic. We assign a score of 3.

  • Switzerland Industrial Production

This indicator shows the changes in output for firms operating in the manufacturing, mining, quarrying, and electricity production. Although Switzerland is not heavily dependent on industrial production, it is still an integral part of the economy.

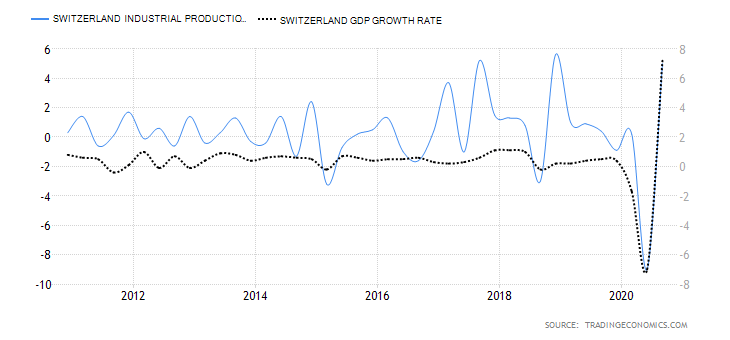
In Q3 2020, the industrial production in Switzerland increased by 5% from a drop of 9% in Q2. The YoY industrial production for Q3 was down 5.1%. For the first three quarters of 2020, the industrial production is down 3.8%. We assign a score of -3.

  • Switzerland Manufacturing PMI

This is an indicator of the economic health of the Swiss manufacturing sector. The purchasing managers are surveyed based in a questionnaire which covers the output in the sector, suppliers’ deliveries, inventories, new orders, prices, and employment. A PMI of above 50 shows that the Swiss manufacturing sector is expanding, while below 50 shows that the sector is contracting.

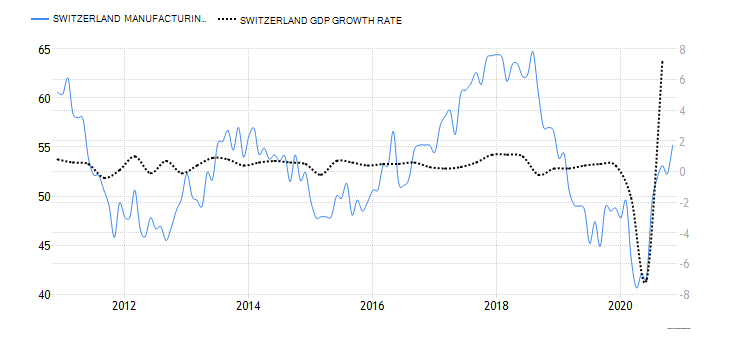
In November 2020, Switzerland manufacturing PMI rose to 55.2 from 52.3 in October. This is the highest reading since December 2018 and the fourth consecutive month of expansion since July. We assign a score of 7.

  • Switzerland Retail Sales

The retail sales measure the consumption of final goods and services by households in Switzerland. The expenditure by households drives the aggregate demand in the economy, which results in the changes in GDP.

In October 2020, Switzerland retail sales increased by 3.2% from a drop of 3.2% in September. YoY retail sales increased by 3.1% in October from 0.4% in September. Up to October 2020, the average retail sales has increased by 0.84%. We assign a score of 1.

  • Switzerland Consumer Confidence

About 1000 Swiss households are surveyed in January, April, July and October. They are evaluated based on their opinions about the economy, job security, financial status, inflation, and purchases. Consumer confidence tends to be higher when the economy is expanding and low during recessions.

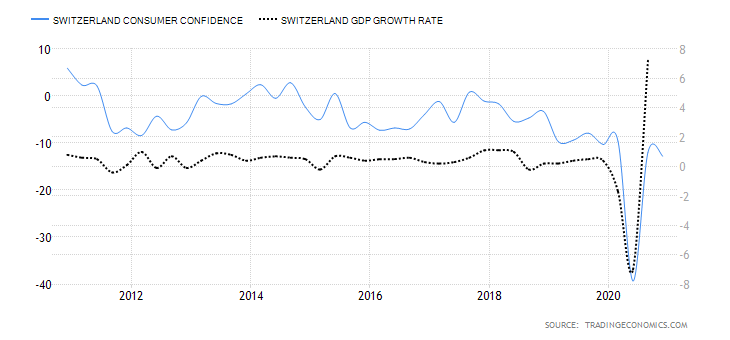
In Q4 2020, the Swiss consumer confidence dropped to -12.8 from 12 in Q3. Although it is higher than it was in Q2 at the height of the pandemic, it is still lower than in Q1. The expectations on households’ financial situation also dropped to -6.6 from -4.2 in Q2. Households were increasingly pessimistic about the labour market and their job security. this can be attributed to the uncertainties that surround the ongoing coronavirus pandemic. We assign a score of -2.

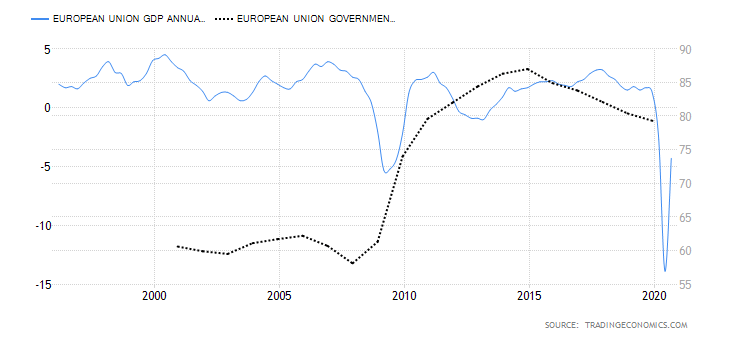
  • Switzerland Government Gross Debt to GDP

This is the total amount that the Swiss government owes to both domestic and international lenders is expressed as a percentage of the GDP. It helps us to understand and evaluate the size of the debt relative to the size of the economy. At below 60%, the government is seen as being able to service its debt obligations and have room to acquire more debt without straining the economy.

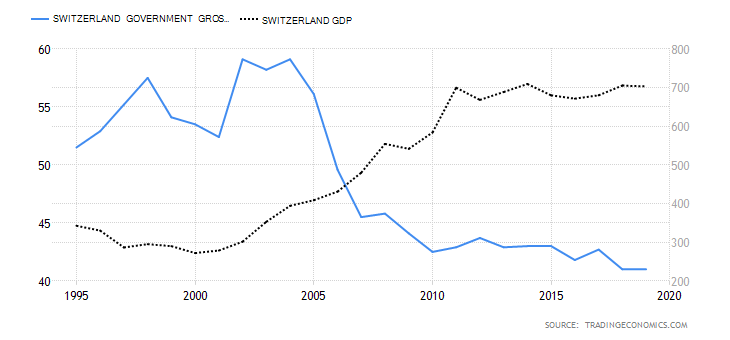
In 2019, the Switzerland government gross debt to GDP was 41% same as in 2018. In 2020, it is expected to range between 49% and 51% due to aggressive expenditure to alleviate the shocks of coronavirus pandemic. We assign a score of -1.

In the very next article, you can find the exogenous analysis of the EUR/CHF Forex pair. Please check that and let us know if you have any questions below. Cheers.

Categories
Forex Fundamental Analysis

EUR/USD Global Macro Analysis – Part 1 & 2

Introduction

In this analysis, we’ll focus on endogenous economic growth factors in the EUR and the US. We’ll also analyze the exogenous factors that will help us compare the economic performance in both regions.

Endogenous economic factors are inherent within the domestic economy and are primarily driven by domestic demand. On the other hand, exogenous factors are external economic factors that result from a country’s participation in the international markets. Both of these factors influence the fluctuation of the currencies from both countries.

Ranking Scale

We will rank both the endogenous and the exogenous economic factors on a scale of -10 to +10. A negative ranking shows that the economic factor had a deflationary impact on the currency. Conversely, a positive ranking implies that it had an inflationary impact.

USD Endogenous Analysis – Summary

The USD endogenous factors recorded a score of -19.1, implying a deflationary effect on the USD. This essentially means that according to these indicators, the USD has lost its value since the beginning of this year.

You can find the complete USD Endogenous Analysis here.

EUR Endogenous Analysis – Summary

The endogenous analysis of the EU economy shows a modest deflationary score of -8.5. This means that in 2020, the Euro has shed some of its inherent value.

The endogenous economic indicators in the Eurozone are an aggregate of the 27 member countries in the EU.

  • Monthly retail sales

It measures the inflation-adjusted value of retail sales. About 40.1% of all retail sales in the EU are from food, drinks, and tobacco. Electronics and furniture account for 11.5%, while computer equipment accounts for11.4%. 9.2% of the retail sales are attributed to clothing and footwear,  while pharmaceutical and medical products account for 8.9%.

In September 2020, retail sales in the EU dropped by 2%. Given that retail sales account for about 70% of the GDP, our correlation analysis, we assign the EU retail sales an inflationary score of 2.5.

  • Industrial production

This indicator measures the total output by manufacturers, mines, and utility industries in the EU. The value is adjusted for inflation. Note that the industrial sector in the EU is among the top employers.

In September 2020, industrial production dropped by 0.4%, which is an improvement from the drop of 17.1% recorded in April. However, the change in industrial production has been steadily falling from a peak of 12.4% in May.

Based on our correlation analysis, we assign the EU change in monthly industrial production a deflationary score of -2.

  • Unemployment rate

This indicator shows the percentage of the total workforce in the EU who are seeking gainful employment. The data shows the monthly change.

In September 2020, the unemployment rate in the EU was 8.3%. Throughout the year, the EU has experienced a steady increase in the unemployment rate. This is due to the economic effects of the coronavirus pandemic. However, our correlation analysis shows the minimal impact of the unemployment rate on the EU GDP. Therefore, we assign it a deflationary score of -2.

  • Employment change

As an economic indicator, employment change shows the quarterly change in the number of EU citizens who are gainfully employed. This indicator can also be used to show the ability of the economy to create more jobs. It measures both full-time and part-time employment.

In the third quarter of 2020, the EU employment change increased by 0.9%, showing that the EU economy is recovering from the slump of Q2 2020. Our analysis shows a higher correlation of the employment change with the changes in GDP. Hence, we assign it an inflationary score of 4.

  • Business confidence

The business sentiment is also referred to as the Industry Sentiment. It measures the economic sentiment among manufacturers, consumers, and employers in the EU by rating the current and future economic conditions.

The lowest business confidence recorded in 2020 was -32.3 in April 2020. Since then, the indicator has been steadily improving to -9.5 in October. Based on the correlation analysis with the EU GDP, we assign business confidence a deflationary score of -3.

  • Consumer Spending

Consumer spending measures the quarterly amount that households spend on goods and services for personal consumption. As an economic indicator, it can be used to show households’ welfare and the prevailing economic conditions. Since consumer expenditure accounts for about 70% of the EU GDP, any changes in the quarterly expenditure are bound to impact the GDP levels directly.

In Q2 of 2020, consumer spending dropped to € 1511.14 billion from € 1716.59 billion in Q1 of 2020. It is the largest drop ever recorded in history and can be attributed to the pandemic-induced economic recession.

Due to its high correlation to the change in GDP, we assign consumer spending a deflationary score of -5.

  • European Union Government Debt To GDP

This ratio compares what the EU economy produces and what it owes. It shows the efficiency of the economic process and the capability of the government to service its debts without overstretching the available resources. Investors can use this ratio to gauge whether the debt in an economy is becoming unsustainable.

Increasing levels of government debt and a stagnating GDP results in a deflationary effect for the domestic currency.

By the end of 2020, the EU government debt to GDP is expected to reach 95% from 79.3% recorded in 2019. The higher government debt to GDP in 2020 is a direct result of the aggressive measures out in place to curb deep recessions from the coronavirus pandemic.

Based on our correlation analysis, we assign a deflationary score of -6 to the EU government debt to GDP.

  • EU Rate of inflation

In the EU, the inflation rate is best measured using the consumer price index (CPI). It measures the overall monthly change in the prices of consumer goods and services. The rate of inflation can be used as gauge the purchasing trends among households.

In theory, a rise in inflation implies that consumers’ demand for goods and services is increasing. Conversely, a drop in inflation implies that demand is shrinking hence corresponding to lower GDP levels.

In September 2020, the rate of inflation in the EU decreased by 0.2%. It is, however, an improvement from the -0.4% recorded in July and August. Based on its correlation with GDP, we assign the EU rate of inflation a score of 3.

In the next article, we have posted the Exogenous Analysis of the EUR/USD pair to have a clear idea of whether this pair is bullish or bearish market conditions.