Categories
Forex Fundamental Analysis

EUR/CHF Global Macro Analysis – Part 3

EUR/CHF Exogenous Analysis

  • The EU and Switzerland Current Account to GDP differential

The ratio of the current account to GDP helps us determine the level of a country’s participation in the international market. When a country has net exports, it means that it will have a current account surplus; and, the larger the surplus, the higher the current account to GDP ratio. Conversely, a country with higher imports than exports; it means it has a current account deficit, and its current account to GDP ratio will be lower.

The domestic currency will be in higher demand in the forex market when a country is a net exporter.

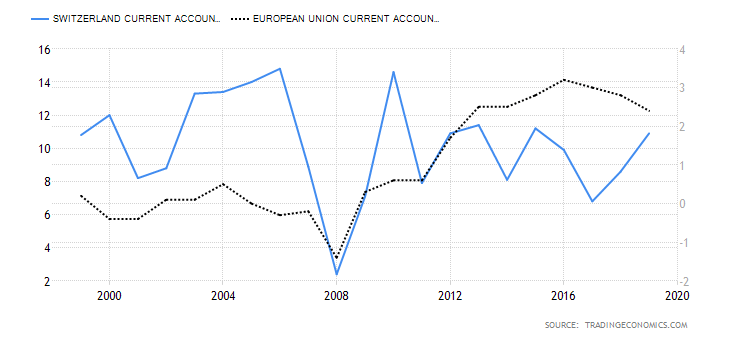
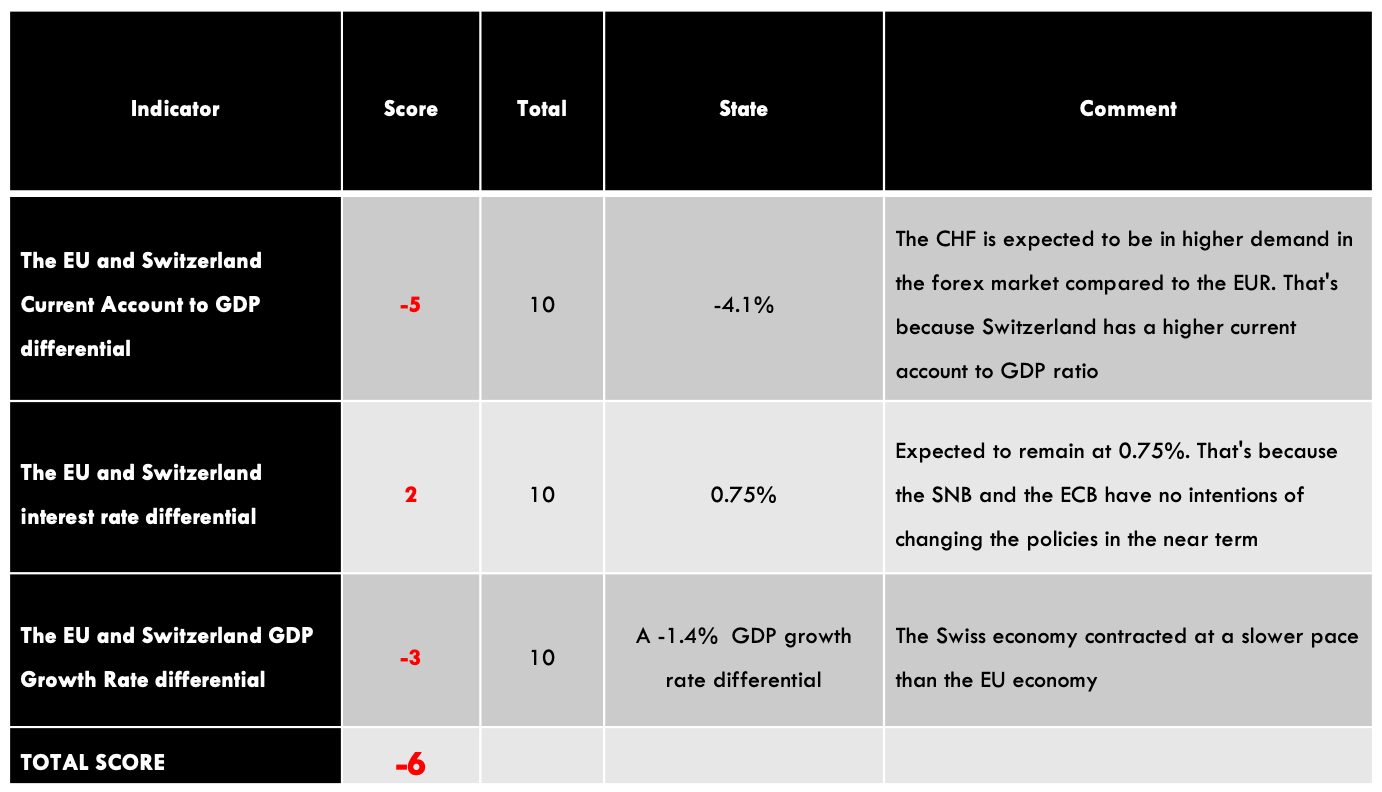
In 2020, the Swiss Current Account to GDP is projected to reach 7.5% and that of the EU 3.4%. Thus, the current account to GDP differential between the EU and Switzerland is -4.1%. That means we should expect that the CHF will be in higher demand than the EUR. Thus, we assign a score of -5.

The interest rate differential for the EUR/CHF pair determines which of these currencies is preferable to investors and carry traders in the forex market. When the interest rate differential is positive, it means that investors will earn more by buying the EUR. Similarly, carry traders will be bullish on the EUR/CHF pair, thus driving the exchange rate higher. A negative interest rate differential implies that the Swiss Franc will be preferable to investors, while carry traders will be bearish on the pair.

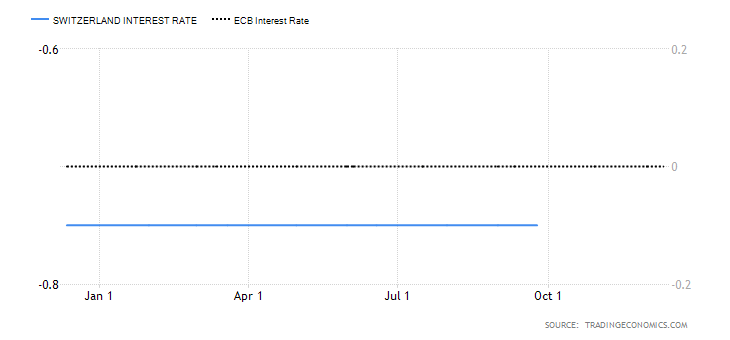
The Swiss National Bank has maintained the interest rate at -0.75% throughout 2020, and the ECB interest rate has been at 0%. The interest rate differential for the EUR/CHF pair is 0.75%. We assign a score of 2.

  • The EU and Switzerland GDP Growth Rate differential

The GDP growth differential is the difference between the rate at which the EU and the Swiss economy are growing. This will help us identify which economy is growing faster. A positive GDP growth differential between the EU and Switzerland will result in a higher exchange rate for the EUR/CHF pair. A negative one will lead to a drop in the exchange rate for the pair.

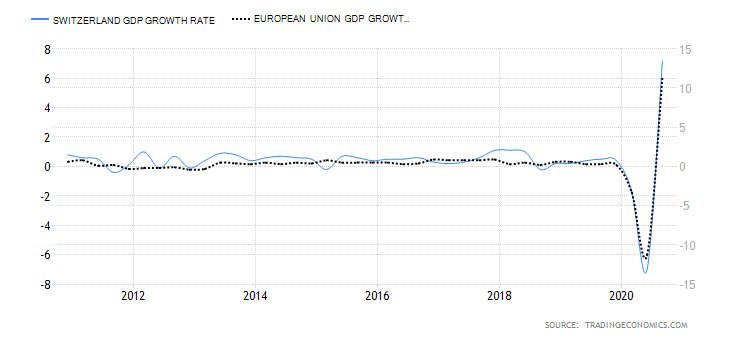
In the first three quarters of 2020, the EU economy has contracted by 2.9% while the Swiss economy contracted by 1.5%. The GDP growth rate differential is -1.4%. We assign a score of -3.

Conclusion

The exogenous factors between the EUR/CHF pair have a score of -6; which implies that the pair can be expected to be on a downtrend in the short term.

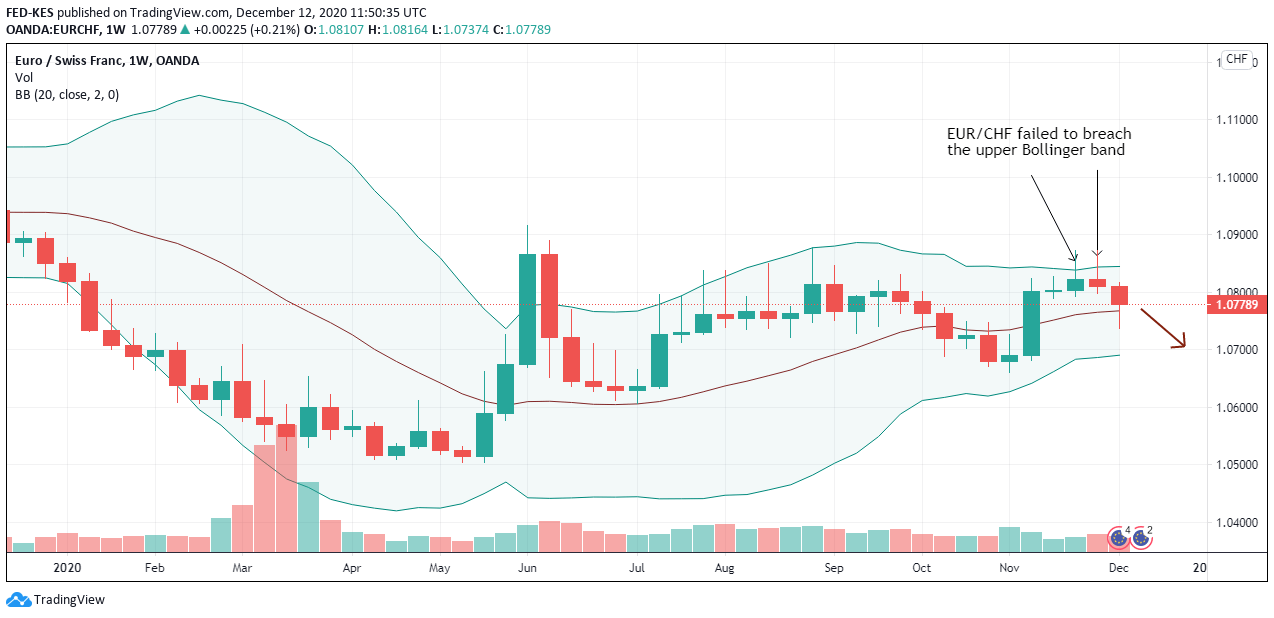
As you can see above, the Technical analysis shows that the weekly chart for the EUR/CHF pair has failed to breach the upper Bollinger band successfully and has bounced off of it supporting our fundamental analysis. All the best.

Categories
Forex Fundamental Analysis

EUR/CHF Global Macro Analysis – Part 1 & 2

Introduction

In conducting the global macro analysis of the EUR/CHF pair, we’ll focus on endogenous economic factors that contribute to the growth of GDP in the EU and Switzerland. Exogenous factors that influence the exchange rate of the EUR/CHF in the forex market will also be analysed.

Ranking Scale

A sliding scale of -10 to +10 will be used to rank the impact of endogenous and exogenous factors.

The ranking of the endogenous factors will be based on their correlation analysis with the GDP growth rate. A negative score implies that they resulted in the contraction of the economy hence depreciating the domestic currency. A positive score implies that they led in economic expansion hence appreciation of the domestic currency.

The exogenous factors are ranked based on their correlation with the EUR/CHF exchange rate. A positive score means that the pair lead to an increase in the exchange rate, while a negative ranking means that the exchange rate has decreased.

EUR Endogenous Analysis – Summary

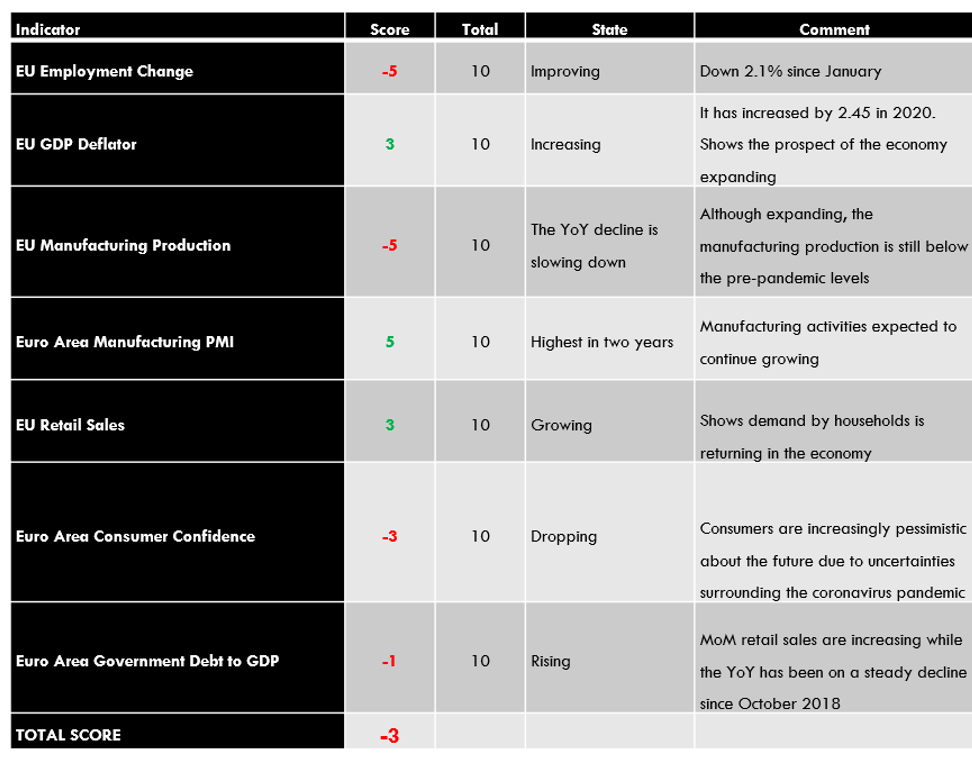
The EUR’s endogenous analysis has a score of -3. This implies that the Euro had marginally depreciated in 2020.

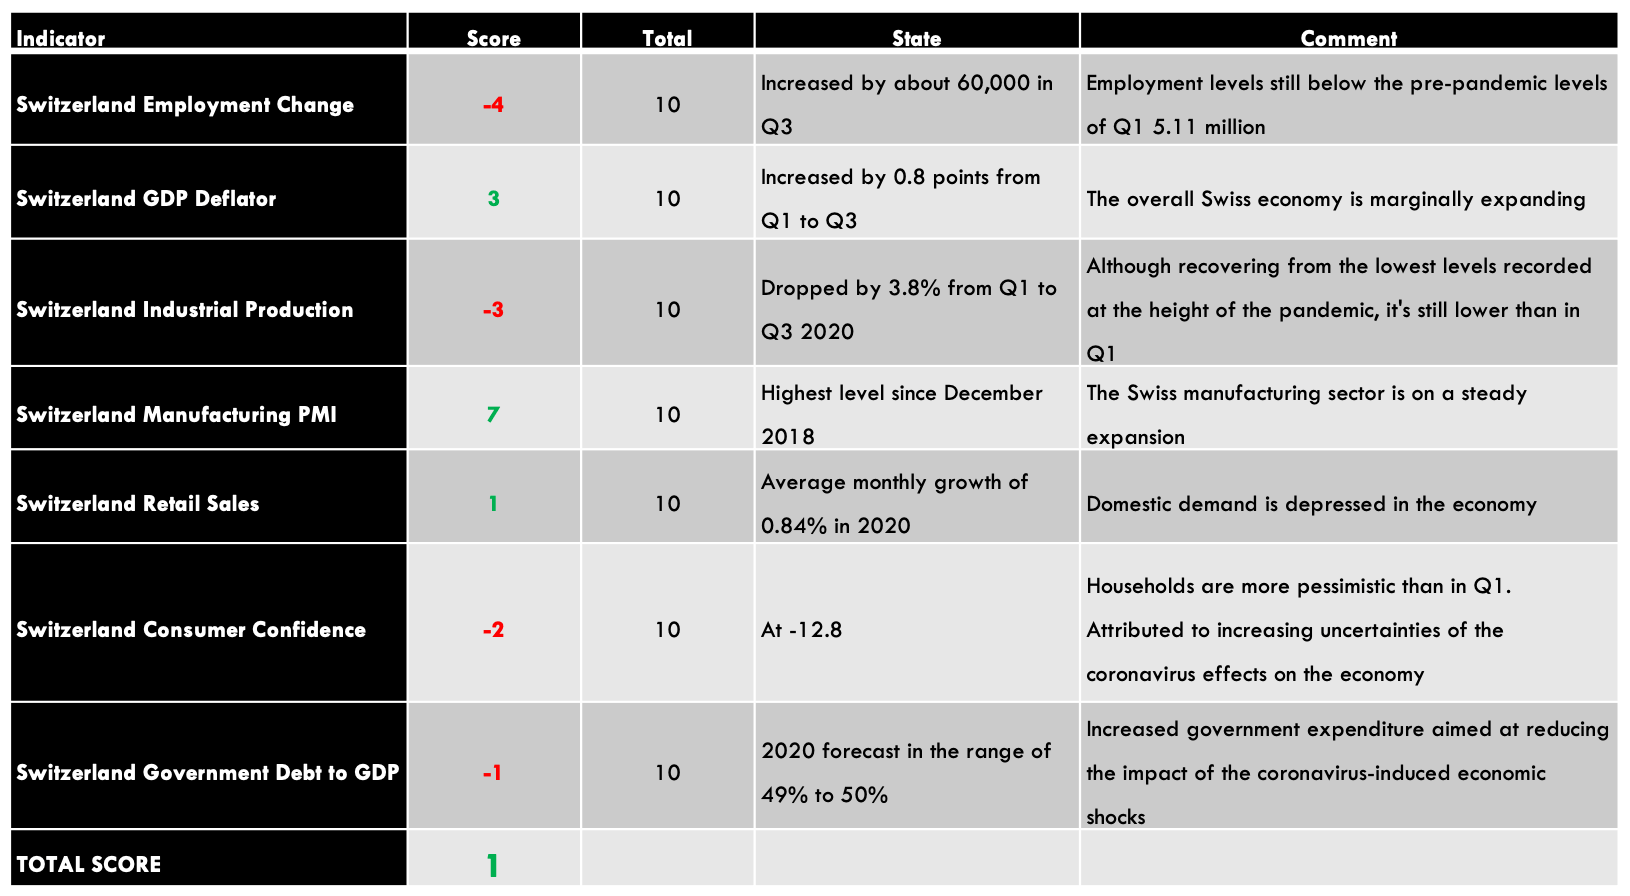
CHF Endogenous Analysis – Summary

The change in the level of employment covers the quarterly developments in the labour market in Switzerland. The statistic includes the changes in both fulltime and parttime employment. Typically, changes in employment is a result of changes in business activities.

In Q3 of 2020, 5.08 million people were employed in Switzerland compared to 5.02 million in Q2. The employment level is still below the 5.11 million registered in Q1. We assign a score of -4.

  • Switzerland GDP Deflator

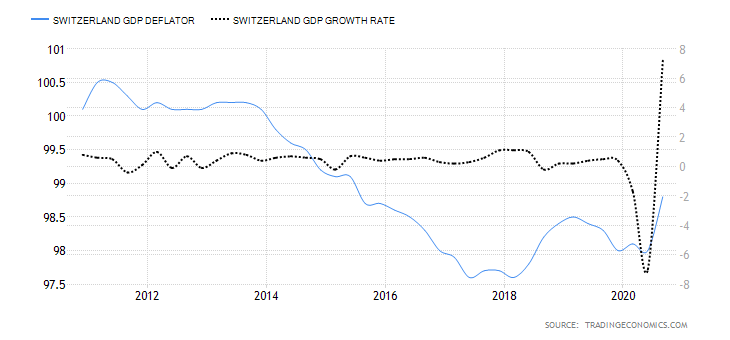
Switzerland GDP deflator is used to calculate the change in real GDP in terms of prices of all goods and services produced within the country. This is a comprehensive measure of inflation compared to measures like CPI and PPI, which only focus on a small portion of the economy.

In Q3 2020, Switzerland GDP deflator rose to 98.8 from 98 in Q2.  Up to Q3, the GDP deflator has increased by 0.8 points. The increase in inflation can be taken as an indicator that the economy is bouncing back from the economic shocks of the coronavirus pandemic. We assign a score of 3.

  • Switzerland Industrial Production

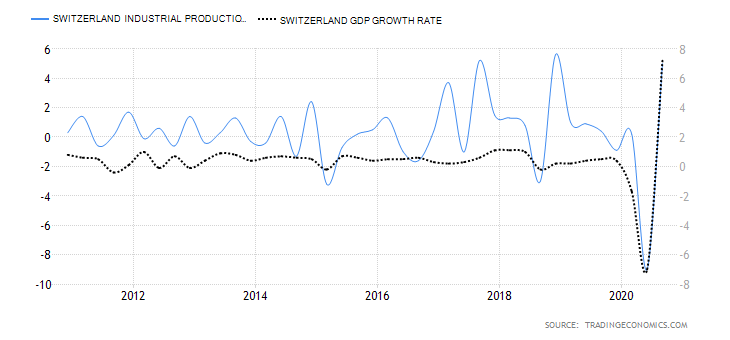
This indicator shows the changes in output for firms operating in the manufacturing, mining, quarrying, and electricity production. Although Switzerland is not heavily dependent on industrial production, it is still an integral part of the economy.

In Q3 2020, the industrial production in Switzerland increased by 5% from a drop of 9% in Q2. The YoY industrial production for Q3 was down 5.1%. For the first three quarters of 2020, the industrial production is down 3.8%. We assign a score of -3.

  • Switzerland Manufacturing PMI

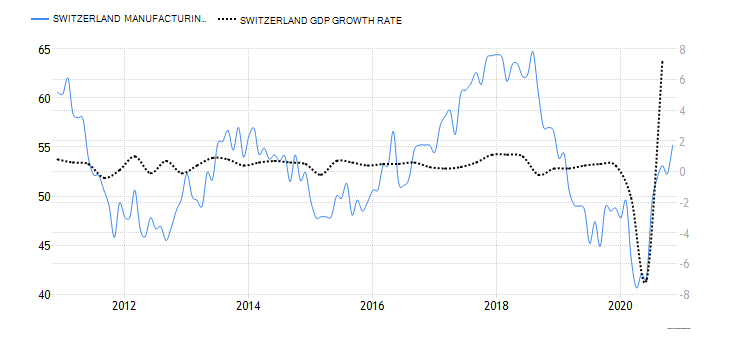
This is an indicator of the economic health of the Swiss manufacturing sector. The purchasing managers are surveyed based in a questionnaire which covers the output in the sector, suppliers’ deliveries, inventories, new orders, prices, and employment. A PMI of above 50 shows that the Swiss manufacturing sector is expanding, while below 50 shows that the sector is contracting.

In November 2020, Switzerland manufacturing PMI rose to 55.2 from 52.3 in October. This is the highest reading since December 2018 and the fourth consecutive month of expansion since July. We assign a score of 7.

  • Switzerland Retail Sales

The retail sales measure the consumption of final goods and services by households in Switzerland. The expenditure by households drives the aggregate demand in the economy, which results in the changes in GDP.

In October 2020, Switzerland retail sales increased by 3.2% from a drop of 3.2% in September. YoY retail sales increased by 3.1% in October from 0.4% in September. Up to October 2020, the average retail sales has increased by 0.84%. We assign a score of 1.

  • Switzerland Consumer Confidence

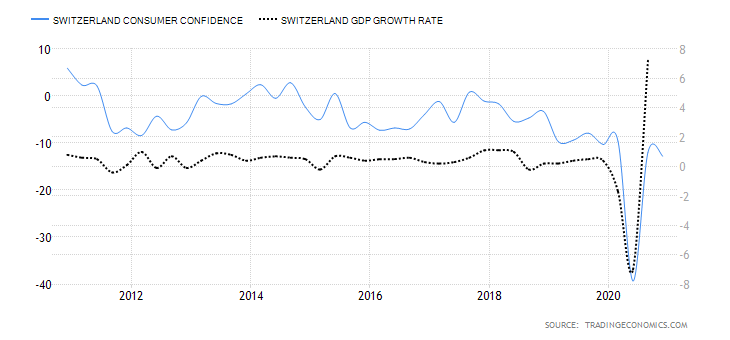
About 1000 Swiss households are surveyed in January, April, July and October. They are evaluated based on their opinions about the economy, job security, financial status, inflation, and purchases. Consumer confidence tends to be higher when the economy is expanding and low during recessions.

In Q4 2020, the Swiss consumer confidence dropped to -12.8 from 12 in Q3. Although it is higher than it was in Q2 at the height of the pandemic, it is still lower than in Q1. The expectations on households’ financial situation also dropped to -6.6 from -4.2 in Q2. Households were increasingly pessimistic about the labour market and their job security. this can be attributed to the uncertainties that surround the ongoing coronavirus pandemic. We assign a score of -2.

  • Switzerland Government Gross Debt to GDP

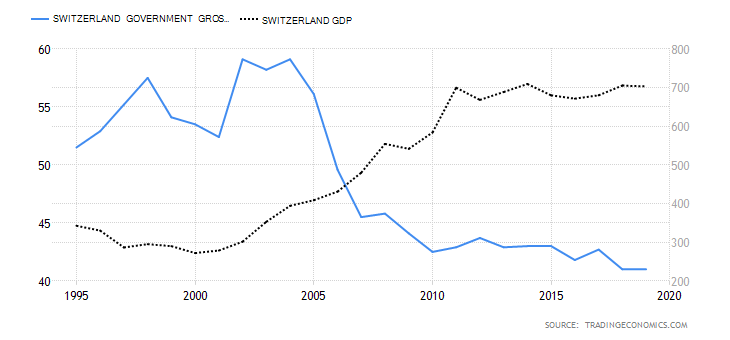
This is the total amount that the Swiss government owes to both domestic and international lenders is expressed as a percentage of the GDP. It helps us to understand and evaluate the size of the debt relative to the size of the economy. At below 60%, the government is seen as being able to service its debt obligations and have room to acquire more debt without straining the economy.

In 2019, the Switzerland government gross debt to GDP was 41% same as in 2018. In 2020, it is expected to range between 49% and 51% due to aggressive expenditure to alleviate the shocks of coronavirus pandemic. We assign a score of -1.

In the very next article, you can find the exogenous analysis of the EUR/CHF Forex pair. Please check that and let us know if you have any questions below. Cheers.

Categories
Forex Signals

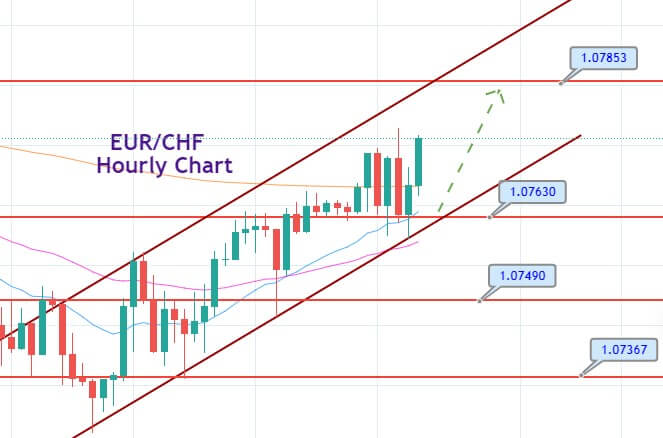
Bullish Channel Underpins the EUR/CHF – Update on Signal!

The EUR/CHF continues trading bullish at 1.0776 as stronger Euro is likely to drive EUR/CHF bullish. The demand for safe-haven assets is keeping the CHF supported; however, the technical side of the market is still dragging the EUR/CHF higher. The optimism over the coronavirus (COVID-19) vaccine/treatment was overshadowed by the concerns about the second wave of coronavirus infections, which fading optimism over a sharp V-shaped global economic recovery. 

Whereas, the U.K. scientist group’s readiness for a state lockdown of almost two weeks and Global Times’ direct war signals to the U.S., over American diplomat’s visit to Taiwan, also exerted downside pressure on the equity market, which tend to underpin the safe-haven Swiss Franc.

Despite the risk-off market sentiment, the broad-based U.S. dollar failed to achieve any positive traction and trimmed lower on the day as doubts persist over the global economic recovery from COVID-19. The disappointing U.S. employment data witnessed that. Apart from this, another rout in U.S. tech stocks also undermined the U.S. dollar. However, the losses in the U.S. dollar becomes the key factor that kept the pressure on any additional gains in the pair. While, the U.S. Dollar Index, which tracks the greenback against a bucket of other currencies, dropped by 0.05% to 92.927 by 12:48 AM ET (5:48 AM GMT).


Technically, the EUR/CHF is supported over 1.0763 level, and closing of candles above this support level may drive further buying until 1.0785. The MACD and 50 EMA are also supporting an upward trend in the market. Recent bullish engulfing is also supporting the bullish trend in the market. Checkout a trading plan below…

Entry Price – Buy 1.07692

Stop Loss – 1.07292

Take Profit – 1.08092

Risk to Reward – 1:1

Profit & Loss Per Standard Lot = -$400/ +$400

Profit & Loss Per Micro Lot = -$40/ +$40

Fellas, now you can check out forex trading signals via Forex Academy mobile app. Follow the links below.

iPhone Users: https://apps.apple.com/es/app/fasignals/id1521281368

Andriod Users: https://play.google.com/store/apps/details?id=academy.forex.thesignal&hl=en_US

Categories
Forex Market Analysis

Daily F.X. Analysis, August 10 – Top Trade Setups In Forex – Market Prices In NFP Outcome! 

On the news front, eyes will be on the low impact events such as Sentix Investor Confidence from Eurozone and JOLTS Job Openings from the U.S. Besides, the stronger NFP data may keep dollar bullish.

Economic Events to Watch Today  


EUR/USD – Daily Analysis

The EUR/USD prices were closed at 1.17849 after placing a high of 1.18829 and a low of 1.17550. Overall the movement of the EUR/USD pair remained bearish throughout the day. The EUR/USD pair broke under the 1.1800 level and reached 1.175 the lowest in 3 days after the U.S. dollar took its pace and outperformed in the market. The greenback rebounded from its two years low and trimmed its weekly losses on Friday that weighed on EUR/USD pair.

The rising tensions between the U.S. & China have already driven the U.S. dollar higher, and the U.S. jobs data on Friday added further strength to it. The latest development in the US-China conflict was the U.S. imposed sanctions on officials in Hong Kong and China, including Hong Kong leader Carrie Lam, over the suspension of protests in the territory.

On the data front, at 11:00 GMT, the German Industrial Production for June increased to 8.9% from the forecasted 8.3% and supported Euro. The German Trade Balance also came in positive as 14.5 B against the expected 10.3 B. At 11:45 GMT, the French Industrial Production for June increased to 12.7% against the forecasted 8.6% and supported Euro. The French Prelim Private Payrolls for the quarter came in as -0.6% against the anticipated -1.0%.

The French Trade Balance for June came in negative as 8.0B against the projected -7.1B and weighed on Euro. The Italian trade Balance at 13:00 GMT came in line with the expectations of 6.23 B.

Investors failed to cheer the positive data from Europe as the U.S. dollar was stronger on Friday, and the sharp decline in Turkish Lira over the past week exerted downside pressure on Euro.

A sharp selloff triggered the Euro’s correction in Turkish Lira that dropped it to the lowest of 2 years, the historic currency crisis of August 2018. The reserves of Central Banks of Turkey (CBRT) went negative for a couple of weeks, which caused a surge in the Turkish Lira’s selloff. However, last month, CBRT made a massive purchase of gold and overtook Russia as the world’s largest gold purchaser. In the lira currency crisis of 2018, Euro underperformed during that time period, and this has raised fears that if the history repeated, then downside risks for Euro can be seen.

However, on the U.S. front, at 17:30 GMT, the Average Hourly Earnings for June increased to 0.2% from the forecasted -0.5% and supported the U.S. dollar. The Non-Farm Employment Change suggested that 1.8M jobs were created in June against the expectations of 1.6B and supported the U.S. dollar. In the month of June, the Unemployment Rate also fell to 10.2% from the expected 10.5% and weighed on the U.S. dollar. The strong U.S. dollar weighed heavily on EUR/USD pair and dragged its prices to the level below 1.8000 on Friday.


Daily Technical Levels

Support Pivot Resistance
1.1773 1.1783 1.1792
1.1764 1.1802
1.1754 1.1812

EUR/USD– Trading Tip

The EUR/USD pair retraced lower to trade at 1.1793 level. On the upside, the EUR/USD may encounter resistance at 1.1865 and 1.1909 mark. A bullish breakout at this level can extend the buying trend to 1.2050. Today, the EUR/USD is likely to find support at 1.17650 level, and below this, further selling can be seen until the 1.1713 level. Let’s keep a focus on 1.1805 level to stay bearish below this in the EUR/USD pair.


GBP/USD – Daily Analysis

The GBP/USD pair was closed at 1.30521 after placing a high of 1.31492 and a low of 1.30092. Overall the movement of GBP/USD pair remained Bearish throughout the day.

The Pound to U.S. dollar exchange rate fell by -0.3% on Friday to a low of 1.3000. The Sterling fell against the U.S. dollar after the concerning comments from the UK Chancellor Rishi Sunak, who warned that the extended furlough scheme would only give false hopes to the people. Mr. Sunak said that it was wrong to trap the people in a situation and pretended that there was always a job that they can go back to.

However, apart from this downbeat comment, Mr. Sunak also raised hopes for a possible Brexit deal and said that he was confident that there was a possibility to get an agreement with the E.U. by September. As in result, GBP investors became hopeful that there was possible progress in the EU-UK trade talks.

On the data front, the Halifax House Price Index for July rose from 0% to 1.6% and beat the expectations of 0.2%. However, the GBP investors failed to cheer the U.K.’s positive data as the U.S. dollar was strong across the board on Friday.

The U.S. dollar gained traction on the board on Friday after the release of better than expected U.S. jobs data. The latest US Non-Farm Employment Change suggested an increase in the number of jobs created in June by the U.S. Department of Labor & Statistics to 1.8M from the expected 1.5M and helped the U.S. dollar gain traction.

The Average Hourly Earnings from the U.S. also rose to 0.2% from the previous -1.3% and the expected -0.5% and supported the U.S. dollar. The Unemployment Rate for June dropped to 10.2% against the expected 10.5% and May’s 11.1%. The less unemployment rate from the U.S. showed that the U.S. economy was moving on the recovery side even after the widespread coronavirus cases across the country.

The better than expected U.S. jobs data weighed heavily on GBP/USD pair and dragged it to 1.3000 level on Friday. The Sterling traders will be looking ahead to Monday’s release of the latest Retail Sales figures from the U.K. Any improvement in the U.K.’s retail sector would provide strength to Sterling.

The U.S. Dollar Investors will be looking at the publication of the US NFIB business optimism index for July. The demand for safe-have greenback can be lifted after any improvement in the outlook for the American economy. On Tuesday, the release of the U.K.’s ILO unemployment rate report for June. If the figures came in equal to 3.9% or less, we could see the GBP/USD pair go on the upward as fears of high unemployment will be diminished.

Daily Technical Levels


Support Pivot Resistance
1.3037 1.3052 1.3065
1.3024 1.3080
1.3010 1.3093

GBP/USD– Trading Tip

The GBP/USD consolidates at 1.3067 level, holding right above the 50 periods EMA support area of 1.3040 level while the bearish breakout of 1.3040 level can extend selling unto 1.2918 level. Recently as we can see in the chart above that the GBPUSD pair has violated its upward trendline that supported the pair around 1.3130 level, and now below this, we can expect GBP/USD to continue trading bearish. The GBP/USD should show

a bearish crossover in order to confirm a strong selling bias in the Cable. On the higher side, Sterling may find resistance at 1.3105 and 1.3175. Let’s consider selling below 1.3045 level today. 


USD/JPY – Daily Analysis

The USD/JPY pair was closed at 105.912 after placing a high of 106.055 and a low of 105.478. Overall the movement of the USD/JPY pair remained bullish throughout the day. After falling for two consecutive days and staying flat for a day, USD/JPY pair rose and posted gains on Friday amid strong U.S. dollar comeback.

Since two years after U.S. President Donald Trump decided to ban U.S. transactions with two popular Chinese apps, the U.S. dollar rebounded from the lowest level. During the occasions of massive conflicts between the U.S. & China, the U.S. dollar has often preferred as a refuge, and on Friday, the U.S. dollar again used this status.

The U.S. President Donald Trump officially banned American companies from working with TikTok, the video streaming app, and WeChat, the social messaging app. the action to ban these companies was taken in response to the widespread fears of data privacy. However, the chances that the US-China conflict will rise further increased after this move, and hence, the U.S. dollar gained.

Meanwhile, the U.S. Treasury imposed sanctions on 10 top officials from Hong Kong and China, including the Hong Kong Leader Carrie Lam, as the protests arose in the territory against the new security law in Hong Kong.

Furthermore, the U.S.’s macroeconomic data also remained supportive of the U.S. dollar when it came to better than expectations on Friday. 

At 17:30 GMT, the highlighted Average Hourly Earnings rose to 0.2% in June from the negative expectations of -0.5% and supported the U.S. dollar. The Non-Farm Employment Change rose to 1763K from the forecasted 1530K and came in favor of the U.S. dollar. The greenback was also supported after the Unemployment rate for June also dropped to 10.2% from the expected 10.5%. In June, the better-than-expected U.S. jobs data gave a push to the U.S. dollar that added further strength to USD/JPY pair on Friday.

However, the gains remained limited as the data from Japan was also supportive of its local currency. At 04:30 GMT< the Average Cash Earnings for the year from Japan came in as -1.7% against the forecasted -3.0% and supported the Japanese Yen. The Household Spending for the year from Japan also came in as -1.2% against the expectations of -7.8% and supported the Japanese Yen. However, the Leading Indicators from Japan were released at 10:00 GMT, came in line with the expectations of 85.0%.

The positive data from Japan supported Japanese Yen on Friday that kept a check on USD/JPY pair gains. On the vaccine front, the risk sentiment was supported by the news that Russia was all set to register the world’s first COVID-19 vaccine next week. The Russian vaccine third phase trials were currently in progress, and Russia announced to disclose them on August 12. This vaccine was developed by the collaboration of the Russian Defence Ministry and the Gamaleya Research Institute.

The improvement in risk sentiment weighed on safe-haven Japanese Yen and contributed to the USD/JPY pair’s gains.

Daily Technical Levels

Support Pivot Resistance
105.8200 105.8900 105.9300
105.7800 106.0000
105.7200 106.0400

USD/JPY – Trading Tips

The USD/JPY continues to trade at 105.780 area with the bullish sentiment, especially after testing the 38.2% Fibonacci support level of 105.650. On the lower side, the USD/JPY may find support at 105.600 and 105.078 level, which is extended by the 38.2% and 61.8% Fibonacci retracement level. A bullish breakout of 106.467 resistance level can drive more buying until the next resistance area f 107.198. The current market price of USDJPY is staying over 50 EMA, which extends support and may push the pair higher. Let’s consider buying above 105.600 level today. Good luck! 

Categories
Forex Signals

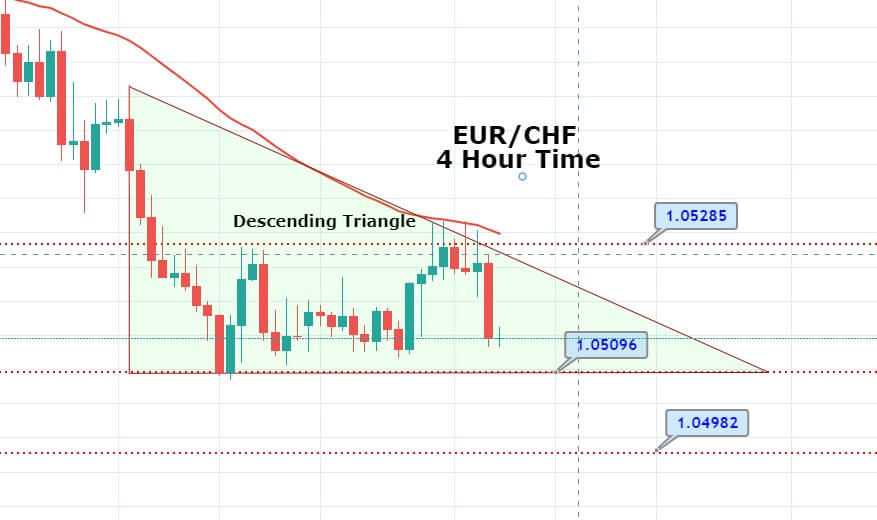
EUR/JPY Descending Triangle Pattern – Quick Update on Signal

The EUR/CHF is trading in a selling channel, having dropped from 1.0520 level heading to test the triple bottom support zone of 1.0509. The demand for safe-haven appears to have increased due to the increased number of coronavirus cases around the globe. The strength of the single currency Euro is also keeping the pair supported. Most of the selling in the single currency euro rise in the wake of the dovish ECB monetary policy stance in the wake of the COVID19 crises.  

The single currency euro exhausted following the European Central Bank, which announced more stimulus to accommodate the coronavirus impact. The ECB endorsed new stimulus measures to support the euro-region economy to deal with the increasing damage of the coronavirus disease. 


The EUR/CHF has developed a descending triangle pattern on the 4-hour timeframe which is supporting the pair at 1.0509 along with resistance around 1.0528. On the 4 hour timeframe, a bearish breakout of 1.0509 can lead the pair towards 1.0490 and even lower. As we see, the 50 periods EMA gave a hard time to EUR/CHF, which faced strong resistance around 1.0525. Considering selling bias, we have entered the selling trade at 1.05159 with a stop loss at 1.05659 and take profit at 1.04659. 

Entry Price: Sell at 1.05159 

Take Profit 1.04659

Stop Loss 1.05659 

Risk/Reward 1.00

Profit & Loss Per Standard Lot = -$‭‭516.5‬/ +$516.5

Profit & Loss Per Micro Lot = -$51.65/ +$‭51.65

Categories
Forex Market Analysis

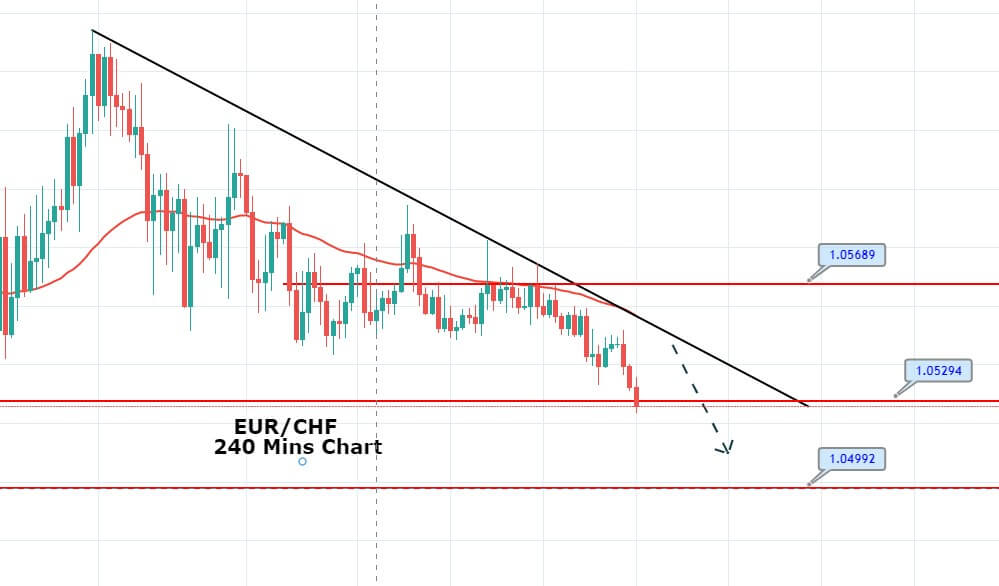
EUR/CHF Descending Triangle Breakout – Time to Short the Pair!  

The EUR/CHF pair hasn’t changed much as the previously formed descending triangle pattern is still supporting the pair around 1.0520 along with resistance around 1.05675. The 50 EMA and the descending trendline is weighing on the Euro cross pair, and it may drive additional bias in the EUR/CHF today. 

Spain and Italy have already released the report of inflation numbers for the month of March. In March 2020, the Consumer Price Index (CPI) grew by 0.1% over a month, following stability in the prior month. Manufactured goods prices stimulated (+1.4% after +0.2%), in the wake of winter sales in February. Tobacco prices rose by 6.6%, because of a tax hike. Despite this, the single currency Euro is getting weaker in the wake of COVID 19 increase number of cases around the globe. 


EUR/CHF- Daily Technical Levels

Support  Resistance 

1.0533      1.056

1.052        1.0573

1.0493      1.06

Pivot Point 1.0547

The EUR/CHF has created a descending triangle pattern that was underpinning the pair at 1.0520 along with resistance at 1.05675. As we can see, the EUR/CHF pair is already trying to breach the descending triangle. Usually, descending triangle patterns tend to break down thus, it may open further selling bias until the next target 1.0470. 

On the 4 hour chart, the 50 periods EMA and the descending trendline are pressing the EUR/CHF currency pair lower, and it may drive further selling bias in the EUR/CHF. 

Good luck! 

Categories
Forex Signals

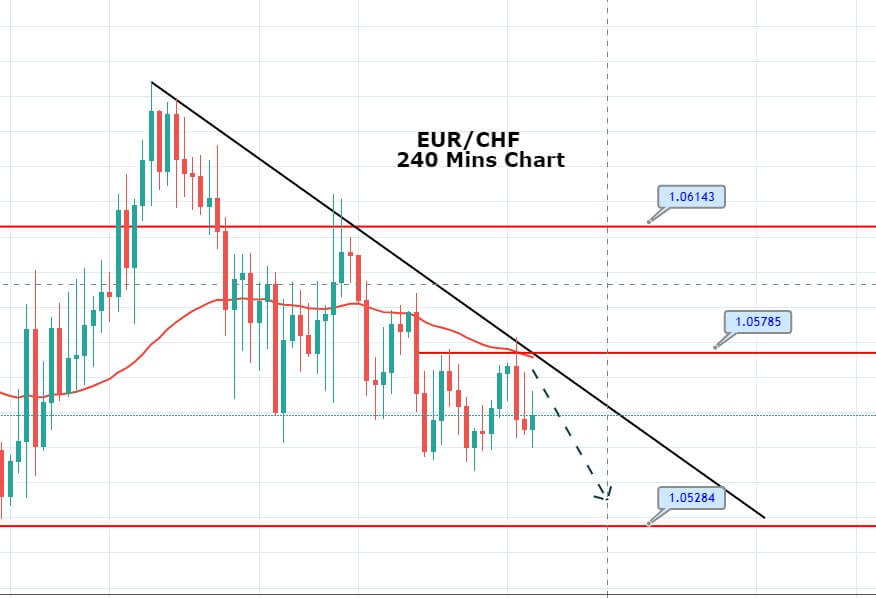
EUR/CHF Descending Triangle Pattern – Time to Place a Sell Limit!  

The EUR/CHF is facing strong resistance around 1.05730, which is mostly extended by a downward trendline on the 4-hour timeframe. The 50 periods EMA is keeping the EUR/CHF pair around 1.0578. The Euro as a signal currency is still staying bearish in the wake of an increased number of COVID 19 cases around the globe.  

As per the coronavirus latest report, the cases rose by 3,677 in Germany when compared with Sunday’s 5,936 new infections, showing the 4th-straight drop in the daily rate. The death toll rose by 92.

On the other hand, the declines in the oil prices could be recovered during the day ahead mainly due to the risk recovery in the market, as the coronavirus cases are showing some sign of a slowdown in the US, Italy, and Spain slowing down over the weekend. 


The EUR/CHF continues to trade below a resistance level of 1.05750. Closing of candles below this level has the potential to lead the EUR/CHF prices further down towards the next support level of 1.05330. On the higher side, the bullish breakout of 1.0570 can lead the pair towards 1.0590. The RSI and Stochastic remain neutral, as its values are tossing in the bullish and bearish zone.

Sell Limit Price: Sell at 1.05741    

Take Profit  1.05241    

Stop Loss 1.06241

Risk/Reward 1.00

Profit & Loss Per Standard Lot = -$511/ +$511

Profit & Loss Per Micro Lot = -$51.1/ +$51.1

Categories
Forex Signals

EUR/CHF Set to Test Major Resistance – Is It Good Time to Short? 


The EUR/CHF is trading at 1.05935 after testing the 61.8% Fibonacci support around 1.0570. Closing of candles above this level may drive buying in the market until 1.06060 and 1.06235 resistance areas. On the lower side, a bearish breakout of 1.0570 level can lead the EUR/CHF prices towards the next support level of 1.0530.

EUR currency may not find buyers due to intensifying recession fears. Moreover, the European Central Bank’s decision to launch a fresh EUR 750 billion worth of QE program could keep the EUR buyers quiet.


EUR/CHF- Daily Technical Levels

Support Resistance 

1.0563 1.0635

1.0527 1.0672

1.0455 1.0745

Pivot Point 1.06

Technically, EUR/CHF is keeping the bearish bias as the pair has closed a bearish engulfing candle below 1.0602 support become resistance area, and the MACD is also in the selling zone. Both support the sentiment that the pair has the potential to go after further lower towards 1.0560 soon. 

Entry Price: Sell at 1.05868

Take Profit 1.05468

Stop Loss 1.06268

Risk/Reward 1.00

Profit & Loss Per Standard Lot = -$410/ +$410

Profit & Loss Per Micro Lot = -$41/ +$41