Introduction
A global macro analysis attempts to analyze the endogenous factors that influence the value of a country’s domestic currency and exogenous factors that affect how the domestic currency fairs in the forex market. The endogenous analysis will cover fundamental economic factors that drive GDP growth in the UK and the Euro Area. The exogenous factors will analyze the price exchange rate dynamics between the EUR and the GBP.
Ranking Scale
Both the endogenous and the exogenous factors will be ranked on a scale of -10 to +10. A negative ranking for the endogenous factors means that they had a deflationary effect on the domestic currency. A positive ranking implies that they had an inflationary impact. Similarly, a negative score for the exogenous factors means the EUR/GBP is bearish and bullish when the score is positive.
EUR Endogenous Analysis – Summary
The endogenous analysis of the EUR has an overall score of -3. Based on the factors we have analyzed, we can expect that the Euro has marginally depreciated in 2020.

- European Union Employment Change
This is a quarterly measurement of the changes in both part-time and full-time employment in the EU. It includes individuals working for profit or pay and those who perform family work unpaid. Changes in employment help put economic growth in perspective since an expanding economy corresponds to increased employment opportunities and a contracting economy leads to job losses.

In the third quarter of 2020, employment in the EU increased by 0.9% compared to the 2.7% drop in Q2. Up to Q3 2020, employment in the EU has dropped by 2.1 %. Based on correlation with GDP, we assign a score of -5.
- European Union GDP Deflator
The GDP deflator is an in-depth measure of the rate of inflation. It measures the changes in the price levels of all goods and services produced in an economy. Therefore, it is the perfect measure of the changes in real economic activities. i.e., it filters out any nominal changes in price.
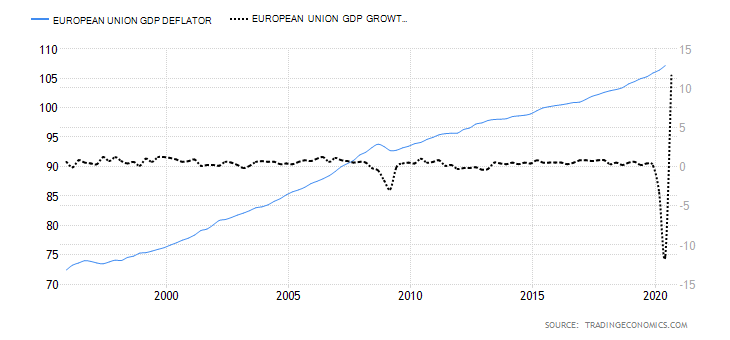
In Q3 of 2020, the EU GDP deflator rose to 107.17 from 106.37 in Q2. Cumulatively, the EU GDP deflator in 2020 has increased by 2.45. We assign a score of 3 based on the weak correlation between the inflation rate and GDP.
- European Union Manufacturing Production
In the EU, manufacturing production accounts for about 80% of the total industrial output. With most EU economies heavily reliant on manufacturing, the sector forms a significant portion of the GDP and the labor market.
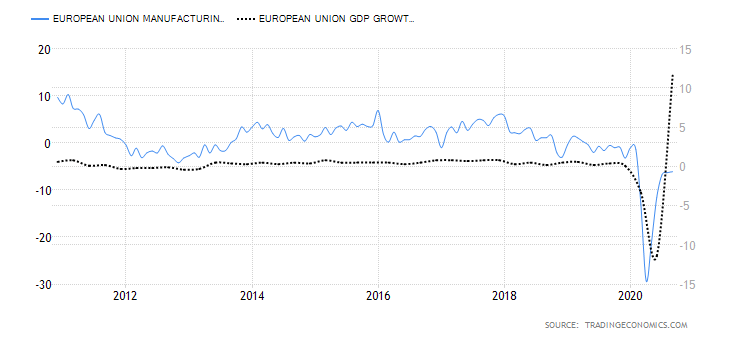
In September 2020, the YoY manufacturing production in the EU decreased by 6.1%. This is an improvement from the decline of 6.3% in August. The overall industrial production reduced by 5.8% during the period.
We assign a score of -5 based on its correlation with the GDP.
- Euro Area Manufacturing PMI
Markit surveys about 3000 manufacturing firms. The Markit manufacturing PMI comprises five indexes: new orders accounting for 30% weight of the index, output 25%, employment 20%, delivery by suppliers 15%, and inventory 10%. The Euro Area manufacturing is seen to be improving when the index is above 50 and contracting when below 50. At 50, the index shows that there is no change in the manufacturing sector.
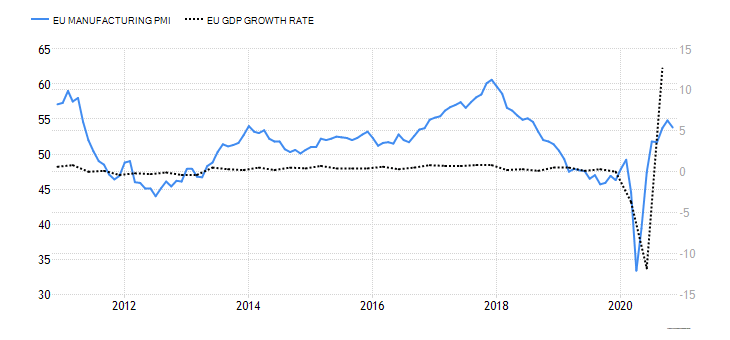
In November 2020, the IHS Markit Eurozone Manufacturing PMI was 53.8, down from 54.8 registered in October. The October reading was the highest ever recorded in the past two years. Despite the November drop, the manufacturing PMI is still higher than during the pre-pandemic period. We, therefore, assign a score of 5.
- European Union Retail Sales
Retail Sales measures the change in the value of goods and services purchased by households for final consumption. In the EU, food, drinks, and tobacco contribute to the highest in retail sales – 40%. Furniture and electrical goods account for 11.5%, books and computer equipment 11.4%, clothing and textile 9.2%, fuel 9%, medical and pharmaceuticals 8.9%, non-food products and others 10%.
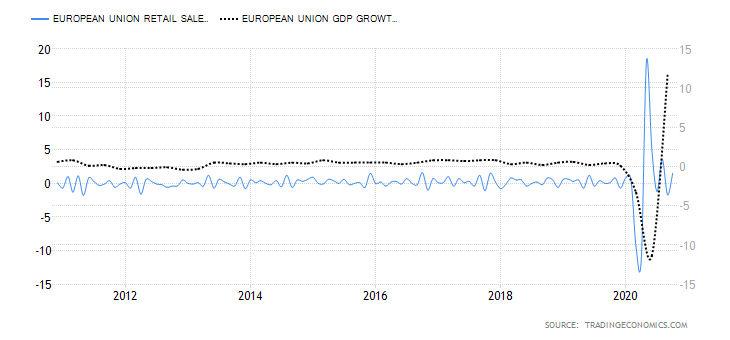
In October 2020, the MoM EU retail sales increased by 1.5%, while the YoY increased by 4.2%. Based on our correlation analysis with EU GDP, we assign a score of 3.
- Euro Area Consumer Confidence
The consumer confidence survey in the Euro Area covers about 23,000 households. Their opinions are gauged from issues ranging from economic expectations, financial situation, savings goals, and expenditure plans on households’ goods and services. These responses are aggregated into an index from -100 to 100. Consumer confidence is a leading indicator of household expenditure, which is a primary driver of the GDP.
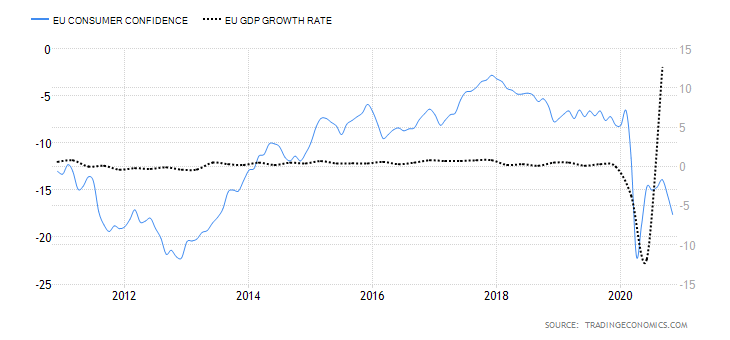
In November 2020, the Euro Area consumer confidence was -17.6, down from -15.5 in October. It is also the lowest reading since May – primarily because of the new lockdown measures bound to impact the labor market. Based on correlation with GDP, we assign a score of -3.
- Euro Area Government Debt to GDP
This is meant to gauge whether the government is over-leveraged and if it might run into problems servicing future debt obligations.

The Euro Area Government Debt to GDP dropped from 79.5% in 2018 to 77.6% in 2019. In 2020, it is projected to hit 102% but stabilize around 92% in the long run. Based on correlation with GDP, we assign a score of -1.
In our very next article, we have performed the Endogenous analysis of GBP to see if it has appreciated or depreciated in this year. Make sure to check that and let us know in case of any questions in the comments below. Cheers.