Introduction
A correlation coefficient is a number that describes the extent to which two instruments are correlated to each other. The number ranges between -1 and +1. This number moves from periods of positive correlation to periods of negative correlation. Located on one end of the scale, +1 is considered a state of the positive correlation between two instruments.
If the number is anywhere between 0 and +1, the two assets are said to move in the same direction, with a certain degree of positive correlation. On the other end of the scale, -1 is considered a state of negative correlation between two instruments. If the number is anywhere between 0 and -1, the two instruments are said to move in the opposite direction, with a certain degree of negative correlation.
The strategy we will be discussing today seeks to exploit the inverse correlation between the dollar index and Gold’s price. According to the World Gold Council, Gold tends to rise when the U.S. dollar falls. It is observed in the past that the correlation coefficient for Gold and the dollar index was between -0.6 and -0.8. This means if the dollar index is up, there is a 60% to 80% chance that gold prices would come down. In contrast, if the dollar index is down, there is a 60% to 80% chance that gold prices would come down. Let us see how the strategy works.
Time Frame
The commodity correlation strategy works well in the Daily (D) time frame. This implies that each candlestick on the chart represents the price movement of one day.
Indicators
We will be using the ATR indicator in the strategy. No other indicators are required for the strategy.
Currency Pairs
There are two charts we need to focus on in this strategy. The first one is the spot Gold or XAU/USD, and the second one is the chart of the dollar index.
Strategy Concept
The dollar index’s price action is used as a reference to initiate a trade on the XAU/USD. Technical levels of support and resistance on the dollar index chart are used to spot long and short trades on XAU/USD. If the price closes below the support on the dollar index chart, a long trade is initiated on the XAU/USD the following day. Similarly, if price closes above resistance on the dollar index chart, a short trade is initiated on the XAU/USD the following day. The risk-to-reward of this trade is 1:2. A bigger target can be achieved by allowing the trade to run its course.
The strategy is very simple for those who have a basic understanding of support and resistance. Another reason behind its popularity is that it does not involve the usage of complex indicators. The trade setups are not formed too often as we are using the daily time frame charts. Hence, a lot of patience is required for the application of the strategy.
Trade Setup
Here are the steps to implement the commodity correlation strategy. In both the instruments, we will be using the daily time frame chart only.
Step 1
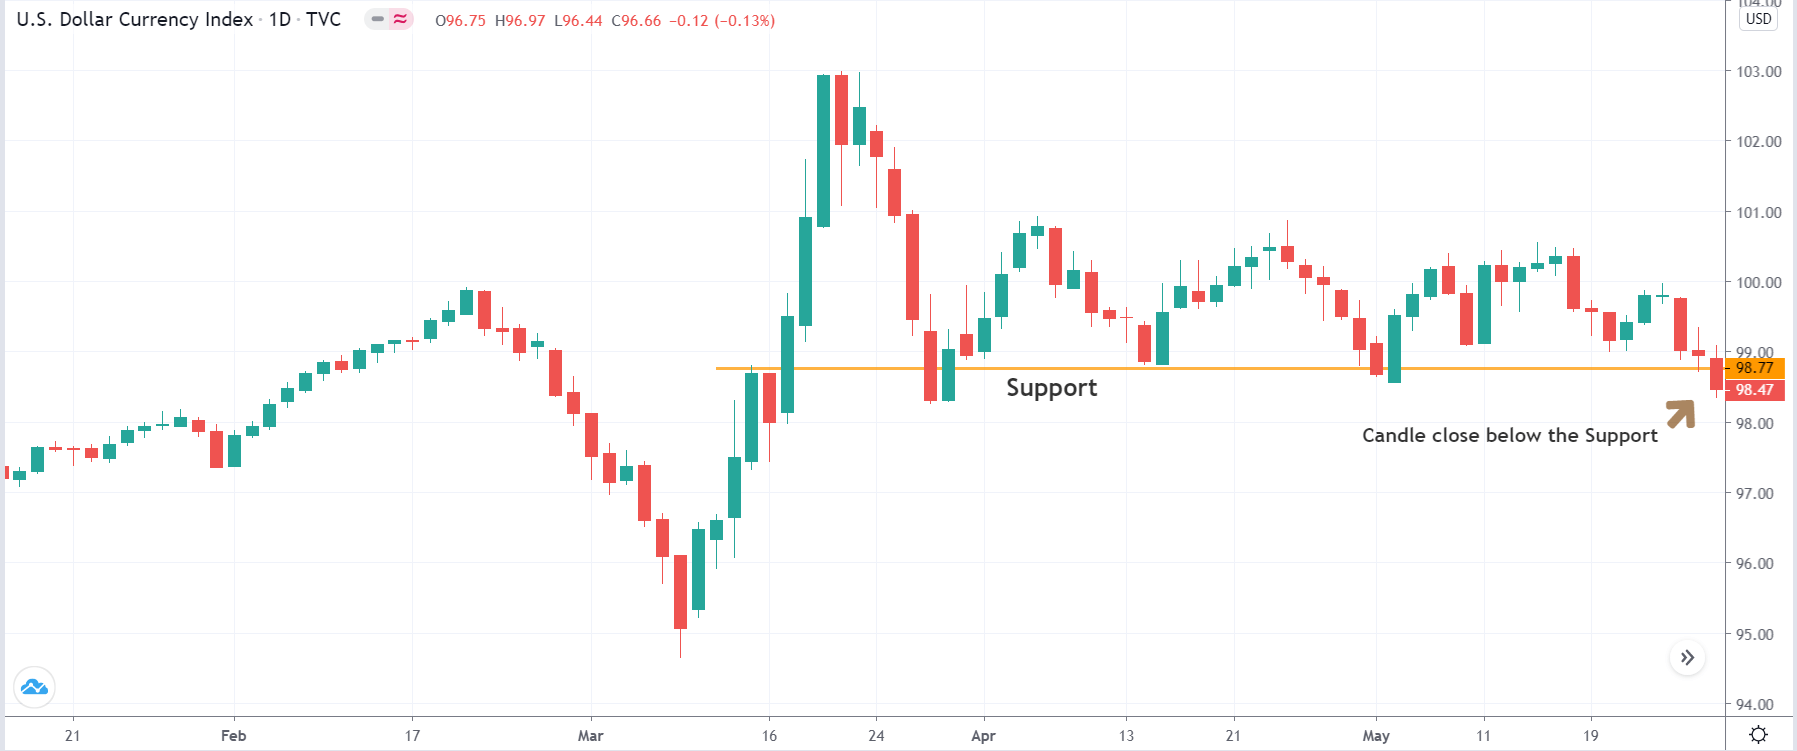
The first step of the strategy is to open the dollar index’s daily time frame and mark key areas of support and resistance on the chart. If one is looking for ‘long’ trades, the identification of the support area is crucial. And if one is looking for ‘short’ trades, identification of ‘resistance’ trade is crucial. After marking out of the lines, wait for the price to breakout or breakdown. In case of a breakout, we will look for ‘short’ trades in ‘gold,’ and in case of a breakdown, we will look for ‘long’ trades in ‘gold.’
We have taken an example of a ‘long’ trade where we will be executing the steps of the strategy. In the below image, one can see that the price has broken below the long term support.
Step 2
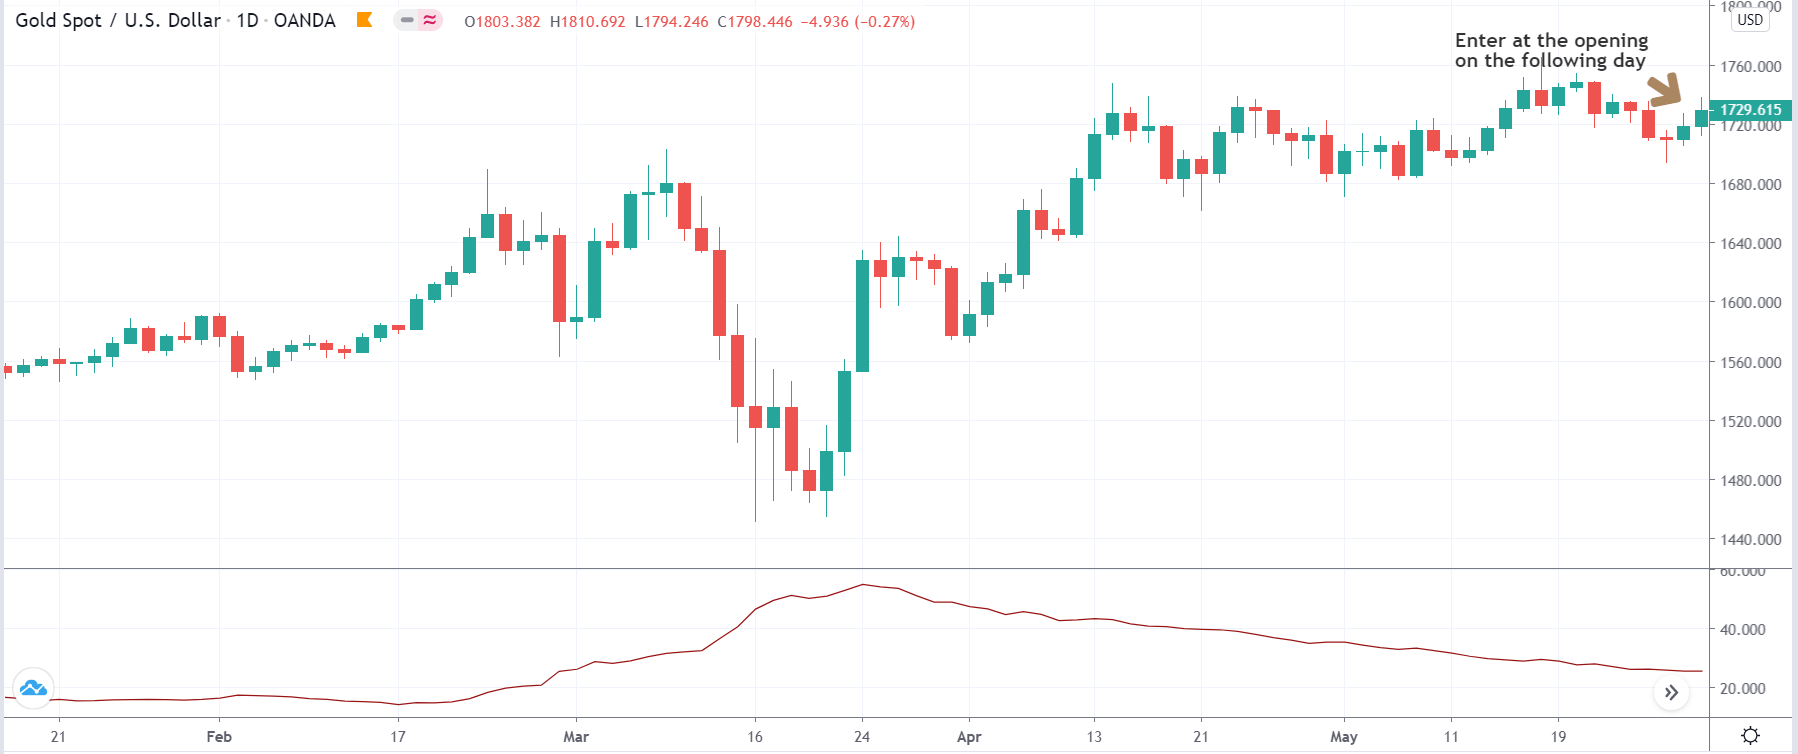
Next, we open the chart of XAU/USD, where we look for ‘long’ or ‘short’ entry. We enter for a ‘long’ in ‘gold’ on the following day of the dollar index’s break of support. Similarly, we enter for a ‘short’ in ‘gold’ on the following day of the break of resistance in the dollar index. The entry is taken right at the opening candle on the next day.
In our case, we are entering for a ‘long’ in ‘gold’ on the following day since the price had broken the dollar index’s support on the previous day.
Step 3
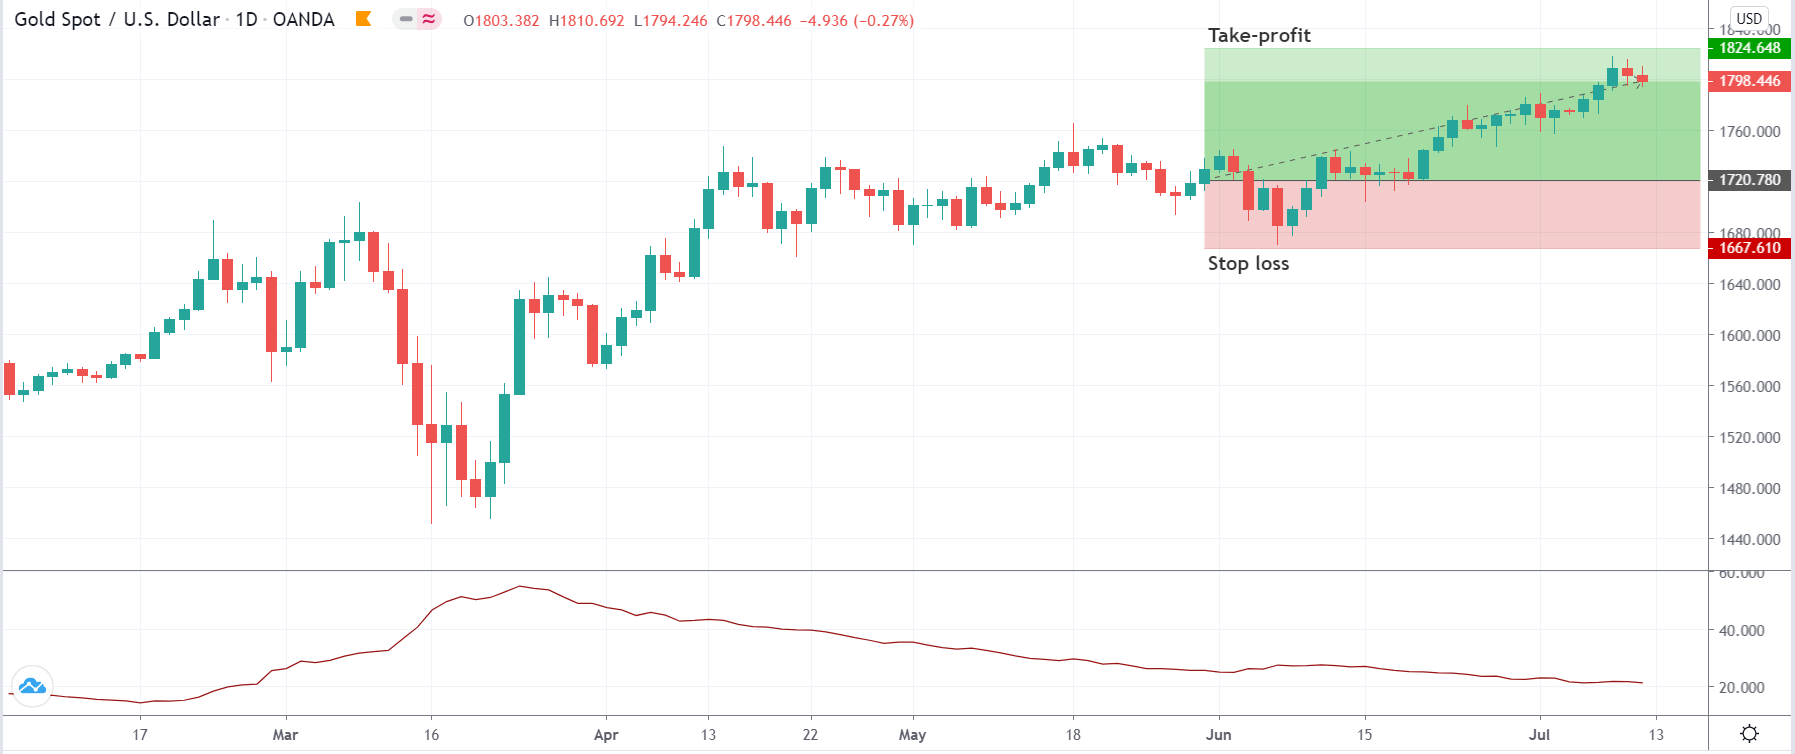
In this step, we determine the take-profit and stop-loss for the strategy. The stop loss is mathematically calculated where it is placed at the amount obtained after multiplying 2 to the value of the ATR indicator on the previous day. This means if the ATR value is 30, then stop loss will be set 60 points away from the current market price (CMP). The take-profit is extended up to a point where the trade results in a risk to reward ratio of 1:2. As mentioned earlier, since this is a long-term chart, the trade has the potential to give higher returns.
We can see in the below image that trade has almost reached our ‘take-profit’ where this is the current state of the market.
Strategy Roundup
Part II of the commodity correlation strategy seeks to take advantage of the negative correlation between the dollar index and gold prices. Using the dollar index as a reference, we are activating trades on the XAU/USD pair, which is nothing but the price of spot gold.
However, the interest rates announcement by the Federal Reserve will try to keep the inverse relationship between the U.S. dollar and Gold. This strategy is ideal for traders around the world who do not have time to watch the markets on a daily basis. The strategy can also be used to look for investment opportunities in Gold.


