Categories
Forex Course

199. Effects Of Gold On AUD/USD & USD/CHF Currency Pairs

Introduction

Gold is among the most traded commodities globally due to the good intrinsic value of this asset. Considering that Gold is less impacted by uncertain conditions, its prices rise when other economies perform badly and fall when there is an economic boom.

Gold impacts AUD/USD and USD/CHF in opposite manners. Price fluctuations in Gold primarily impact three major currencies that include AUD, USD, and CHF. Let’s discuss how Gold affects AUD/USD and USD/CHF.

The Effect of Gold in AUD/USD

When the price of gold rises, the AUD/USD will move upwards. These two aspects share a positive correlation; most of the time, they move together. An increase in the U.S. dollar generally contributes to the gold prices to fall and vice versa. The price of Gold perfectly depicts the economic health of the country.

During an economic crisis in the country, investors purchase Gold as protection from inflation or an economic crisis. But the inner value of the Gold does not change whether or not there is a crisis. Furthermore, gold value is displayed in the dollar, meaning every gold transaction, you spend/receive a dollar.

Australia’s Economy and its Impact on Gold Prices

AUD and Gold share a positive relationship and are inversely related to the USD. If the gold price rises, the Australian exports will increase, resulting in the expansion of the economy and foreign investment. When the gold price increases, the AUD/USD will move upwards because of the increasing demand for the AUD.

Impact on the USD/CHF

The Switzerland currency holds a positive correlation with Gold. This is because 25% of CHF is supported by the gold reserves. The refineries in Switzerland also process 70% unrefined gold every year. Additionally, Gold and CHF are inflation hedging during uncertain times.

Therefore, when the price of gold increases, the CHF value also appreciates or increases, vice-versa. Gold has a positive relationship with CHF and an inverse relationship with USD/CHF. When the price of gold rises, the value of USD/CHF falls down and vice-versa.

[wp_quiz id=”97481″]
Categories
Crypto Guides

Could Bitcoin Ever Beat Gold & Get The Safe-Haven Status?

Introduction

The traditional investors from the last few months are trying to understand the unprecedented financial system. The world is suffering from economic uncertainties, where 20% of the US workforce lost their jobs due to the COVID pandemic situation. At the same time, the precious metal “gold” hit an all-time high in this 2020 summer and stayed on a hike for a long time ever since.

The gold rush in the market might be due to various reasons – US dollar fall, US-China deteriorating relations, and general global economic crisis. Also, cryptocurrency investors advocated that Bitcoin perhaps can beat gold as the safe-haven, but researchers pointed out the fact that BTC is not so performing. As with the stock market fall, the market worth of Bitcoin was also down – which means that BTC can’t be classed as a safe-haven asset.

Bitcoin and Gold Market Risk

Bitcoin and gold have emerged as a leading investment unit to stabilize the economic downfall. In the finance industry, there is no guarantee for returns on investment, so there is always high risk. It’s not true that the value of gold will always rise because, in 2012-2015, it was dropped by $20,000 per ounce. Similarly, BTC value bounces up and down. Gold is not so volatile as Bitcoin currency. Gold is acting as a safe-haven from the last 100 years, and bitcoin is in the market from the last decade.

Can Bitcoin be called a Safe-Haven Asset?

Amid all economic crises, bitcoin price hardly reached $9,011, and that too, with a high risk. So, it can’t be considered as a safe-haven asset due to the following two reasons:

Reason 1

The Bitcoin volume in the market is so small to validate the concept of the safe-haven asset. A safe-haven in the traditional market is the asset whose price rises typically. When there is any risk, the investors simply shift their money from risky assets to a safe one to avoid the loss and to retain their investment value.

In the traditional market, Bitcoin’s share is less than $200 billion US dollar, which is not enough to perform as a safe-haven asset. It lacks federal regulations for transactions, and there is a high risk of scams in the Bitcoin cryptocurrency industry. That’s why the Securities and Exchange Commission also rejected the Bitcoin ETF proposal.

Reason 2

Bitcoin can’t be accessed or used in the environment, having no internet connection. In extreme places, you may be cut-off from the cryptocurrency exchange and Bitcoin traders due to limited internet connectivity. For example, due to any major strikes, most of the time, the government shut down the internet accessibility to slow down the protests and all.

In the meantime, due to no internet connection bitcoin wallet and exchange system get hampered instantly. Therefore, bitcoin can’t be used in the emergency situation, so it can’t be considered as an alternative currency or safe-haven asset.

Conclusion

Gold is a risky asset because of sharp falls, and bitcoin, too, has speculative risk factors. In the case of the safe-haven concept, gold is already declared as a safe-haven asset in the traditional market, while Bitcoin is battling for the title. A wide range of economic forces across the world doesn’t impact its value, as BTC trade executes independently. Despite the global recession and high unemployment, BTC is doing great in the market. But for now, we believe that this is not enough to qualify as a safe-haven asset.

Categories
Forex Basic Strategies

Forex Trading Using ‘Commodity Correlation Strategy – 2’

Introduction

A correlation coefficient is a number that describes the extent to which two instruments are correlated to each other. The number ranges between -1 and +1. This number moves from periods of positive correlation to periods of negative correlation. Located on one end of the scale, +1 is considered a state of the positive correlation between two instruments.

If the number is anywhere between 0 and +1, the two assets are said to move in the same direction, with a certain degree of positive correlation. On the other end of the scale, -1 is considered a state of negative correlation between two instruments. If the number is anywhere between 0 and -1, the two instruments are said to move in the opposite direction, with a certain degree of negative correlation.

The strategy we will be discussing today seeks to exploit the inverse correlation between the dollar index and Gold’s price. According to the World Gold Council, Gold tends to rise when the U.S. dollar falls. It is observed in the past that the correlation coefficient for Gold and the dollar index was between -0.6 and -0.8. This means if the dollar index is up, there is a 60% to 80% chance that gold prices would come down. In contrast, if the dollar index is down, there is a 60% to 80% chance that gold prices would come down. Let us see how the strategy works.

Time Frame

The commodity correlation strategy works well in the Daily (D) time frame. This implies that each candlestick on the chart represents the price movement of one day.

Indicators

We will be using the ATR indicator in the strategy. No other indicators are required for the strategy.

Currency Pairs

There are two charts we need to focus on in this strategy. The first one is the spot Gold or XAU/USD, and the second one is the chart of the dollar index.

Strategy Concept

The dollar index’s price action is used as a reference to initiate a trade on the XAU/USD. Technical levels of support and resistance on the dollar index chart are used to spot long and short trades on XAU/USD. If the price closes below the support on the dollar index chart, a long trade is initiated on the XAU/USD the following day. Similarly, if price closes above resistance on the dollar index chart, a short trade is initiated on the XAU/USD the following day. The risk-to-reward of this trade is 1:2. A bigger target can be achieved by allowing the trade to run its course.

The strategy is very simple for those who have a basic understanding of support and resistance. Another reason behind its popularity is that it does not involve the usage of complex indicators. The trade setups are not formed too often as we are using the daily time frame charts. Hence, a lot of patience is required for the application of the strategy.

Trade Setup

Here are the steps to implement the commodity correlation strategy. In both the instruments, we will be using the daily time frame chart only.

Step 1

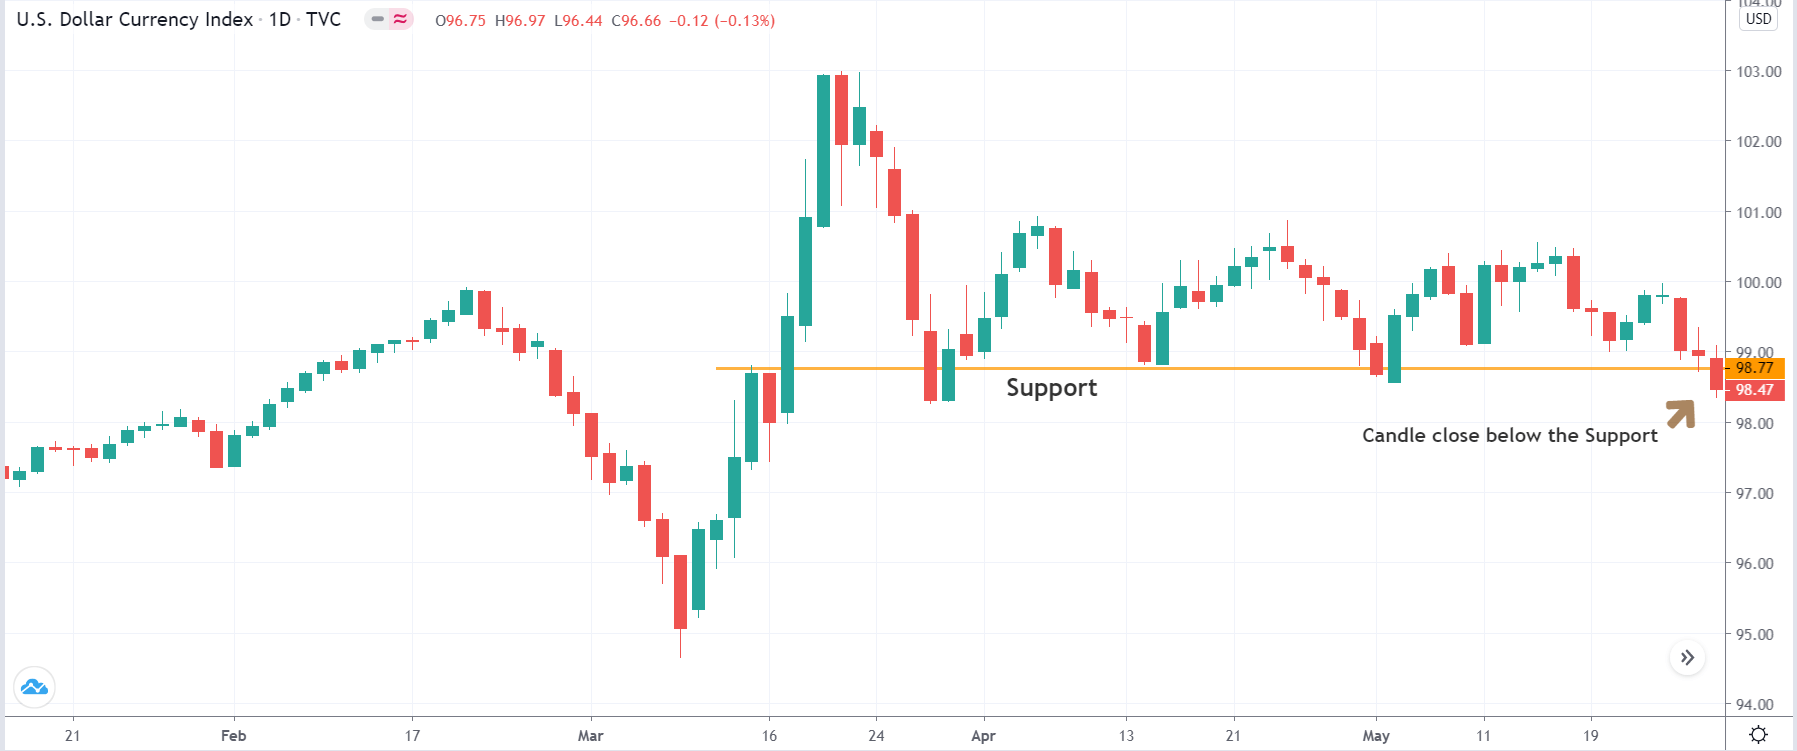
The first step of the strategy is to open the dollar index’s daily time frame and mark key areas of support and resistance on the chart. If one is looking for ‘long’ trades, the identification of the support area is crucial. And if one is looking for ‘short’ trades, identification of ‘resistance’ trade is crucial. After marking out of the lines, wait for the price to breakout or breakdown. In case of a breakout, we will look for ‘short’ trades in ‘gold,’ and in case of a breakdown, we will look for ‘long’ trades in ‘gold.’

We have taken an example of a ‘long’ trade where we will be executing the steps of the strategy. In the below image, one can see that the price has broken below the long term support.
Step 2

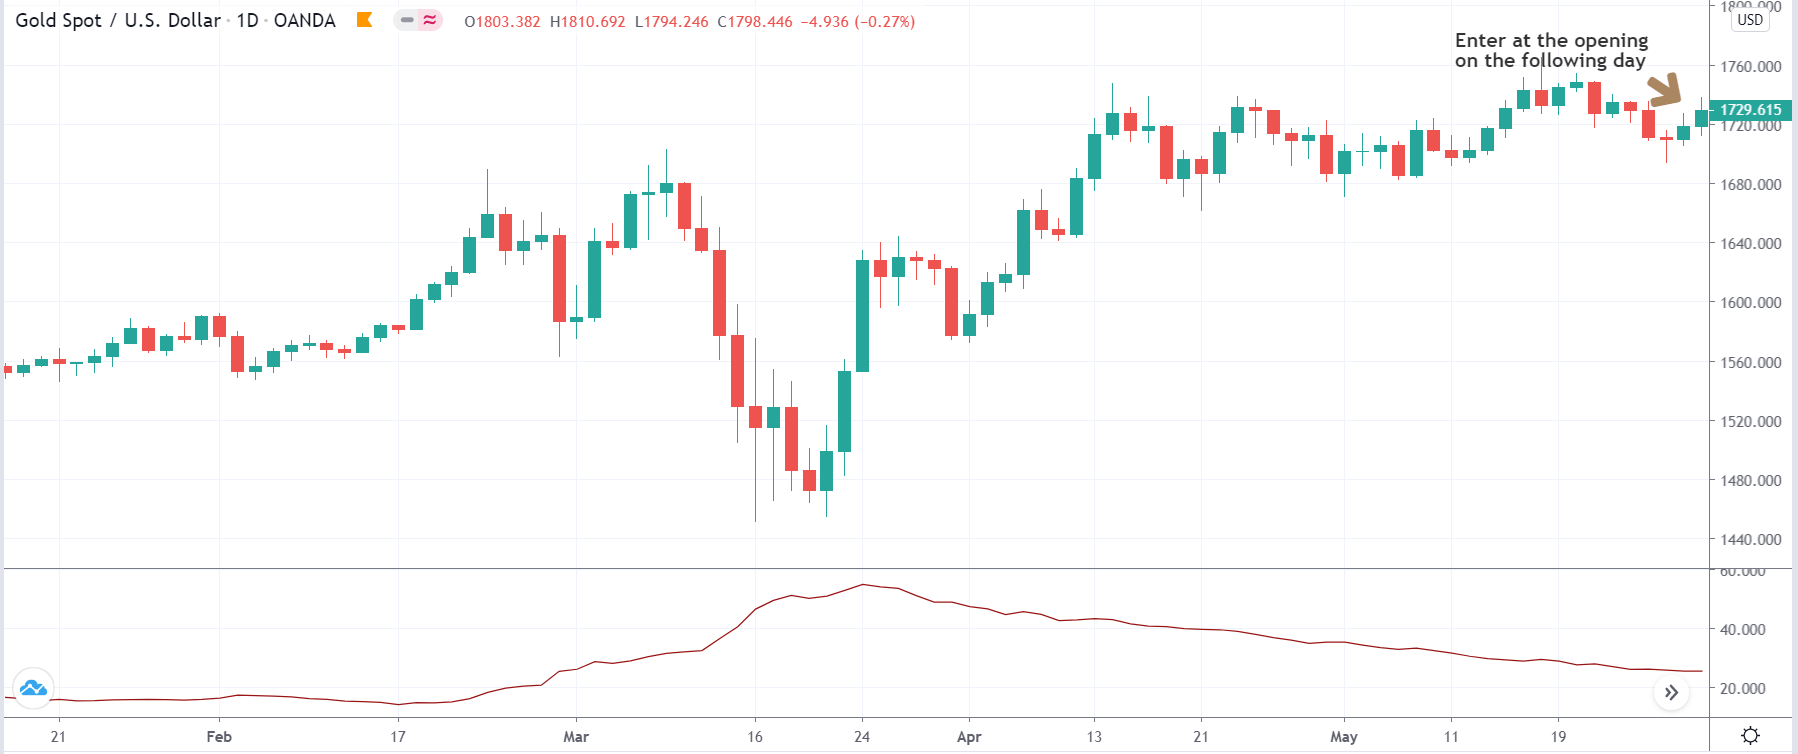
Next, we open the chart of XAU/USD, where we look for ‘long’ or ‘short’ entry. We enter for a ‘long’ in ‘gold’ on the following day of the dollar index’s break of support. Similarly, we enter for a ‘short’ in ‘gold’ on the following day of the break of resistance in the dollar index. The entry is taken right at the opening candle on the next day.

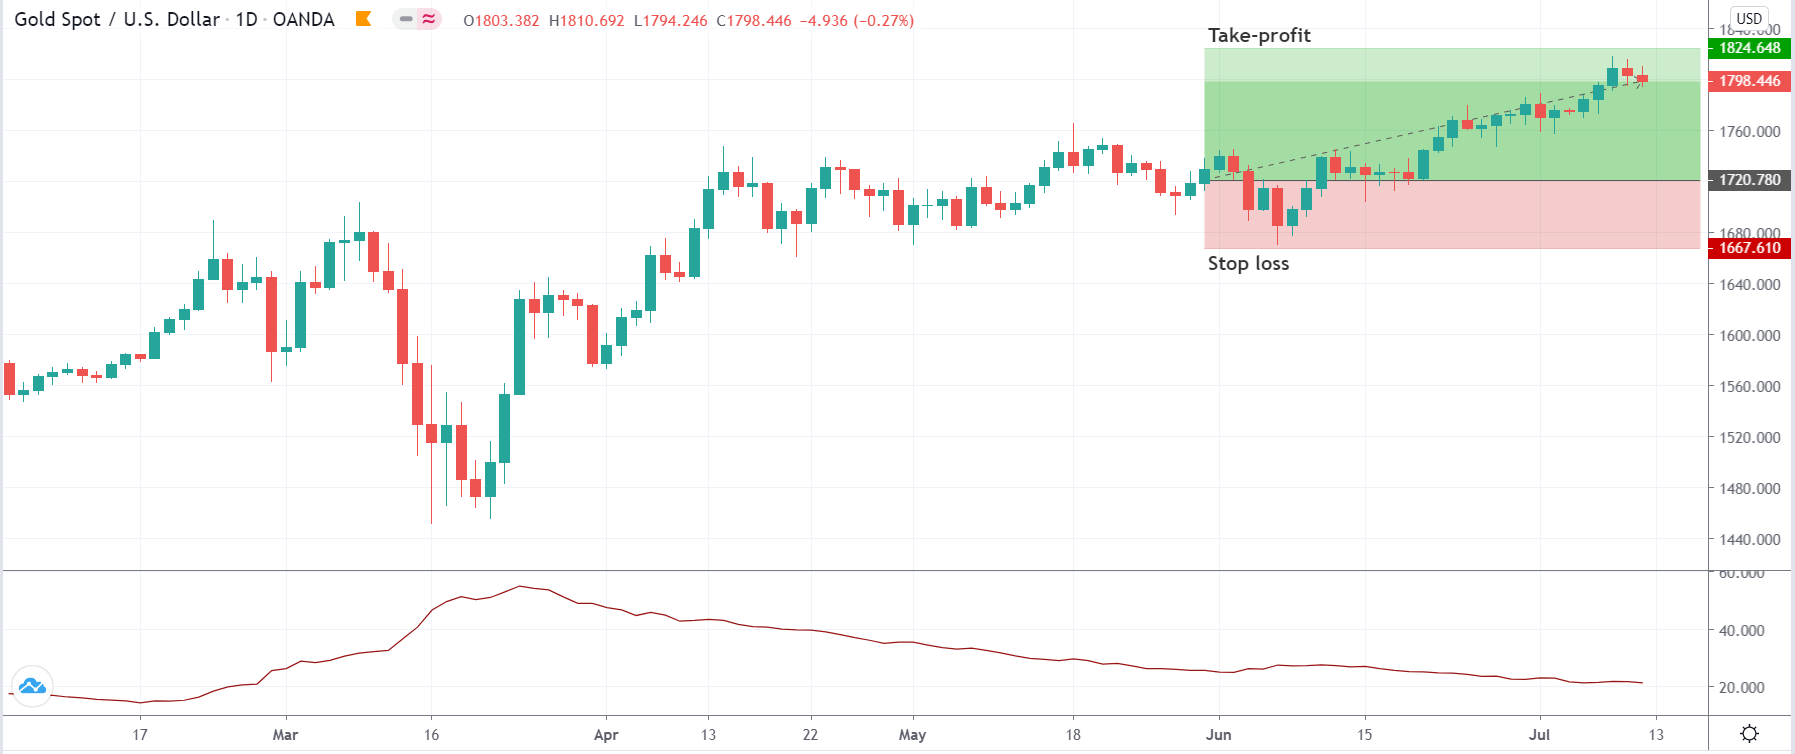
In our case, we are entering for a ‘long’ in ‘gold’ on the following day since the price had broken the dollar index’s support on the previous day.
Step 3

In this step, we determine the take-profit and stop-loss for the strategy. The stop loss is mathematically calculated where it is placed at the amount obtained after multiplying 2 to the value of the ATR indicator on the previous day. This means if the ATR value is 30, then stop loss will be set 60 points away from the current market price (CMP). The take-profit is extended up to a point where the trade results in a risk to reward ratio of 1:2. As mentioned earlier, since this is a long-term chart, the trade has the potential to give higher returns.

We can see in the below image that trade has almost reached our ‘take-profit’ where this is the current state of the market.
Strategy Roundup

Part II of the commodity correlation strategy seeks to take advantage of the negative correlation between the dollar index and gold prices. Using the dollar index as a reference, we are activating trades on the XAU/USD pair, which is nothing but the price of spot gold.

However, the interest rates announcement by the Federal Reserve will try to keep the inverse relationship between the U.S. dollar and Gold. This strategy is ideal for traders around the world who do not have time to watch the markets on a daily basis. The strategy can also be used to look for investment opportunities in Gold.

Categories
Forex Signals

Gold: Moving South Below the 50-Period SMA

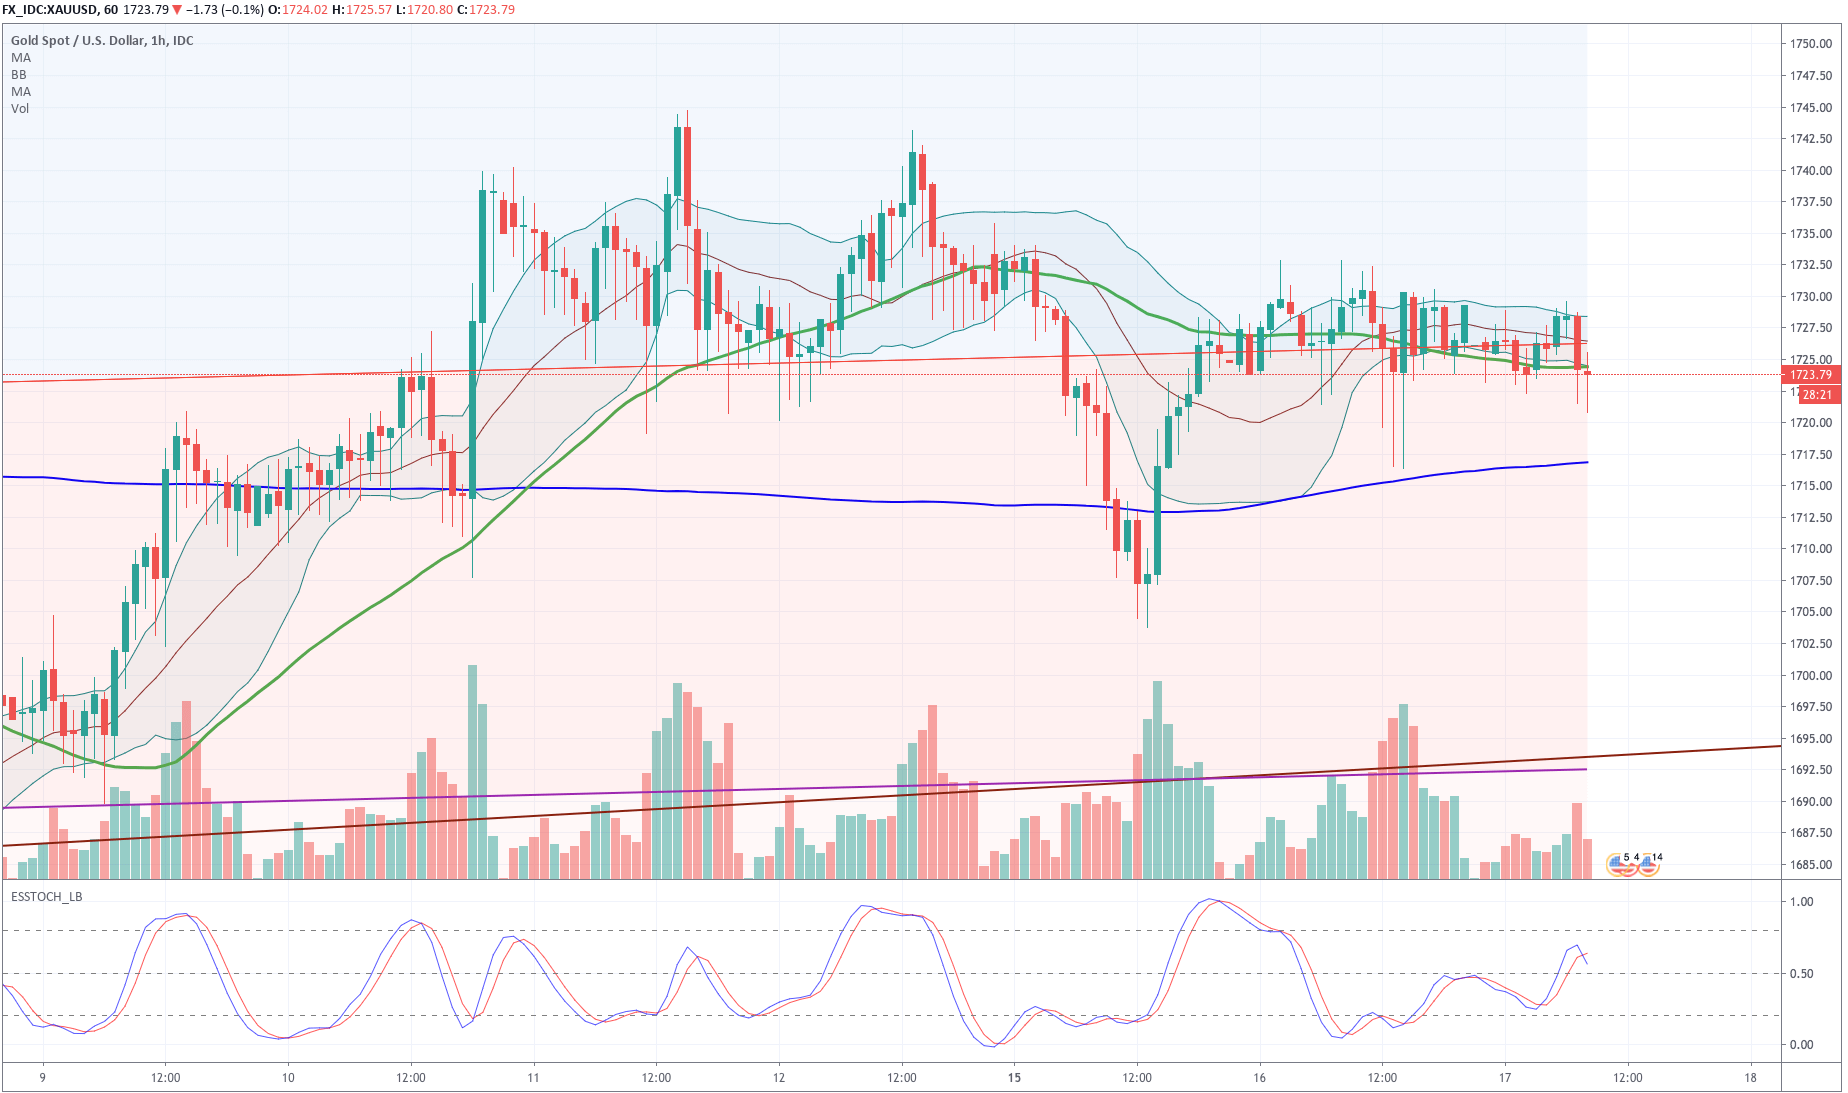
XAUUSD had a bounce off its lows that began on Jun 15 at 13:00 the bounce re3ached the $1730 level and began to move sideways, making lower lows. The last interaction made an evening star with a large bearish candlestick. We think this is a good short setup to scalp with a target at the current 200-hour SMA for a nice and fast reward. The R/r factor is just 1 but the odds of the pair going south are very high, which makes the trade appealing. We see also that the Stochastics made a crossover to near the middle of the range, suggesting an increased bearish momentum.

Trade Setup:

Entry: 1,724.64

Stop-loss: 1,734.64

Take profit: 1,714.64

Reward/Risk: 1

Risk: 100 pips which is $1000 per XAUUSD Lot, or $10 on a micro-lot. The reward is identical as the R/r =1


Categories
Forex Assets

Analyzing The ‘XAU/USD’ Financial Instrument & Determining The Trading Costs Involved

Introduction

Gold is a precious metal and one of the most valuable assets in the market. It is considered to be a safe haven instrument and a popular asset class for hedging positions during market uncertainty. XAU/USD is the abbreviation for the pair Gold Spot against the US Dollar. XAU is the ticker for Gold Spot. It can be traded against other fiat currencies like EUR and GBP as well.

Understanding XAU/USD

Gold Spot is an asset that is traded in troy ounces (Oz). The XAU/USD market price represents the value of the US Dollar for 1 ounce (Oz) of Gold. It is quoted as 1 XAU per X USD. For example, if the current market price of XAU/USD is 1730.50, it signifies that each ounce of Gold is worth the US $1730.5.

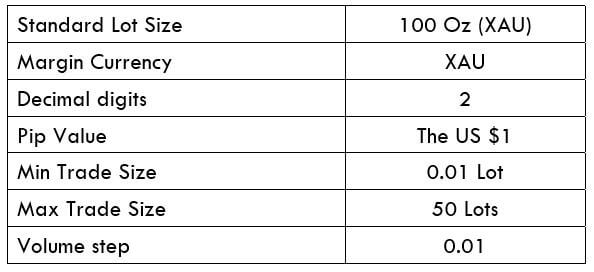
XAU/USD Specification

Spread

Spread is the difference between the bid price and the ask price. The spread usually varies based on the account type used for execution. The approximate spread on the gold spot on ECN account and STP account is as follows:

ECN: 100 | STP: 130

Fee

Typically, brokers do not charge any type of fee. But, on ECN accounts, there is some commission you must pay the broker for opening and closing a position. However, the fee is not significantly high.

Slippage

Due to the high market liquidity and slower broker’s execution speed, slippage occurs. It is the difference between the trader’s demanded price and the price at which the broker executed the trade. Slippage can occur both in favor and against the trader.

Trading Range in XAU/USD

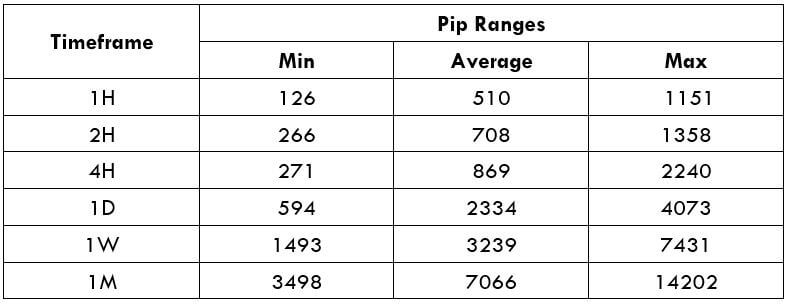
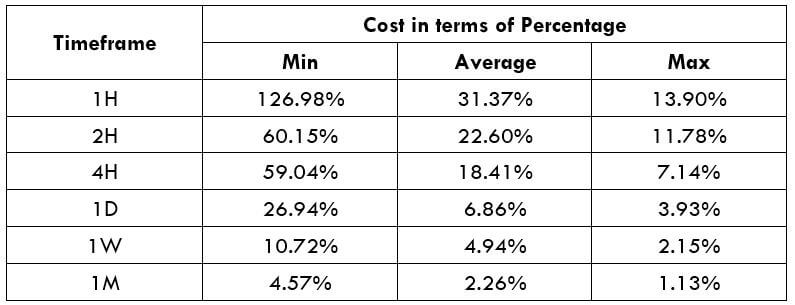
The trading range is a tabular representation of the volatility in the market for several different time frames. It gives the minimum, average, and maximum volatility in the pair for different time frames.

Procedure to assess Pip Ranges

  1. Add the ATR indicator to your chart
  2. Set the period to 1
  3. Add a 200-period SMA to this indicator
  4. Shrink the chart so you can assess a large time period
  5. Select your desired timeframe
  6. Measure the floor level and set this value as the min
  7. Measure the level of the 200-period SMA and set this as the average
  8. Measure the peak levels and set this as Max.

XAU/USD Cost as a Percent of the Trading Range

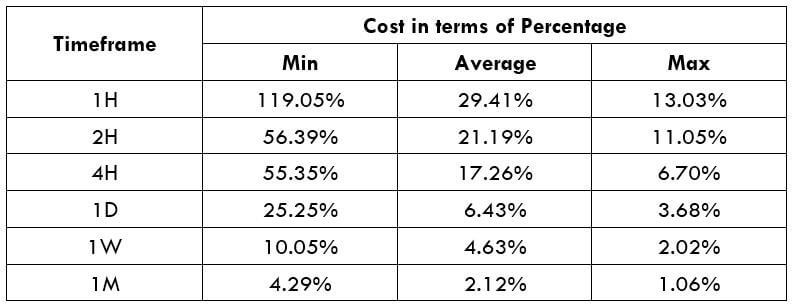
Cost as a percent of the trading range represents variation in the trade cost by considering the market’s time frame and volatility. Mathematically, it is the ratio of the volatility value and the total cost of the trade.

ECN Model Account

Spread = 100 | Slippage = 30 | Trading fee = 20

Total fee = Spread + Slippage + Trading fee

Total fee = 100 + 30 + 20 = 150 (pips)

STP Model Account

Spread = 130 | Slippage = 30 | Trading fee = 0

Total fee = Spread + Slippage + Trading fee

Total fee = 130 + 30 + 0 = 160 (pips)

The Ideal Timeframe to Trade XAU/USD

Gold is one of the oldest asset classes and one of the most reliable instruments as well. It is extensively traded in the market as most forex broker has XAU/USD available for trading. Its volatility and liquidity are no less than major currency pairs.

XAU/USD can be traded like any other foreign exchange pair. It, in fact, correlates with commodity currencies like AUD and NZD. Thus, traders use these two currencies in addition to USD, in order to analyze the pair. The same technical analysis applied to other markets can be used on the gold spot as well. However, the fundamentals do differ a little.

Coming to the costs, it technically remains the same for any time frame you trade. However, it relatively changes based on volatility and time frame. For example, a 1D trader who makes 2000 pips P/L on an average pays the same a 1H trader who makes 500 pips P/L on a trade. This is the reason the percentage values are higher in the 1H time frame than the 1D time frame.

Irrespective of the time frame you trade, you need to make sure that the market’s current volatility is above the average volatility. If you end trading when the volatility is at the minimum values, then you will have to pay the same costs for a trade that could not reach the target in your expected time.

Categories
Forex Signals

Gold bounces off the Linear Regression line and heads up to meet the top of the channel

The idea

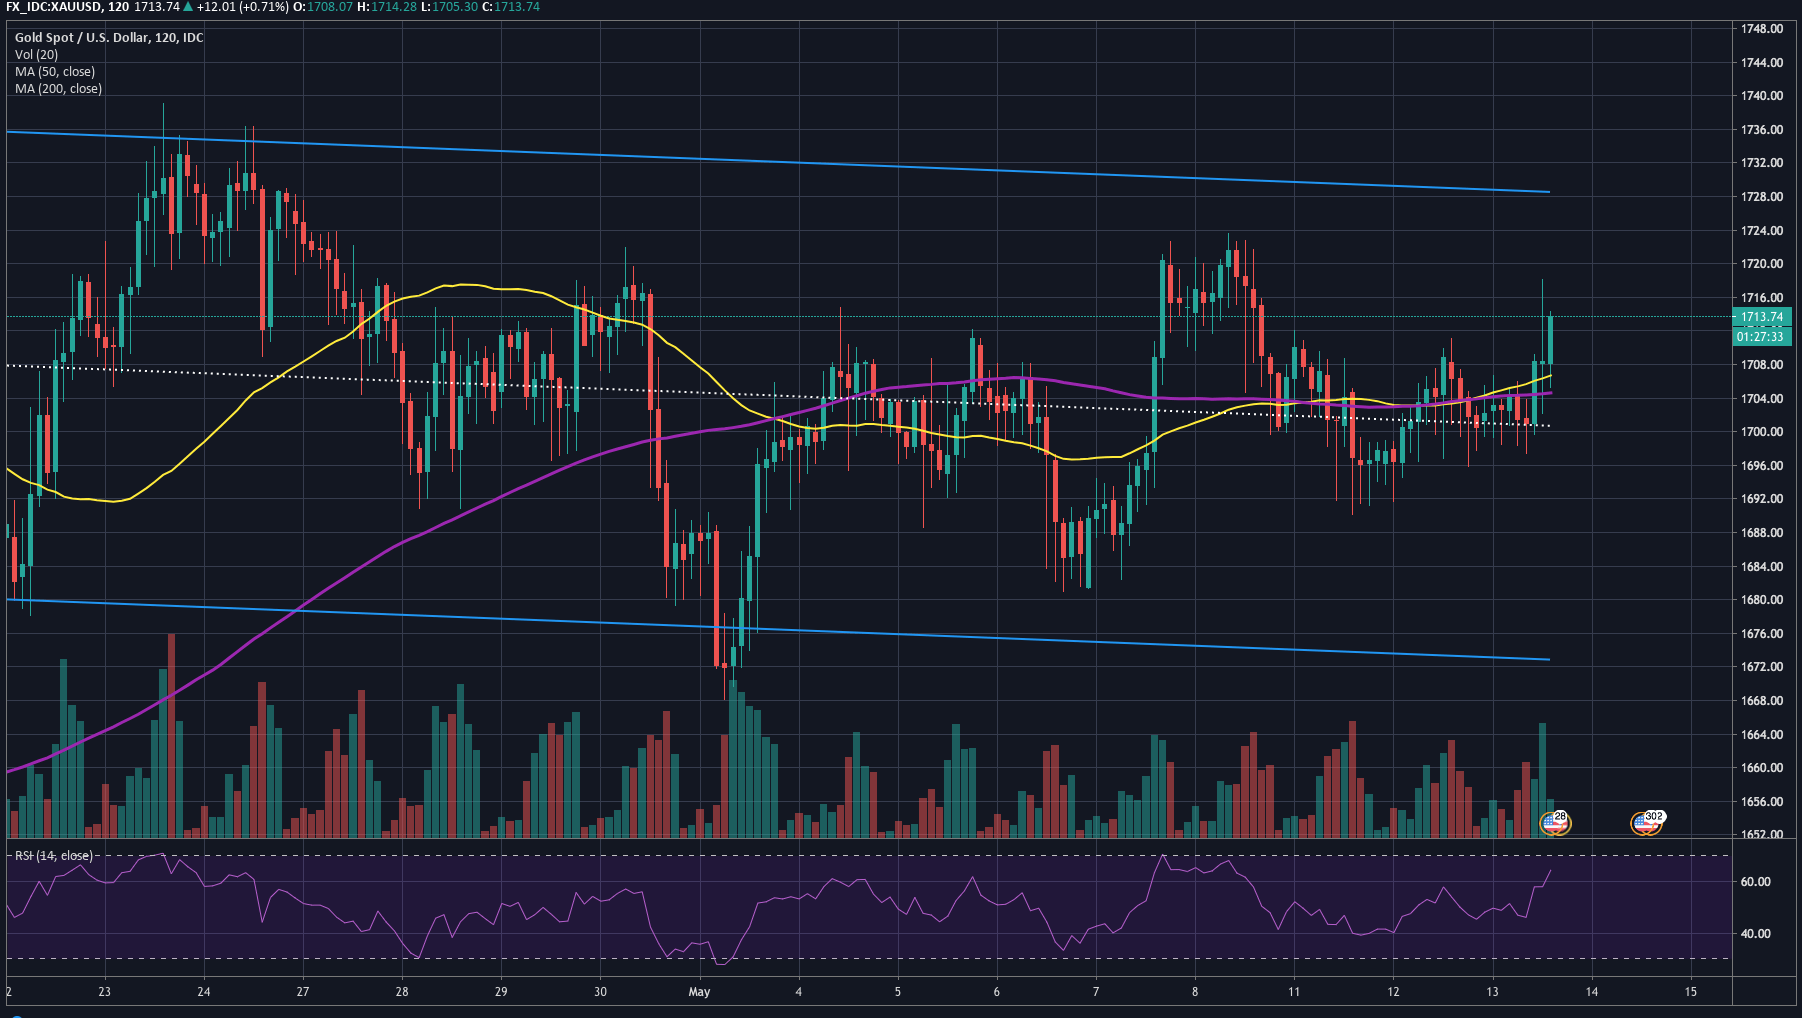
Gold has been having a corrective movement lately. The price has created a slightly descending channel. If we draw a linear regression channel we can easily see the consensus of price, represented by the mean line, which is the average line of the price set for the range, and the edges of the channels are set at ±2 Sigmas (standard deviation) of the centerline.

On the 2H chart we see that, after the price did a higher low below the centerline, it went up, and consolidated for a while above that line. Today it made an engulfing figure that broke through the recent range and is heading up.

A long position was entered at 1,711.12 with a stop-loss at $1,699.12 and a take profit of 1,725.12, which gives a reward to risk ratio of 1.17, which is less than the usual, but also the target can be reached easier, as it is not set at the top of the channel but at the recent high of the price, made on May 08.

Main levels:

  • Long entry: 1,711.12
  • Stop-Loss: 1,699.12
  • Take-profit: 1,725.12

Reward/Risk Ratio: 1.17

Dollar Reward and Risk

  • Risk:$1200 per lot, $120 per mini lot, 12 per micro lot
  • Reward: 1400 per lot, $140 per mini lot, $12 per micro lot.


Categories
Forex Signals

Gold Breaking Below 50 EMA and Support – Brace for Selling!

The safe-haven-metal prices flashing green and take bids around the $1,710 while representing 0.50% gains on the day mainly due to fresh allegations on China by the United States helping to increase the safe-have demand in the market. The Sino-US relationship was eased after both parties agreed to improve the atmosphere for fulfilling the phase-one deal’s promises. This came after President Donald Trump threatened new tariffs on Chinese goods in case of not buying $200 worth U.S. farm products by China.

The Consumer Credit for the month of March was released from the Federal Reserve of the U.S., which showed a decline by -12.0B against the expectations of positive 14.9B. This weighed on the U.S. dollar and limited the downfall of gold prices on Friday. 

Furthermore, the latest economic data from the United States fueled expectations that the Federal Reserve will stimulate more in the next meeting, and markets started to price in for a negative interest rate environment. On Saturday, President Donald Trump said that the United States would purchase $3B worth of dairy & farm products in order to help the struggling U.S. farmers. He stated that the government’s purchase would be a part of “Farmers to Family Food Box.” 

The demand for agricultural products was decreased due to the lockdown caused by the coronavirus pandemic, which started in March, and it has disrupted the supply chains across the nations. This has caused some U.S. farmers even to destroy their products, which they can’t store.  Donald Trump also said with no evidence that coronavirus pandemic will go away without a vaccine. He spared the specifics, said that other viruses also disappeared, and the same would happen with this COVID-19. He added that viruses die too like everything else, and he was hopeful that this virus would also go away after some time.


Daily Support and Resistance  

Support Resistance

1,699.50 1,731.90

1,685.10 1,749.90

1,667.10 1,764.30

Pivot Point: 1,717.50


XAU/USD – Daily Trade Sentiment

Gold is trading with a bearish bias, holding mostly below 1,710 resistance level. Gold is trying to cross below the 50 EMA support area, which can lead to gold prices further lower towards 1,694 level. Alongside, the RSI is also holding below 50, suggesting odds of selling bias in gold. 

On the upper side, gold’s resistance is expected to be found near 1,720 and 1,737, whereas the support continues to stay around 1,694 regions. In case of a downward breakout, gold prices may slip towards 1,671 level.

  • Entry Price: Sell at 1700.8    
  • Take Profit .1688.8    
  • Stop Loss 1708.3    
  • Risk/Reward 1.60

Profit & Loss Per Standard Lot = -$750/ +$1200

Profit & Loss Per Micro Lot = -$75/ +$120

Categories
Forex Signals

Bullish Bias in Gold Continues to Dominate – Who’s up for a bullish Signal?

On Tuesday, the precious metal gold continues to trade higher around 1,730 area in the wake of increased safe-haven appeal driven by COVID 19. Furthermore, the early-day upbeat remarks from the U.S. Task Force Briefings, news from the U.K. also recommend the coronavirus (COVID-19) is near to its expected high’s. The same could negatively influence the gold’s safe-haven appeal that has lately fired the bullion to the highest since November 2012.

The U.S. President Donald Trump is showing a willingness to support the USA fight against the coronavirus (COVID-19), which eventually seems to help the risk-tone. This time, the Fed will elevate about $2.3 trillion to promote small and medium-sized companies, districts and workers harmed by the coronavirus break.

Apart from this, the recent recovery in the Asian equity and continued rise in the U.S. 10-year Treasury yields, which is currently near 0.773%, provided support to the oil prices recover. The better-than-expected Chinese trade data also give confidence to the oil buyers.


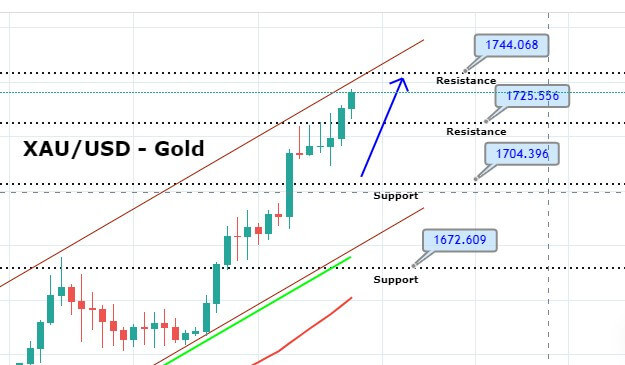
Technically, the XAU/USD has the potential to go long, which is why we have opened a buying signal at 1728.27 with a stop loss of around 1718.27 and take a profit of 1738.27. The bullish channel likely keeps the gold prices higher, while the RSI and MACD are suggesting a continuation of a bullish bias in the gold. On the higher side, gold has the potential to go after 1,743 level today.

Buying Price: 1728.27
Take Profit 1738.27
Stop Loss 1718.27
Risk/Reward 1
Profit & Loss Per Standard Lot = -$1000/ +$1000
Profit & Loss Per Micro Lot = -$100/ +$100

Categories
Forex Market Analysis

Gold Choppy Session Continues – Ascending Triangle Supports! 

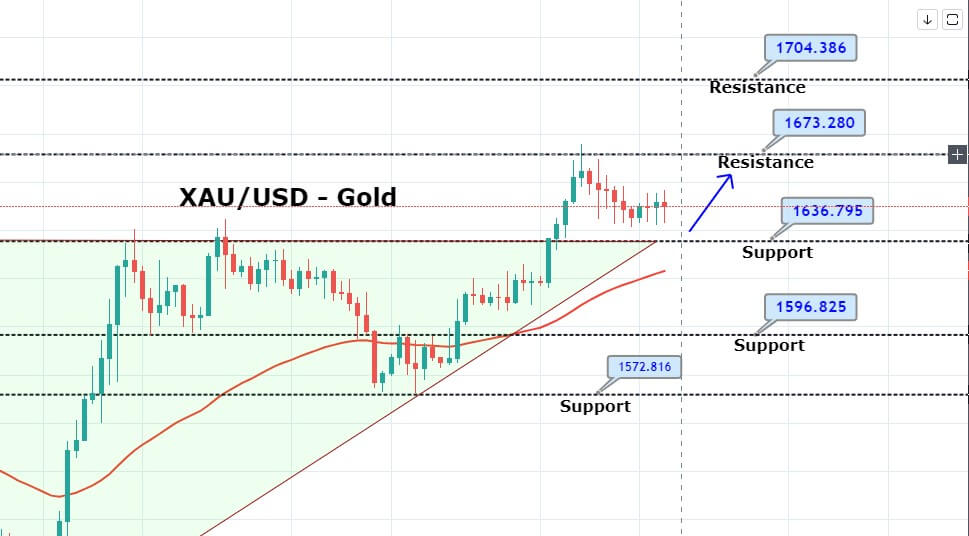
On Wednesday, gold is keeping bullish momentum over rising coronavirus death toll hammered risk sentiment. At the same time, the trader awaits the announcement of the U.S. Federal Reserve’s policy conference minutes for hints on additional stimulus measures. Gold edged 0.1% to $1,650.40 during the U.S. session. 

One of the reasons behind gold’s bullish bias is ongoing tensions around the globe. The UK PM Boris Johnson is in ICU, which is driving uncertainty from the British markets. Moreover, Japan’s Prime Minister Abe has announced a state of emergency in Tokyo and 6-other provinces and plans to control the economic fallout of COVID-19 as well as a huge fiscal stimulus package. The package, worth ¥16.5trn, equates to 20% of GDP. 

Meantime, European leaders are discussing policy tool-kit, which has probably worth up to €540bn (3.8% of GDP). However, it will be interesting to get a broad agreement between European leaders on the debt mutualization plan since the very nation is introducing stimulus plans, which makes their currencies weaker. Consequently, traders switch to precious metal gold. 

Daily Support and Resistance

Support Resistance

1,628.08 1,687.6

1,592.25 1,711.3

1,532.73 1,770.83

Pivot Point 1,651.78

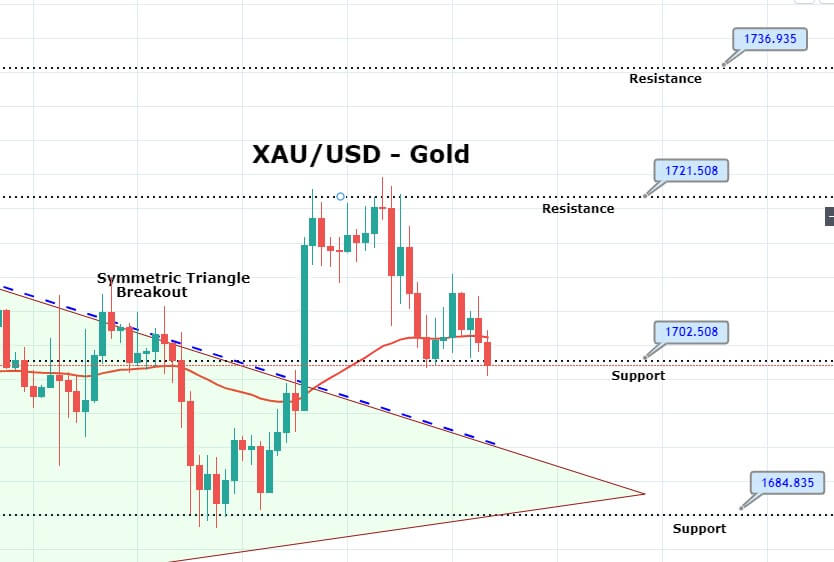
Gold prices are trading with a bullish bias around 1,649 level, having supported over previously violated ascending triangle resistance become support level of 1,636. We can see a series of neutral candles over 1,636 level, which is suggesting indecision among traders. However, the upward trendline and 50 periods EMA on the 4 hour time is demonstrating a chance of bullish trend continuation in the market. 

On the higher side, gold may find immediate resistance around 1,655, and bullish breakout of this may offer buying until 1,671. While support continues to hold around 1,636. Let’s consider taking bullish trades over 1,640 levels to target 1,662 and 1,671. Good luck!

Categories
Forex Market Analysis

XAUUSD short idea, May 7th, 2018

XAUUSD

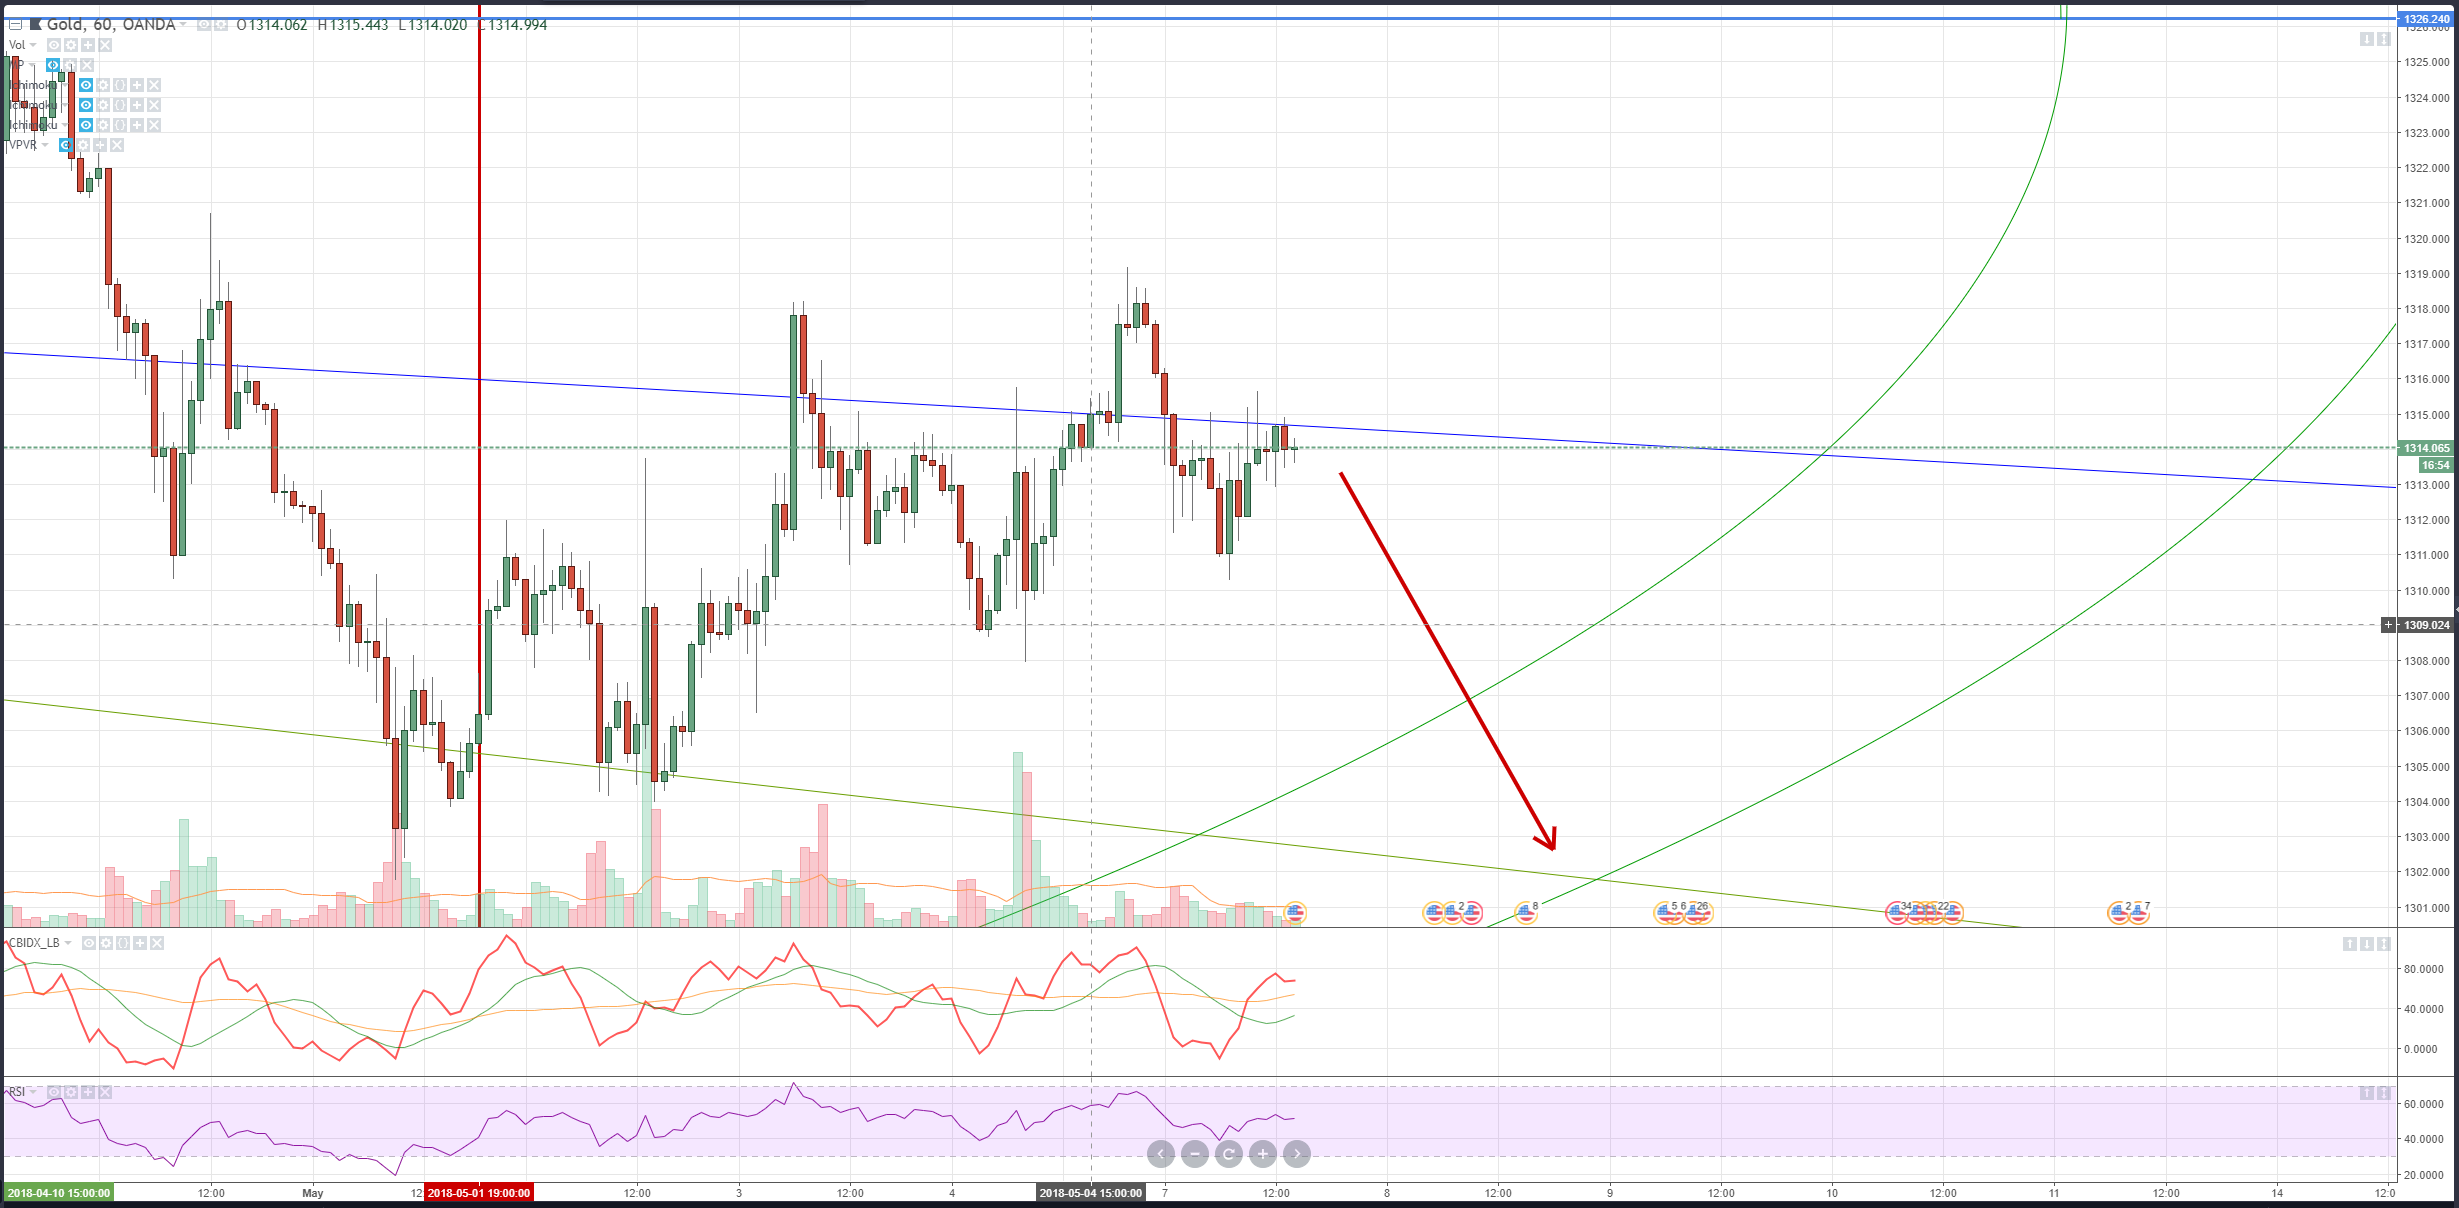
XAUUSD is currently resting right against an important angle that is acting as resistance (the 5×1 angle). Considering the square that we are trading in, we are trading significantly above the current 45-degree angle. A violent snap back (fast selloff lower) should be expected. Additionally, we are trading in a very textbook example of a bear flag. The continued strength of the dollar should continue to drive gold lower here and another leg down is certainly a strong probability. There is little risk associated with this trade and significant possible profit.

Categories
Forex Market Analysis

XAUUSD long term short signal

Monthly and Weekly charts essential for determining an intraday bias. In order to identify a bias, a thorough analysis must be done using as little analysis as possible. Simple is better when it comes to a long-term forecast (forecasting over a series of weeks or months).

Monthly Chart

This is an extremely bearish candlestick on the daily chart, a firm inverted hammer with excellent selling conditions on the Composite Index.

Weekly Chart

The weekly chart also shows some significant bearish sentiment ahead. Price is very near a pivot in time (red vertical line). More importantly, the 1326.24 value area is a natural middle harmonic, and XAUUSD has failed to trade above it on the current weekly chart. Additionally, the wedge that XAUUSD has been trading is becoming weak: the current price level in relation to both the Composite Index and the Composite Index and the RSI indicates a very high probability of that bottom wedge line being breached.

Near-term target: 1282.68 value area.

Long-term target of a return to the 1239.13 value area.

©Forex.Academy