Litecoin (LTC)
Market Cap $8.23B
Circulating Supply: 56.34M LTC
Max Supply: 84M LTC
Volume (24h) $345.98M
LTC/USD = $144.06
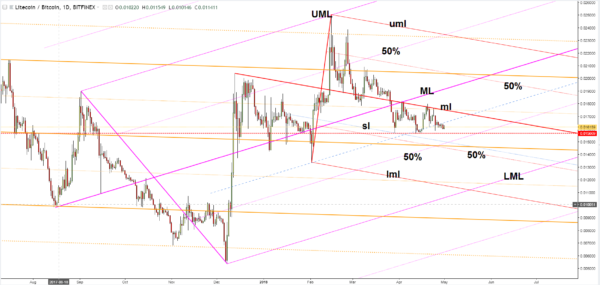
The LTC/BTC moves sideways on the short term signaling an oversold. It seems like that the corrective phase could be completed after the failure to approach and retest a dynamic support. It is trading at 0.016167 level, right above the 0.015669 crucial support level.
It remains to see if this will be an accumulation or a distribution movement. Price is narrowing, but I really hope that we’ll have a fresh trading opportunity soon.
The LTC/BTC could drop a little to test and retest the 0.015669 static support after another failure to close above the median line (ml) of the ascending pitchfork. Price has failed to drop towards the 50% Fibonacci line signaling that the bears could be exhausted. I’ve drawn a sliding parallel line (sl), the rate has failed to approach and retest this level so we could think of another bullish movement.
However, the rate could continue to move sideways in the upcoming days before will decide what will do next. We have a crucial support at the 0.015669, at the sliding line (sl) and at the 50% Fibonacci line of the ascending pitchfork. The rate could bounce back as long as it stays above these downside obstacles.
Personally, I believe that a valid breakout above the median line (ml) of the descending pitchfork it will signal another significant leg higher.
Conclusion
You can go long after a valid breakout above the median line (ml). You can place targets at the median line (ML) and higher at the upper median line (uml). Only a breakout above the second target will confirm an increase above the 0.025004 swing high.
A potential increase will be invalidated by a valid breakdown below the 50% line of the ascending pitchfork and below the sliding line (sl) of the descending pitchfork.


