
Most of the cryptocurrency sector ended up in the green as Bitcoin pushed towards the upside and created a brand new all-time high. Bitcoin is currently trading for $34,801, representing an increase of 12.63% compared to yesterday’s value. Meanwhile, Ethereum’s price has increased by 9.47% on the day, while LTC gained 6.53% of its value.


Daily Crypto Sector Heat Map
Foglory Coin gained 3809.54% in the past 24 hours, making it the most prominent daily crypto gainer by far. It is followed by COVER Protocol’s 2102.06% and Birdchain’s 683.22% gain. On the other hand, MINDOL lost 74.94%, making it the most prominent daily loser. It is followed by Scanetchain loss of 71.12% and XLMDOWN’s loss of 55.53%.
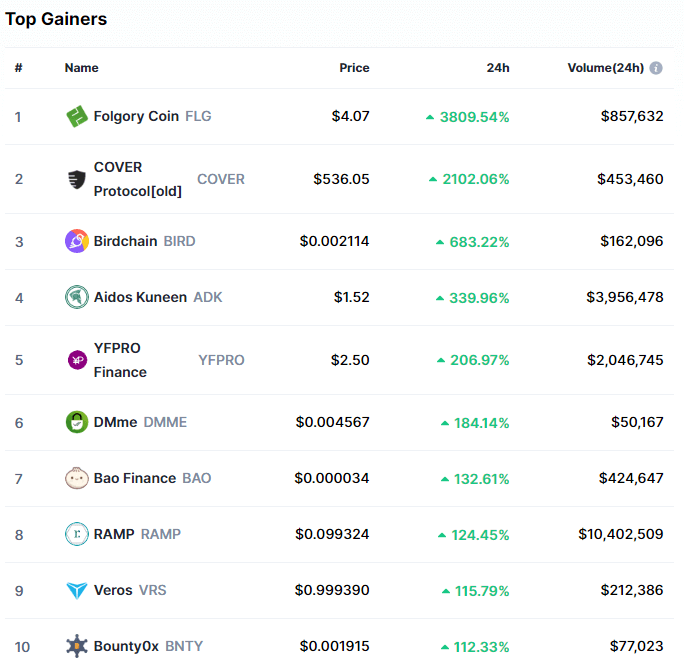
Top 10 24-hour Performers (Click to enlarge)
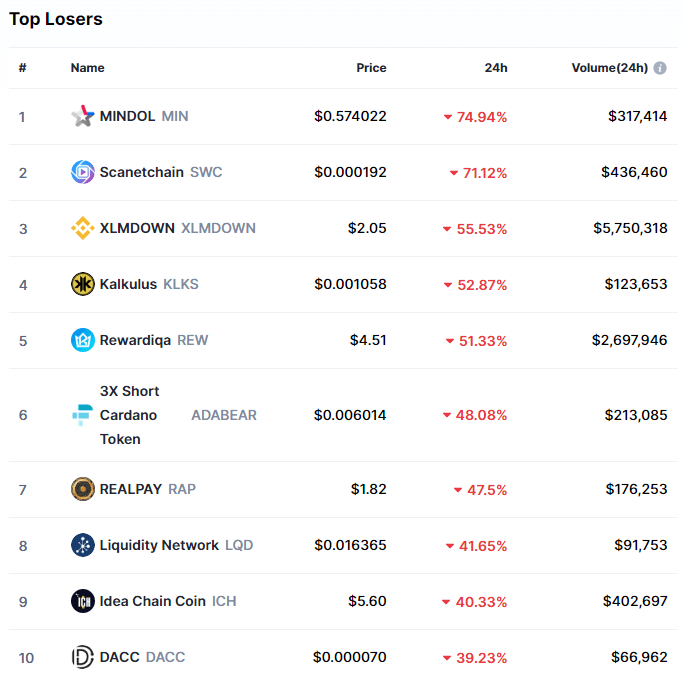
Bottom 10 24-hour Performers (Click to enlarge)
Bitcoin’s market dominance has moved up slightly since our last report, with its value currently being 69.3%. This value represents a 1.1% difference to the upside than the value it had when we last reported.

Daily Crypto Market Cap Chart
The cryptocurrency sector capitalization has increased over 100 billion since we last reported, with its current value being $967.49 billion. This represents a $122.12 billion decrease when compared to our previous report.
_______________________________________________________________________
What happened in the past 24 hours?
_______________________________________________________________________
- Open interest on Ethereum derivatives hit an all-time high on Sunday (The Block)
- The UK’s ban on crypto derivatives is set to go into effect on Wednesday (The Block)
- The number of XRP ‘whales’ has fallen since the SEC filed suit against Ripple (The Block)
- One of Ripple’s Top Investors Has Sued the Company (Cryptobriefing)
- Coindesk Buys Bitcoin Analytics Firm TradeBlock, Adding Index and Pricing Data (Cryptobriefing)
- Ethereum 2.0 staking service launches token with $1.4b fully diluted valuation (Cryptoslate)
- JPMorgan Predicts Bitcoin Price Could Rise Over $146,000 in Long Term (Coindesk)
- XRP sinks below LTC again after new lawsuit from major investor (Cointelegraph)
- Grayscale’s ETHE shares tumble 50% as Ether skyrockets (Cointelegraph)
- XLM price gains 30% in a day as positive sentiment shifts from XRP to Stellar (Cointelegraph)
_______________________________________________________________________
Technical analysis
_______________________________________________________________________
Bitcoin
Bitcoin has had another amazing bull run, with its price pushing from just below $30,000 all the way up to $35,879, setting a brand new all-time high. However, this is where the price hit a wall, and Bitcoin started retracing. The largest cryptocurrency by market cap is now trading right below the previous all-time high of $34,800 and is seemingly going further down.
With the volume being as high as it is, the most does not seem like it’s done yet. Traders should pay attention to how the price reacts to certain levels.
BTC/USD 4-hour chart
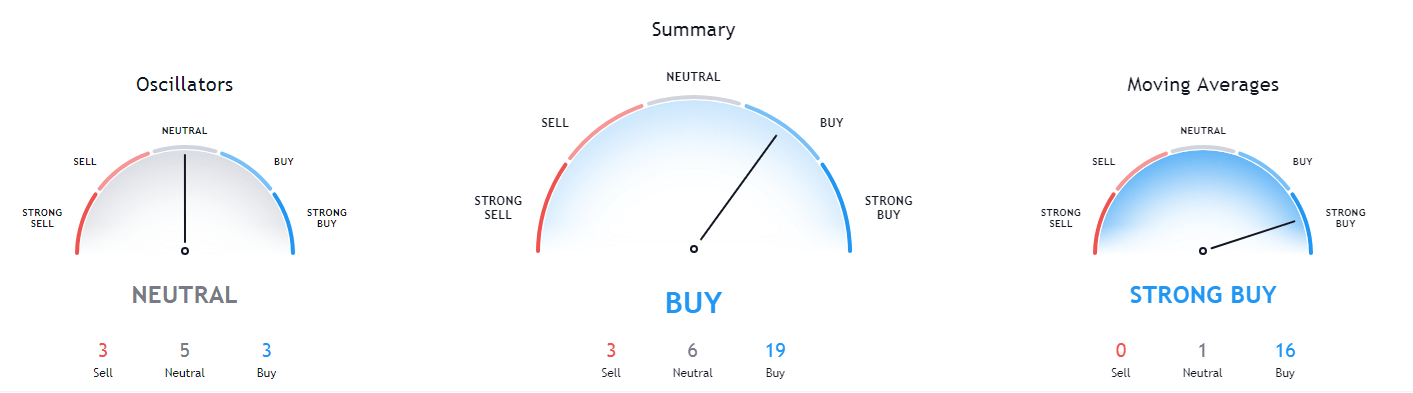
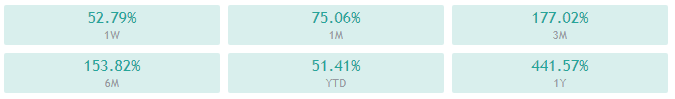
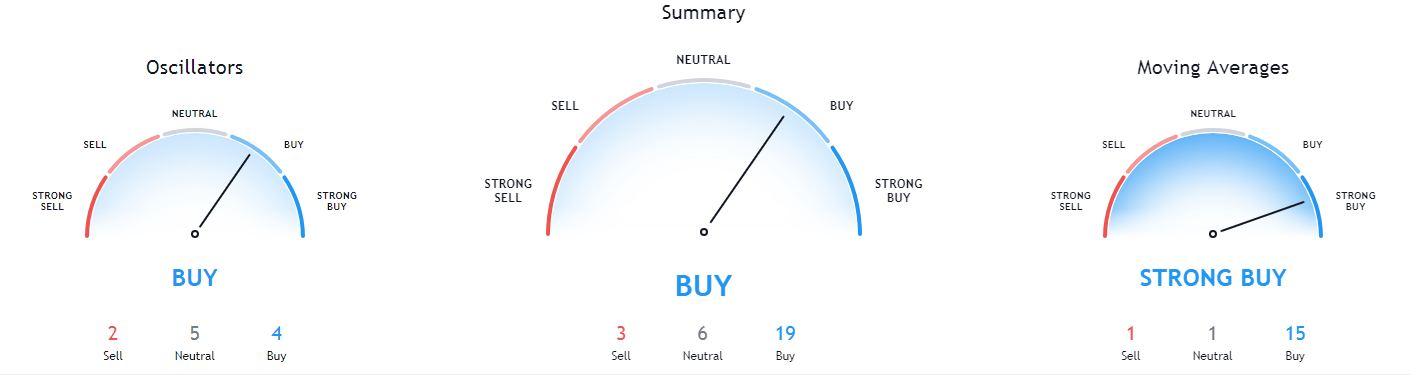
Bitcoin’s technicals show a strong tilt towards the buy-side with some neutral characteristics, with only the 4-hour time-frame showing full bullish tilt.
BTC/USD 1-day Technicals
Technical factors (4-hour Chart):
- Price is slightly above both its 50-period EMA and its 21-period EMA
- Price is near its top Bollinger band
- RSI is near the overbought territory (65.11)
- Volume is above average
Key levels to the upside Key levels to the downside
1: $34,800 1: $30,807
2: $35,000 2: $28,337
3: $35,890 3: $26,340
Ethereum
Ethereum also moved to the upside, with its price slowly but surely going from $975 all the way up to $1,139 before retracing slightly. Its move, however, didn’t seem as forced as Bitcoin’s.
While the overall sentiment around Ethereum is bullish, the fact that it hit nearly the same high three times without passing it could indicate a possible short-term top and a retracement.
Traders should pay great attention to the area around above $1,125 and how ETH reacts to it.
ETH/USD 1-hour Chart
Ethereum’s technicals on the daily and weekly time-frames show an overall bullish tilt with no hints of neutrality coming from oscillators. On the other hand, the monthly and 4-hour time-frames show some signs of neutrality or even bearishness.
ETH/USD 1-day Technicals
Technical Factors (4-hour Chart):
- Price is above both its 50-period and its 21-period EMA
- Price is between its middle and top Bollinger band
- RSI is in the overbought area (72.01)
- Volume is significantly above-average
Key levels to the upside Key levels to the downside
1: $1,047 1: $1,009
2: $1,080 2: $960
3: $1,169 3: $932
Litecoin
Litecoin moved in a much more narrow range than Bitcoin and Ethereum. Its price slowly moved towards the upside (with one hiccup that brought its price from $163 to $155) and reached as high as $165. However, this move didn’t create new highs or approach the recent ones either.
At the moment, Litecoin looks like a cryptocurrency that mirrors Bitcoin’s moves, but with less volatility. While this brings a bit of perceived safety, the truth is that the profit potential is also greatly diminished.
LTC/USD 1-hour Chart
Litecoin’s technicals on the 4-hour and monthly time-frame are completely bullish, while its daily and weekly overviews show some oscillators having bearish values.

LTC/USD 1-day Technicals
Technical factors (4-hour Chart):
- Its price is currently above both its 50-period EMA and its 21-period EMA
- Price between its middle and top Bollinger band
- RSI is nearing the overbought area (65.96)
- Volume is above-average but descending
Key levels to the upside Key levels to the downside
1: $163.7 1: $155.25
2: $174.5 2: $149.3
3: $195.5 3: $143.5
Related posts
 Daily Crypto Review, Jan 5 – Ethereum Outpaces the Market; Most Cryptos in the Red
 Daily Crypto Review, Jan 15 – Bitcoin Retraces After Hitting $40k; Ethereum Contests $1.2k
 Daily Crypto Review, Jan 28 – Bitcoin Strong Bounce off the 30K level, Altcoins Reversals Followed
 Daily Crypto Review, Jan 29 – Dogecoin Skyrockets as r/Wallstreetbets Enters on Crypto; Bitcoin Jumps on Elon Musk’s Twitter Profile