
Daily Crypto Review, Jan 5 – Ethereum Outpaces the Market; Most Cryptos in the Red
The cryptocurrency sector experienced volatility amongst cryptos as Bitcoin continues its retracement and Ethereum outpaces the market. Bitcoin is currently trading for $31,479, representing a decrease of 4.15% compared to yesterday’s value. Meanwhile, Ethereum’s price has increased by a whopping 11.70% on the day, while XRP gained 1.27% of its value.

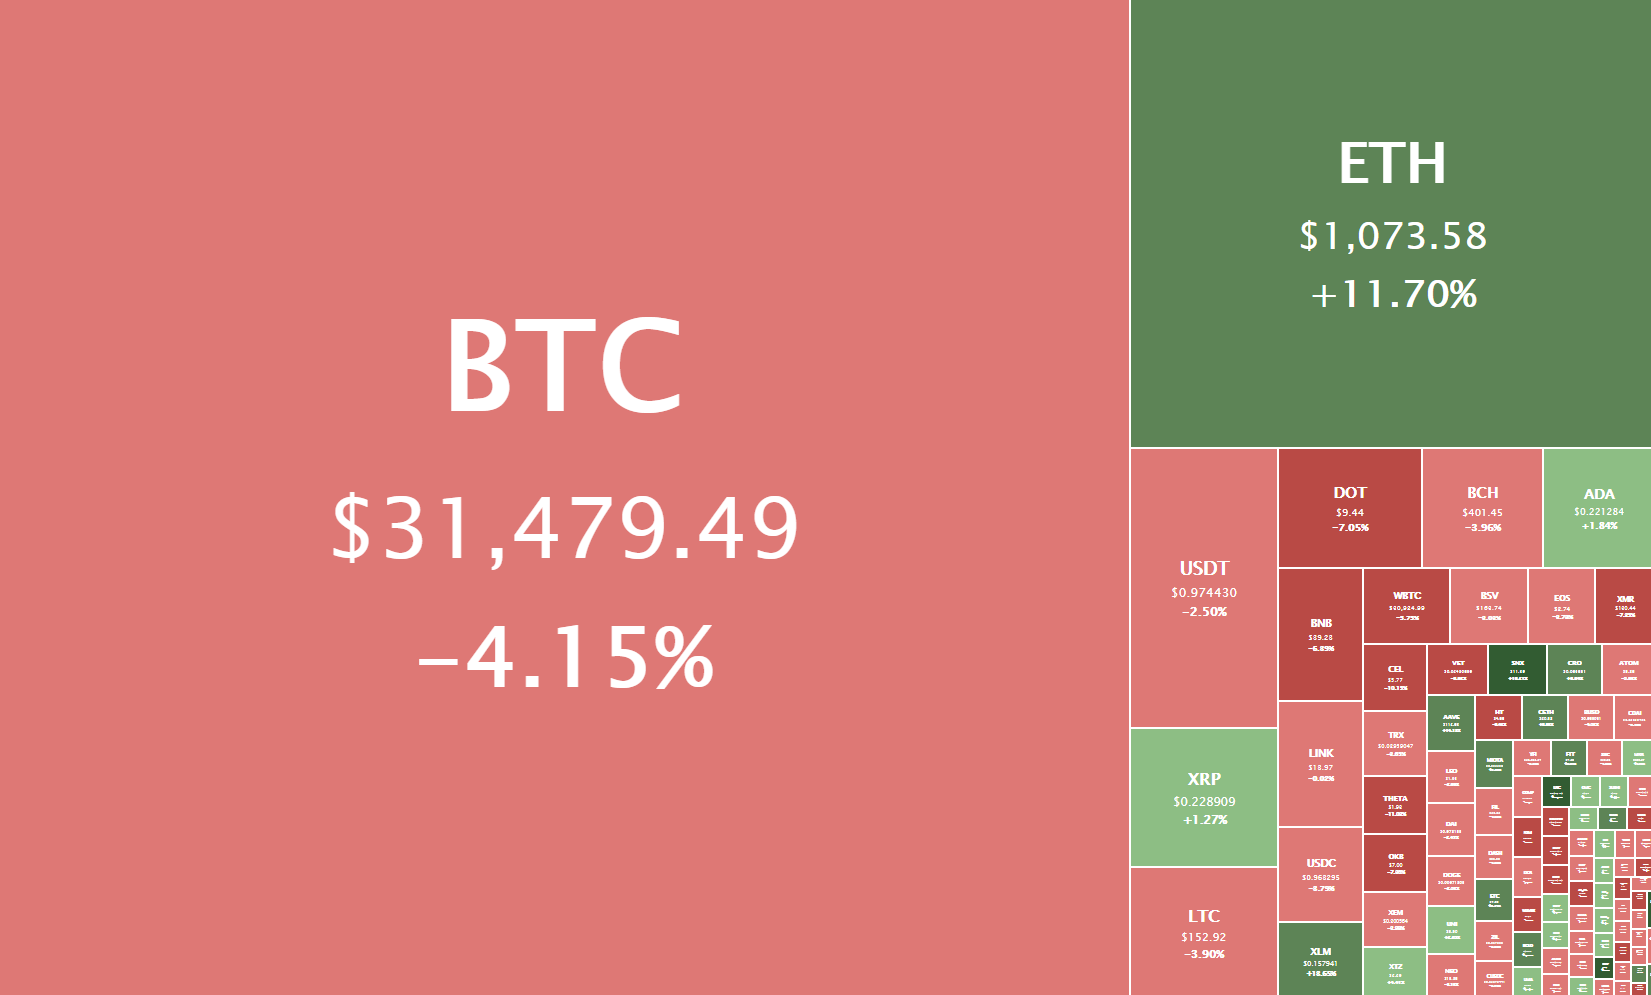
Daily Crypto Sector Heat Map
Birdchain gained 1498.92% in the past 24 hours, making it the most prominent daily crypto gainer by far. It is followed by Folgory Coin’s 837.8% and Rewardiqa’s 720.43% gain. On the other hand, Basiscoin Share lost 98.58%, making it the most prominent daily loser. It is followed by Basiscoin Cash’s loss of 90.24% and Mith Cash’s loss of 78.91%.
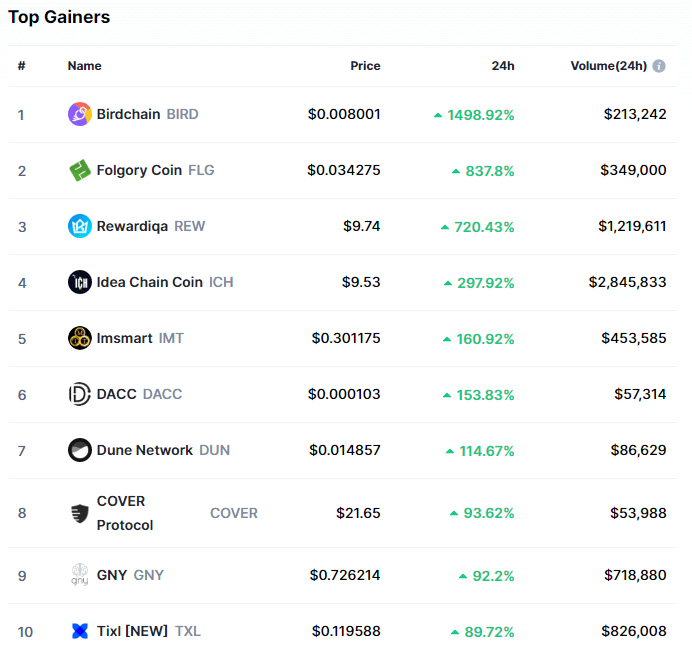
Top 10 24-hour Performers (Click to enlarge)
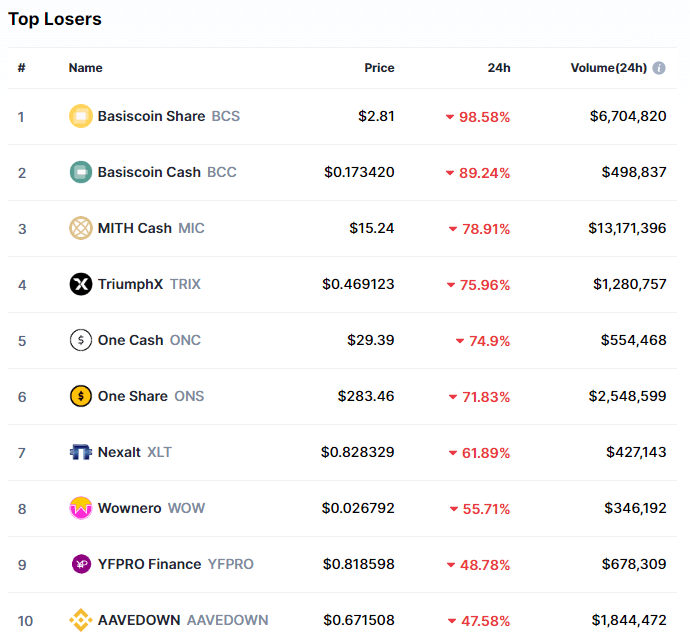
Bottom 10 24-hour Performers (Click to enlarge)
Bitcoin’s market dominance has moved down slightly since our last report, with its value currently being 68.2%. This value represents a 0.5% difference to the downside than the value it had when we last reported.
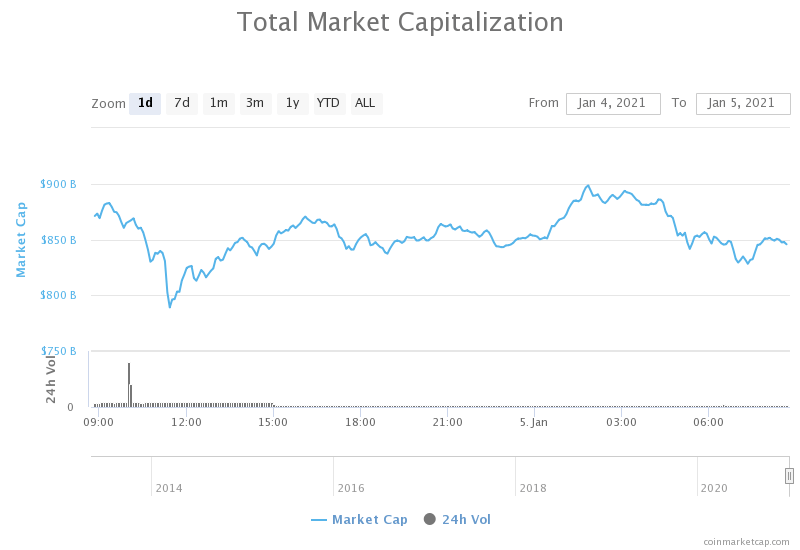
Daily Crypto Market Cap Chart
The cryptocurrency sector capitalization has decreased since we last reported, with its current value being $845.71 billion. This represents a $14.82 billion decrease when compared to our previous report.
_______________________________________________________________________
What happened in the past 24 hours?
_______________________________________________________________________
- As FinCEN’s comment window on crypto wallet rule comes to a close, uncertainty on path forward remains (The Block)
- SafePal the First Tokenized Hardware Wallet Backed by Binance (The Block)
- Cardano Sits on Stable Support Before Possible Rise (Cryptobriefing)
- Matic Attracts NFT Collectible Game Aavegotchi (Cryptobriefing)
- Bitcoin, Ethereum Crash Liquidates $1.1 Billion Leveraged Traders (Cryptobriefing)
- Mike Novogratz thinks the Bitcoin price could correct after gaining 100% in weeks (Cryptoslate)
- XLM bumps to $0.15 as Ukraine selects Stellar for its CBDC (Cryptoslate)
- US Federal Regulator Says Banks Can Conduct Payments Using Stablecoins (Coindesk)
- Crypto-friendly app cautions users to ‘reassess’ XRP holdings (Cointelegraph)
- Litecoin briefly flips XRP as 4th largest crypto amid Ripple–SEC spat (Cointelegraph)
_______________________________________________________________________
Technical analysis
_______________________________________________________________________
Bitcoin
Bitcoin has possibly ended its retracement and entered sideways trading as its price created a double bottom at the $30,000 mark. However, there was one point where the largest cryptocurrency by market cap dropped as much as 20% and broke $28,000 to the downside, but recovered almost instantly.
BTC is currently right above the $30,807 Fib retracement level and is fighting to stay above it. If it posts a candle that shows it consolidated above this level, we could see another push towards the upside. However, if it breaks the Fib retracement, we could see BTC looking for support at the $30,000 or $29,300 levels.
BTC/USD 4-hour chart
Bitcoin’s technicals are showing a strong tilt towards the buy-side, with only the 4-hour time-frame showing bearish oscillator values.
BTC/USD 1-day Technicals
Technical factors (4-hour Chart):
- Price is slightly above its 50-period EMA and at its 21-period EMA
- Price is near its middle Bollinger band
- RSI is neutral (48.20)
- Volume is slightly above average
Key levels to the upside Key levels to the downside
1: $34,800 1: $30,807
2: $35,000 2: $28,337
3: $36,000 3: $26,340
Ethereum
Ethereum is certainly one of the most interesting cryptocurrencies in the last couple of days, with its price going from stagnation to skyrocket mode in a matter of hours. While many thought that the initial push above $1,000 is over and that ETH is destined to retrace below it, the second-largest cryptocurrency by market cap managed to do it again – just one day later.
The cryptocurrency managed to bounce off of one of its numerous support levels and propel its price back above $1,000.
Ethereum is now fighting for the $1,000 level, with its price barely staying above it.
ETH/USD 1-hour Chart
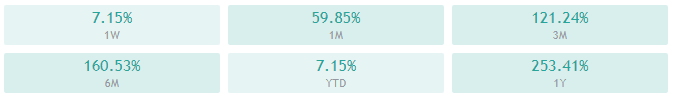
Ethereum’s technicals on all time-frames show an overall bullish tilt with hints of neutrality coming from oscillators.
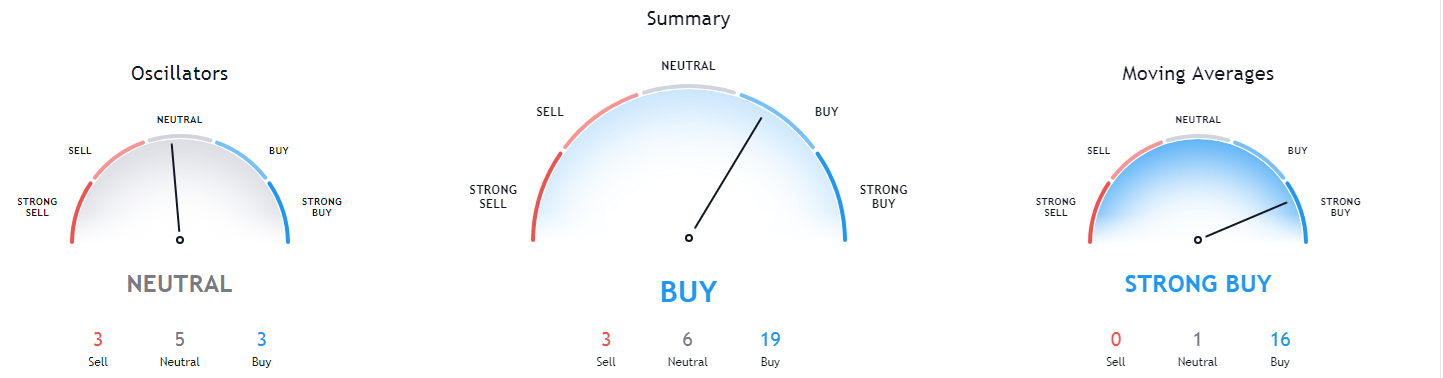
ETH/USD 1-day Technicals
Technical Factors (4-hour Chart):
- Price is above both its 50-period and its 21-period EMA
- Price is near its top Bollinger band
- RSI has left the overbought area (68.56)
- Volume is significantly above-average
Key levels to the upside Key levels to the downside
1: $1,047 1: $1,009
2: $1,080 2: $960
3: $1,169 3: $932
Litecoin

Litecoin ended its 2-day bull run after reaching bull exhaustion at the $174.5 mark, after which it started to consolidate. However, the consolidation phase looks like less of a consolidation phase and more like a fight for the $152 Fib retracement level.
Litecoin is currently losing the battle for $152 – but even in the case of bears pushing it to the downside, its price has many support anchor points, most notably the zone between $135 and $142.
LTC/USD 1-hour Chart
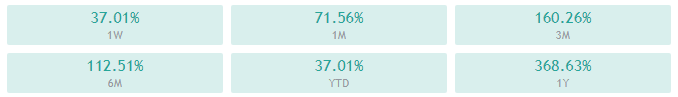
Litecoin’s technicals on the 4-hour and monthly time-frame are completely bullish, while its daily and weekly overviews show some oscillators having bearish values.
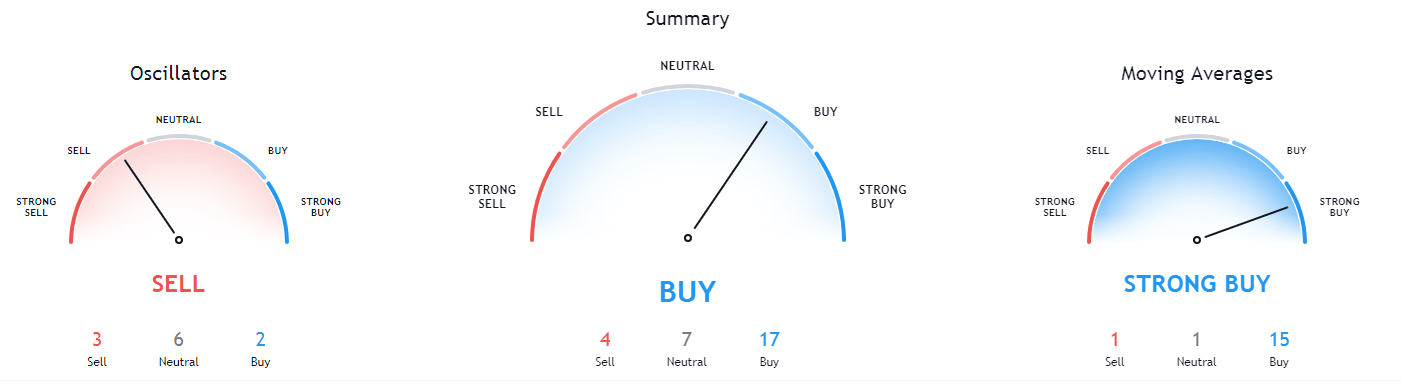
LTC/USD 1-day Technicals
Technical factors (4-hour Chart):
- Its price is currently above both its 50-period EMA and its 21-period EMA
- Price is at its middle Bollinger band
- RSI is neutral (58.54)
- Volume is above-average
Key levels to the upside Key levels to the downside
1: $163.7 1: $155.25
2: $174.5 2: $149.3
3: $195.5 3: $143.5
Related posts
 Daily Crypto Review, Jan 6 – Bitcoin Retraces after Creating a New All-Time High; Sector in the Green
 Daily Crypto Review, Jan 8 – Bitcoin Continues Its Rise as it Breaks the $40k Mark Briefly
 Daily Crypto Review, Jan 11 – Crypto Sector Plummets as BTC Drops to $32k
 Daily Crypto Review, Jan 20 – ETH Reaches a New All-Time High; Crypto Sector in the Red