
The cryptocurrency sector is trying to find an equilibrium but was mostly volatile in recent days, with BTC retracing slightly and Ethereum skyrocketing towards its all-time highs. Bitcoin is currently trading for $31,796, representing a decrease of 8.08% compared to yesterday’s value. Meanwhile, Ethereum’s price has increased by a whopping 24.61% on the day, while XRP gained 7.37% of its value.

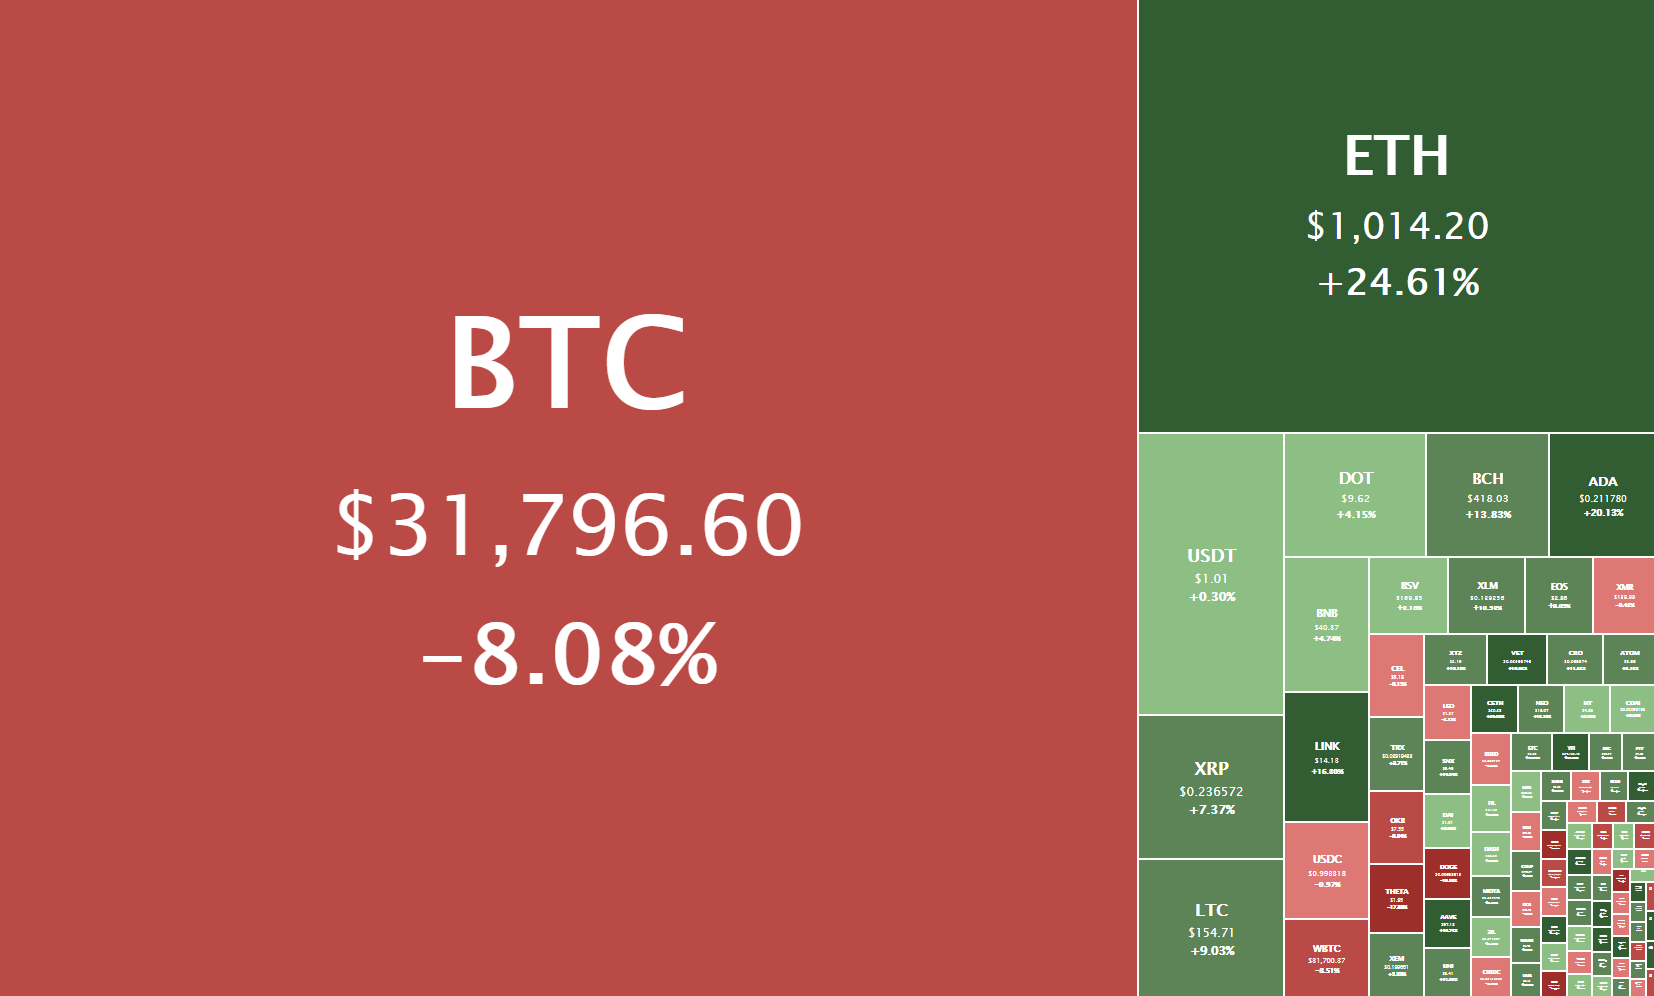
Daily Crypto Sector Heat Map
Scanetchain gained 446.19% in the past 24 hours, making it the most prominent daily crypto gainer by far. It is followed by Amun Ether 3x Daily Long’s 246.1% and Education Ecosystem’s 195.84% gain. On the other hand, Basiscoin Cash lost 96.51%, making it the most prominent daily loser. It is followed by Wownero’s loss of 91.09% and Bridge Finance’s loss of 90.45%.
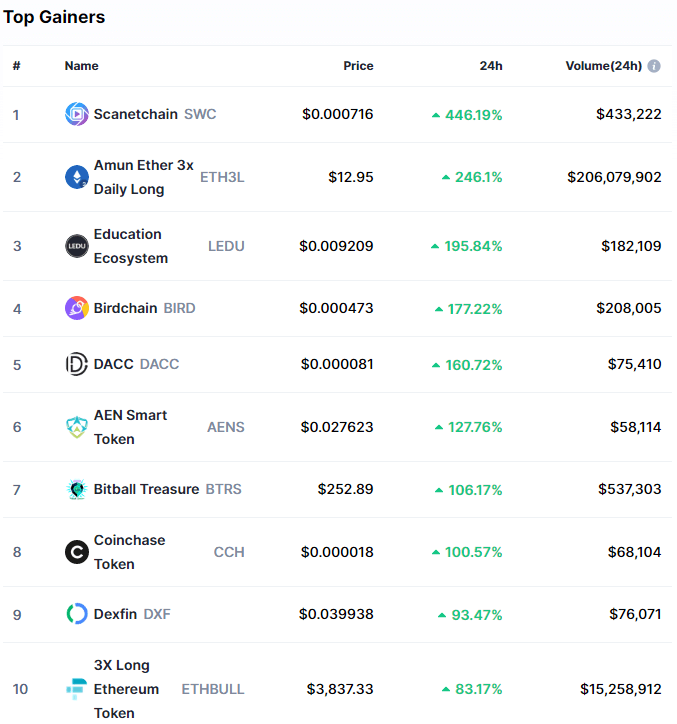
Top 10 24-hour Performers (Click to enlarge)
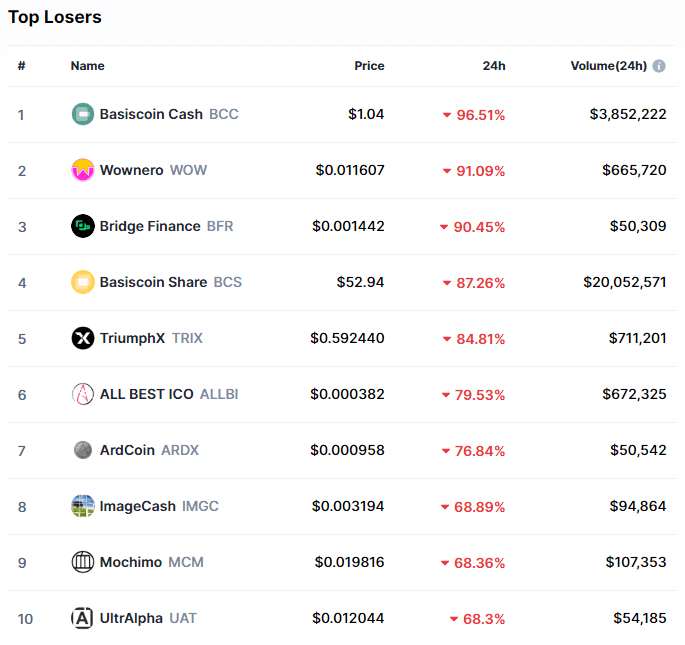 Bottom 10 24-hour Performers (Click to enlarge)
Bitcoin’s market dominance has moved down almost two percent since our last report, with its value currently being 68.7%. This value represents a 1.9% difference to the downside than the value it had when we last reported.
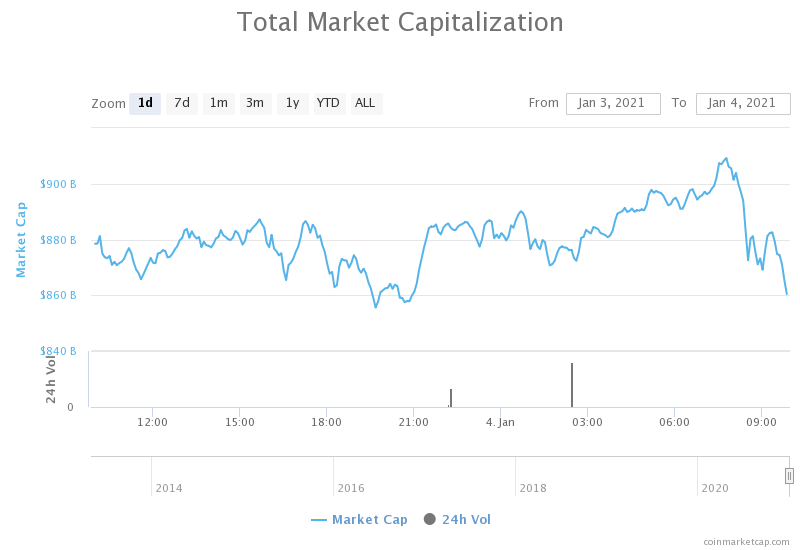 Daily Crypto Market Cap Chart
The cryptocurrency sector capitalization has increased greatly since we last reported, with its current value being $860.45 billion. This represents a $97.68 billion increase when compared to our previous report.
_______________________________________________________________________
What happened in the past 24 hours?
_______________________________________________________________________
- Average crypto venture funding size grew about 33% in 2020 (The Block)
- UK crypto ATM operators have scrambled to keep up with new regulatory demands. Will it be enough? (The Block)
- Shenzhen gives away $3 million worth-of digital yuan in third CBDC test (The Block)
- Bitcoin’s Birthday: Satoshi Nakamoto’s Hidden Message Explained (Cryptobriefing)
- Ethereum Hits $100 Billion Market Cap in Parabolic Run (Cryptobriefing)
- DOGE’s Gone Wild! Meme Coin Soars After Adult Star Says She’s a HODLer (Coindesk)
- Bitcoin Worth $1B Leaves Coinbase as Institutions ‘FOMO’ Buy: Analyst (Coindesk)
- SushiSwap (SUSHI) trading volumes hit fresh all-time high as DeFi market heats up (Cryptoslate)
- Binance US CEO predicts $100K Bitcoin by 2022 (Cointelegraph)
- IRS to transition from ‘education to enforcement,’ says former division chief (Cointelegraph)
_______________________________________________________________________
Technical analysis
_______________________________________________________________________
Bitcoin
Bitcoin had continued its move up slowly until Jan 2, when its price skyrocketed and reached as high as $34,800. With this being set as the new all-time high, BTC started retracing and consolidating within a wide range, bound by the all-time high to the upside and $30,807 to the downside.
Any strong pushes were easily foreseen by the gradual increase in volume, which is what traders should pay attention to when trading the largest cryptocurrency by market cap.
BTC/USD 4-hour chart
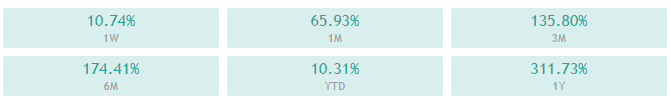
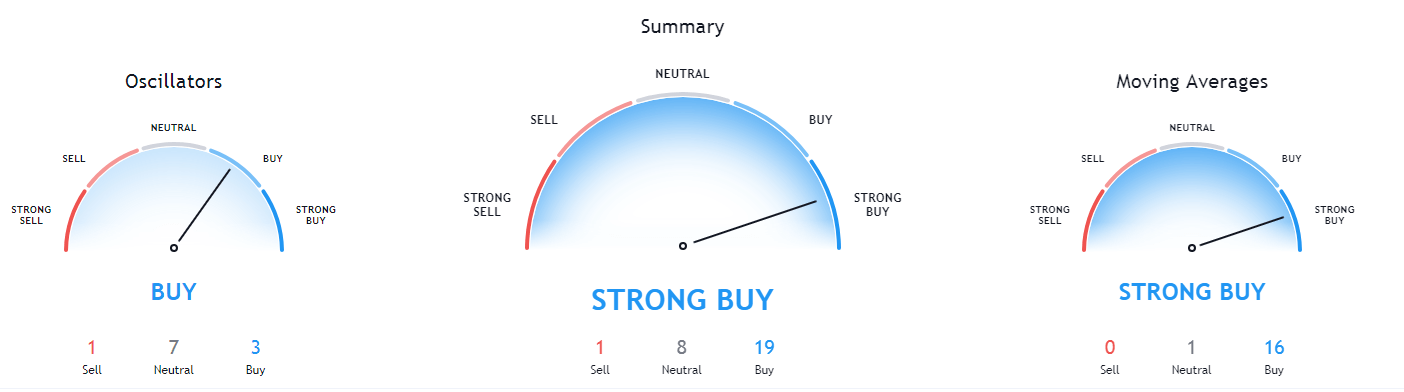
Bitcoin’s technicals are showing a strong tilt towards the buy-side. However, some of its time-frames show slight neutrality alongside the overall bullishness.
BTC/USD 1-day Technicals
Technical factors (4-hour Chart):
- Price is slightly above its 50-period EMA and above its 21-period EMA
- Price is near its middle Bollinger band
- RSI is neutral (55.04)
- Volume is slightly above average
Key levels to the upside Key levels to the downside
1: $34,800 1: $30,807
2: $35,000 2: $28,337
3: $36,000 3: $26,340
Ethereum
Ethereum’s spike could be considered a late response to Bitcoin’s spike, as its price followed in direction but not percentage-wise when BTC pushed towards $35k. However, the second-largest cryptocurrency by market cap skyrocketed in the past hours, reaching as high as $1,169.
This push towards the $1k mark is historic, as the only real upside is the all-time high of $1,420 from Jan 2, 2020.
Ethereum is currently fighting to stay above the $1,000 mark, and its short-term future will be determined by it managing to stay above or retracing below this level.
ETH/USD 1-hour Chart
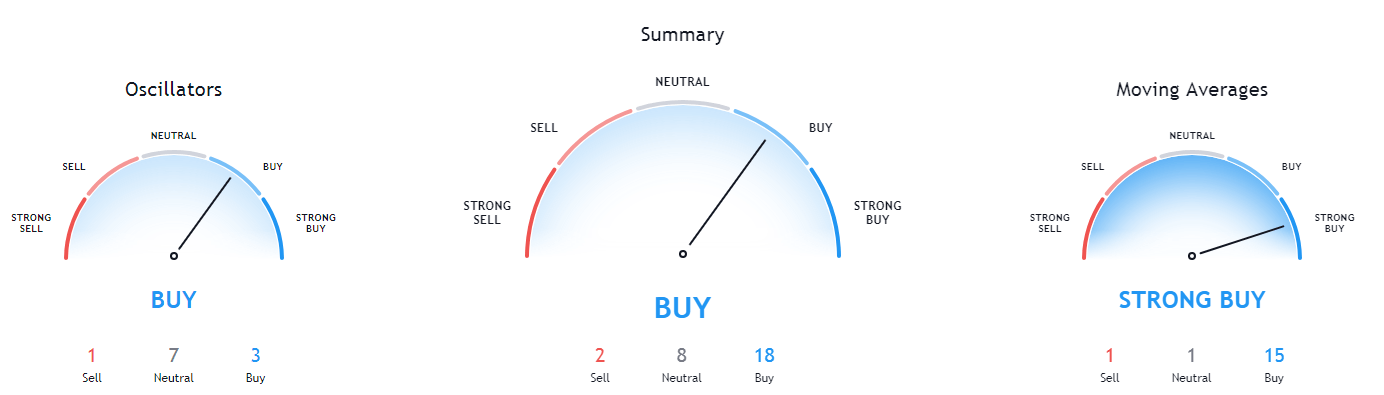
Ethereum’s technicals look very much like Bitcoin’s, with the overall tilt being towards the buy-side, with oscillators tilting towards bearishness.

ETH/USD 1-day Technicals
Technical Factors (4-hour Chart):
- Price is above its 50-period and at its 21-period EMA
- Price is near its middle Bollinger band
- RSI is neutral (60.37)
- Volume is descending from above-average levels
Key levels to the upside Key levels to the downside
1: $1,047 1: $1,009
2: $1,080 2: $960
3: $1,169 3: $932
Litecoin
Litecoin had an amazing 2-day run as its price increased from $124 all the way up to $175. However, the $175 mark stopped the bulls from reaching any higher, and Litecoin started retracing. The retracement also came as a response to BTC’s retracement, as the two cryptocurrencies are highly correlated.
Litecoin is now struggling to stay above the $155.25 level. However, its short-term price direction will most likely be decided by Bitcoin’s movements, rather than staying above or below any support/resistance levels.
LTC/USD 1-hour Chart
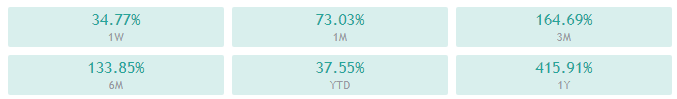
Litecoin’s technicals on all time-frames are tilted towards the buy-side and show almost no bearish or neutral signs.
LTC/USD 1-day Technicals
Technical factors (4-hour Chart):
- Its price is currently above its 50-period EMA and at its 21-period EMA
- Price is at its middle Bollinger band
- RSI is in the oversold territory (50.57)
- Volume is currently on below-average levels
Key levels to the upside Key levels to the downside
1: $163.7 1: $155.25
2: $174.5 2: $149.3
3: $195.5 3: $143.5
Related posts
 Daily Crypto Review, Jan 15 – Bitcoin Retraces After Hitting $40k; Ethereum Contests $1.2k
 Daily Crypto Review, Jan 20 – ETH Reaches a New All-Time High; Crypto Sector in the Red
 Daily Crypto Review, Jan 21 – BTC in a Triangle Formation – What do the Analysts Say?
 Daily Crypto Review, Jan 22 – Bitcoin Briefly Drops Below $30K; Market Sees Blood on the Streets