At forex.academy, we understand that a trading record is a decisive component to be successful in Forex. That’s why we took the time to create a free trading log on an Excel Spreadsheet. It was designed to present all the needed information at a glance. Here we present its guide.

The Stats Section
The top of the spreadsheet shows the Main statistics of your trading record.
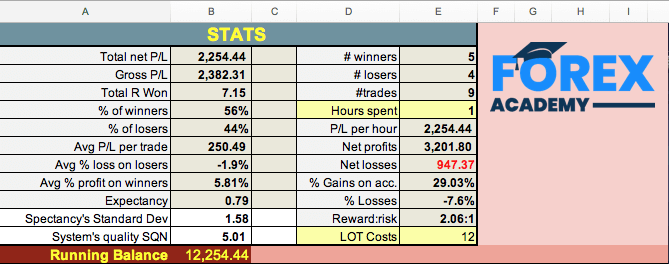
Total net P/L: The net profits after the trading costs. You can set an average cost in the bottom right cell named “LOT Costs”. If you enter the lot cost, the sheet will compute every trade cost by multiplying it by the actual lots of the trade. Of course, you can set it manually on every trade with the exact costs your broker charged.
Gross P/L: The total profit without costs.
Total R won. R is the measure of your risk. The “R multiple” column converts the net profit into a ratio Net Profit/$Risk. R is a measure of the profit/loss for every dollar risked. This helps you plan your objectives and calculate the risk needed to achieve them. For example, if you find that you are making 20R per month and plan to earn 3000$ monthly, you will need to risk $3000/20 = $150 on every trade.
% Winners: The winner percent figure.
% Losers: The percent of losers
AVG P/L per Trade: The average dollar won/lost. It is the Total net won/lost divided by the number of trades.
Avg % loss on losers: The average percent capital lost on losing trades.
Avg % profit on winners: The average percent capital won on winning trades.
Expectancy: A measure of what you can expect to gain in the next trade for every dollar risked. The example shown is 0.79, which means you can expect to earn $79 every time you trade if your risk is $100.
Expectancy’s Standard Dev: A statistical measure of the variability of the expectancy figure. You can expect that 95% of Expectancy’s values are plus and minus two stdev from 0.79.
#winners: The number of winners.
#losers: the number of losers.
Hours Spent: this is a manual input of your time spent in trading.
P/L per hour: It will compute your profit per hour spent in trading.
Net Profits: These are the net profits on winning trades.
Net Losses: The losses on losing trades.
% Gains on account: The total sum of the percent gained on winning trades.
% Losses: The sum of the percent lost on losing trades.
Reward:risk: The average reward/risk of your trades.
LOT Costs: This is a manual entry for the average costs per lot your broker charges you.
Running Balance: The initial capital ( Cell B17) plus the total net P/L amount (on closed trades). Please note that this balance does not take into account open trades.
Total costs: The sum of the cost of spreads and commissions of your trades. This parameter will help you understand how much of your money goes to your broker. It could be handy if you want to negotiate rebates or shift your business to another cheaper broker.
The trades

The cells in columns with a yellow heading are for you to enter manually. The rest were filled with the needed formulas to get the stats figures, so there is no need to touch them when trading.
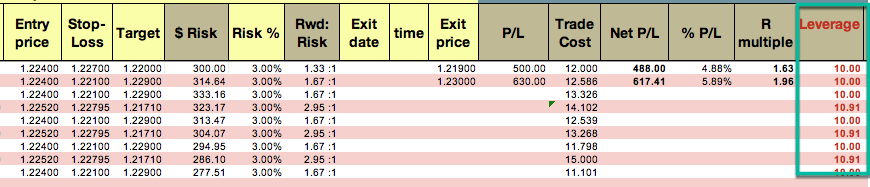
The exception is The Trade Cost column. This column is also filled with the formula to approximate your costs if you supply the average cost per lot in the B12 cell. But you can also manually enter your true cost.
Entering a Trade
We have designed the sheet so that you have total control over your risk on every trade. Therefore, we should begin to enter the desired percent risk for the coming trade. Let’s say 1%. With this figure, the sheet computes the dollar-risk based on your current account balance.
After entering the entry price and stop-loss level, it will also compute the recommended trade size in lots. You should then input the real lot number in the following column, “Real lots.” It was designed that way because we must take into account several open trades at the same time.
How the sheet computes the risk of the next trade?
When allowing several simultaneous trades, the model chosen to compute risk is to subtract the risk of the previous open trades to the available capital. That way, you risk a percent of the money not currently at risk. But when you close a trade and record it, the sheet recalculates all cells. Thus, the sheet needs the “Real Lots” column, so the record does not get modified every time an open trade is closed.
After the trader decides the percent of his account to risk on a trade, the real lot size, and the entry and stop-loss point are set, the sheet also shows the leverage of that trade. That way, all the risk information is displayed. Please, beware that a risk of 3 percent corresponds with a leverage of 10, and that leverages over 10:1 should be avoided, especially when several trades are open on major currency pairs.
JPY pairs
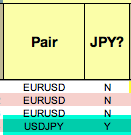
The column JPY? was added for the right calculation of JPY pairs’ values, as these pairs’ pip value is in the second decimal place instead of in the fourth decimal. You should input Y on these pairs to get the right trade size, profit, and leverage. Please, note that pip values on non-USD quote currencies are approximate.
Entry and exit date and time
These are optional entries, but it is advisable to register these values to get observations about the average time on a trade and the average time for a trade to hit stop-loss and take-profit levels.
Trading results
Once the Exit price has been entered, the sheet displays the profit/loss (P/L), Net P/L, %P/L and R multiple of the trade. This will help assess essential parameters, such as the average Trade profit, the usual percent obtained, and the real reward/risk values (R), which is also the profit on a one-dollar risk.
Trade quality
Alexander Elder recommends traders value the quality of the trade based on one objective parameter: The percentage of the available profit you could obtain from the trade.
One possible scale is 0: less than 10%, 1: from 10 to 25%, 2: from 25, to 50%, 3: from 50 to 75% 4: from 75 to 90% 5: over 90%. This will help you see if, over time, you’re improving, maintain, or decrease the quality of your trades. It will reveal the best times of the session to trade.
MAE/MFE
These are to annotate the Maximum adverse excursion and Maximum Favorable excursion. These two parameters are important clues to improve stop-loss and take-profit levels. It will help you also analyze if your entries are too early or too late and take measures to correct them. For more on this subject, please read an MAE/MFE explanation here.
Summarizing
We hope this spreadsheet will help you be a better trader. Please modify and complete it at will for your purposes. This trading log is not perfect, but it is a starting point.