
The cryptocurrency sector spent the weekend hovering around the same spot as Bitcoin was testing its ~$13,000 level. Bitcoin is currently trading for $13.049, representing a decrease of 0.80% on the day. Meanwhile, Ethereum lost 1.52% on the day, while XRP gained 0.18%.
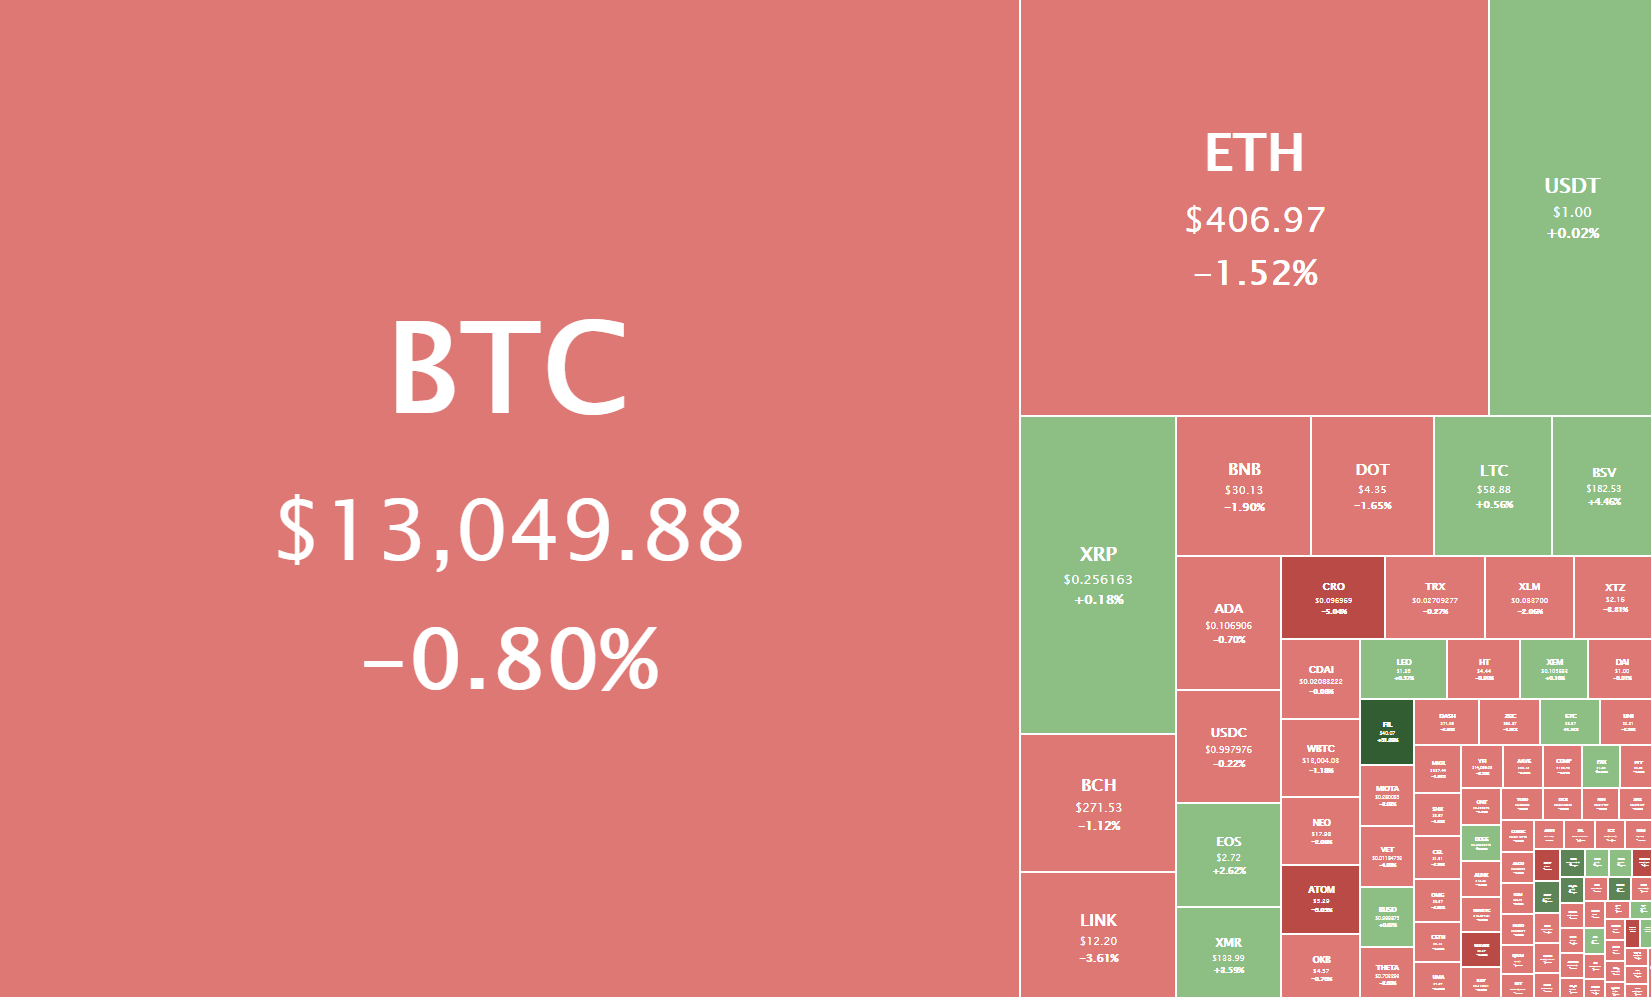
Daily Crypto Sector Heat Map
If we check out the top 100 cryptocurrencies, Flexacoin gained an astonishing 171.94% in the past 24 hours, making it the crypto to gain the most in a day. Filecoin (56.89%) and Reserve Rights (13.22%) also did great. On the other hand, Energy Web Token lost 7.94%, making it the most prominent daily loser. It is followed by Cosmos’ loss of 5.78% and ABBC Coin’s loss of 5.71%.
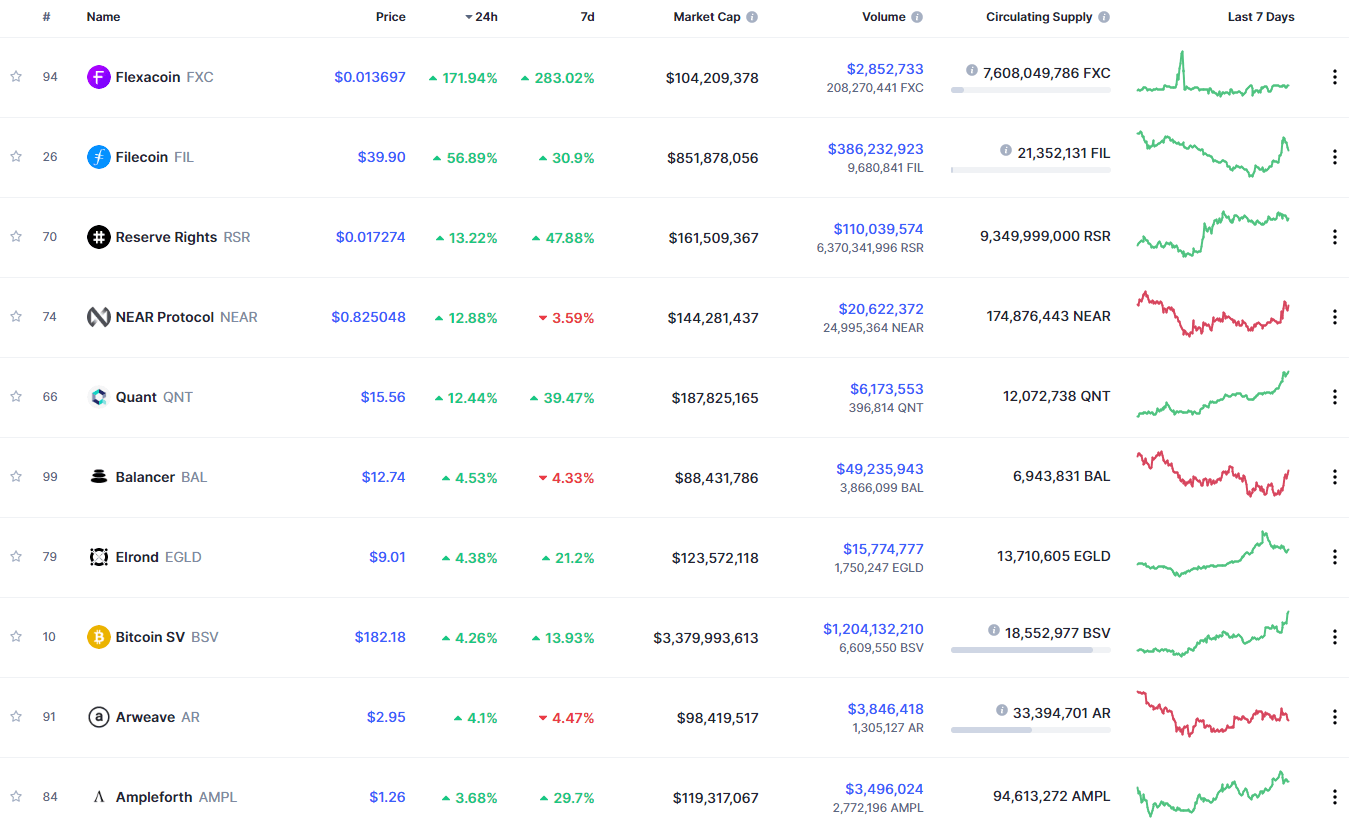
Top 10 24-hour Performers (Click to enlarge)
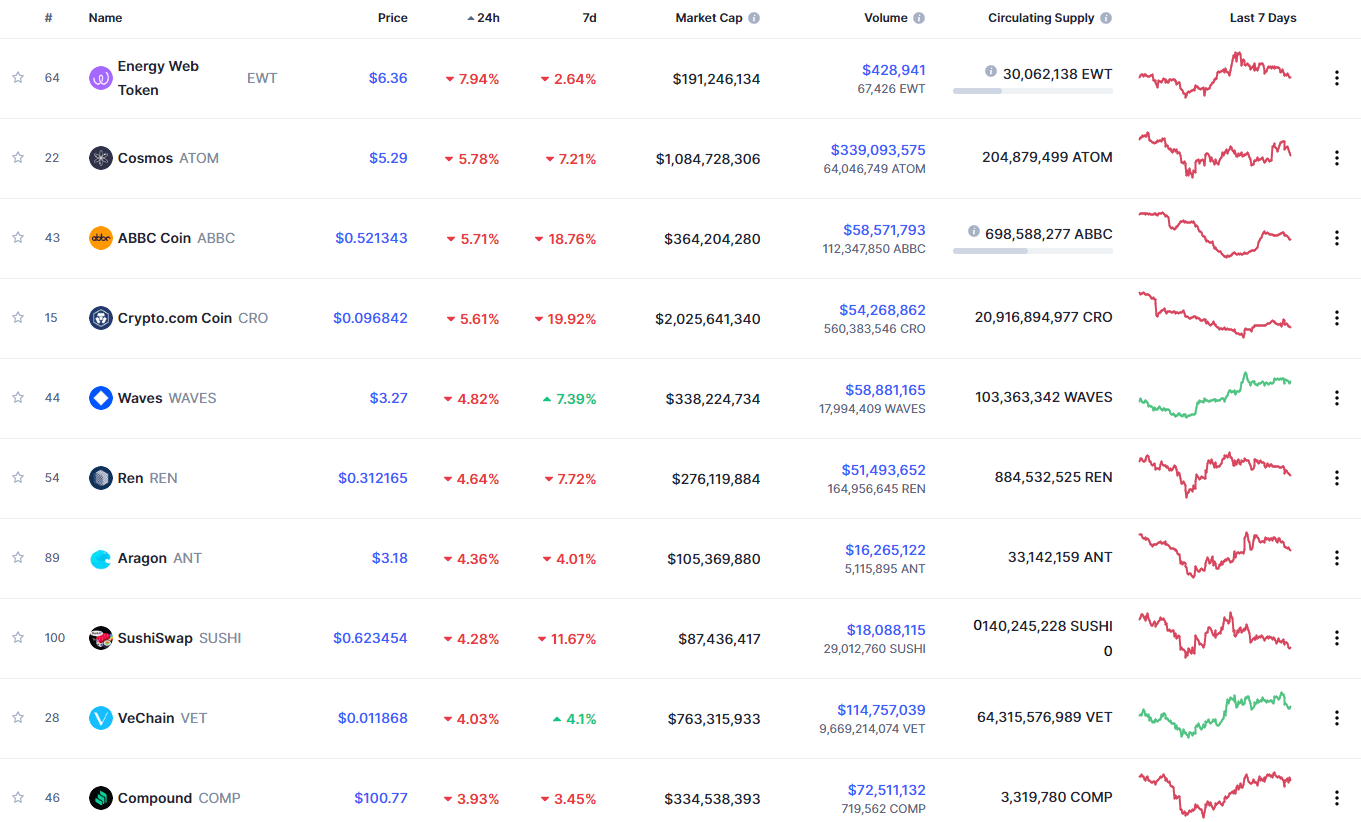
Bottom 10 24-hour Performers (Click to enlarge)
Bitcoin’s market dominance level had increased slightly since when we last reported, with its value is currently 61.1%. This value represents a 0.3% difference to the upside when compared to when we last reported.
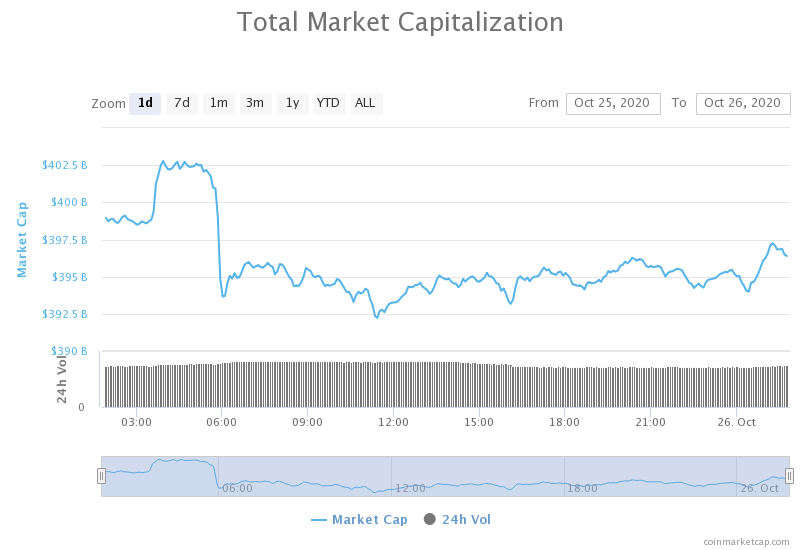
Daily Crypto Market Cap Chart
The crypto sector capitalization has stayed at the same place since we last reported. Its current value is $396.38 billion, representing an increase of $1.83 billion compared to our previous report.
_______________________________________________________________________
What happened in the past 24 hours?
_______________________________________________________________________
- Decentralized protocol Kyber launches new framework to facilitate on-chain market making (The Block)
- The United States is the country of choice for most institutional crypto trading service providers (The Block)
- Open interest on Augur prediction markets passes $1M (The Block)
- Tezos’ XTZ Faces Uphill Battle After Massive 58% Correction (Cryptobriefing)
- DeFi Total Value Locked Reaches $12.5B All-Time High Despite Cooling Hype (Cryptobriefing)
- US Regulators May Soon Collect Data on All Crypto Transactions Above $250 (Cryptobriefing)
- Top DeFi coins Yearn.finance (YFI) and AAVE rip 10% higher as Bitcoin holds $13k (Cryptoslate)
- Bitcoin breaking $14,000 will bring a new “regime” of market dynamics (Cryptoslate)
- Bitcoin’s Rivalry With Gold Plus Millennial Interest Gives It ‘Considerable’ Upside Potential: JPMorgan (Coindesk)
- Tether’s general counsel doubles down on its support for Peter McCormack (Cointelegraph)
_______________________________________________________________________
Technical analysis
_______________________________________________________________________
Bitcoin
The largest cryptocurrency by market capitalization has spent the weekend hovering around the $13,000 mark, and even attempted to break through the $13,200 resistance level (but failed to). With the volume is descending ever since Oct 21, most analysts are expecting a big move very soon. However, they are torn when it comes to the direction.
Traders should pay attention to how BTC handles its push towards the resistance level, as there might be good trading opportunities after (more likely) the level holds and a pullback occurs, or after BTC breaks the level and pushes higher (less likely).
BTC/USD 4-hour Chart
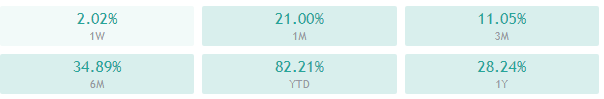
Bitcoin’s sentiment is highly bullish, with its shorter time-frames showing a bigger tilt towards neutrality, while its longer time-frames are more titled to the buy-side.
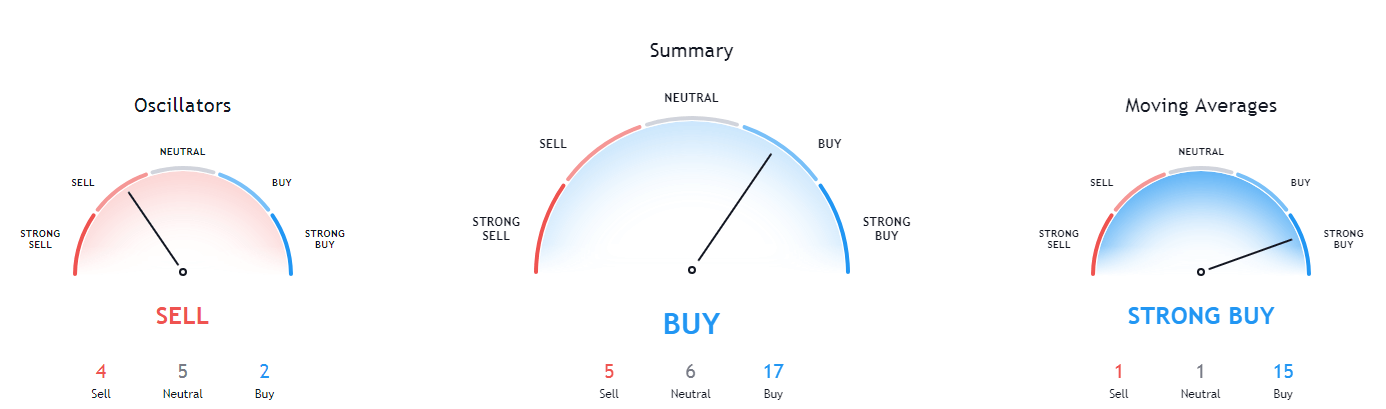
BTC/USD 1-day Technicals
Technical factors (4-hour Chart):
- Price is far above its 50-period EMA and slightly above its 21-period EMA
- Price is at its middle Bollinger band
- RSI is slightly below being overbought (62.22)
- Volume is descending
Key levels to the upside Key levels to the downside
1: $12,870 1: $12,500
2: $13,200 2: $12,300
3: $14,000 3: $12,000
Ethereum
Ethereum has continued its descent from the highs it made on Oct 22, with its price moving slowly towards the downside. The smaller time-frame charts are showing that ETH kept creating new lower highs, with one (failed) attempt to break out of the trend. The next couple of hours will be crucial, as Ethereum is about to hit the trend line, break it or continue pushing down towards $400.
Traders should watch for how Ethereum reacts to the descending trend line and trade off of it.
ETH/USD 2-hour Chart
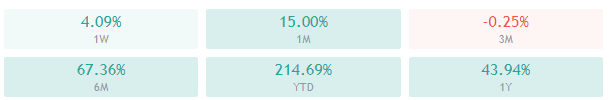
Ethereum’s technicals are tilted towards the buy-side on all time-frames, with its lower time frames being slightly more neutral.
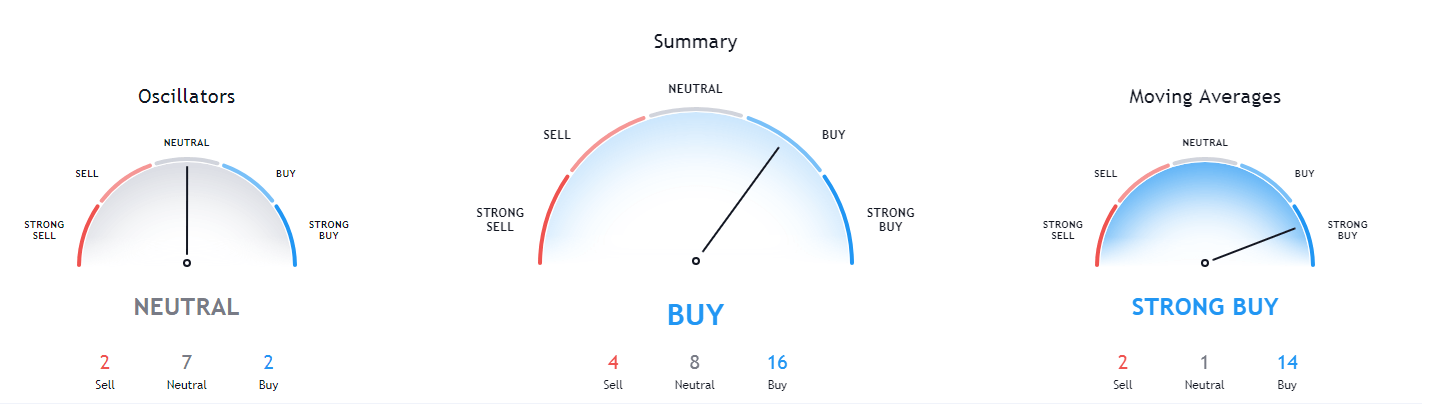
ETH/USD 1-day Technicals
Technical Factors (4-hour Chart):
- The price is above its 50-period and slightly above its 21-period EMA
- Price is at its Bollinger band
- RSI is overbought (52.24)
- Volume is average
Key levels to the upside Key levels to the downside
1: $415 1: $400
2: $420 2: $378
3: $435 3: $371
Ripple
The fourth-largest cryptocurrency by market cap spent the weekend testing its ascending support level (the dotted yellow line), which dates back from Oct 16. XRP has slowly descended from its most recent highs and reached the support line at the ~$0.252 level. The line provided good support, and XRP shot up as a result of it. However, it could not break the $0.26 resistance level, which may prove a problem in the long run.
XRP is unlikely to pass $0.26 unless it is fueled by Bitcoin’s push towards the upside. The more likely scenario would be that XRP hovers between the support line and the $0.26 level for some time.
XRP/USD 4-hour Chart
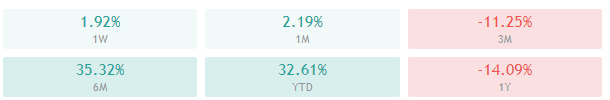
XRP’s technicals are bullish with hints of neutral sentiment on the 4-hour, 1-day, and 1-week time-frames, while its monthly time-frame shows strong bearish sentiment.
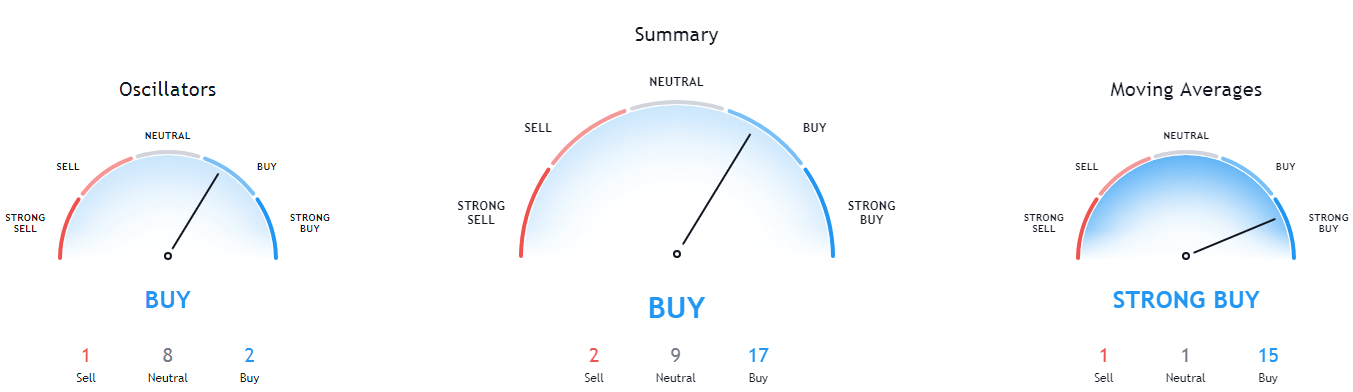
XRP/USD 1-day Technicals
Technical factors (4-hour Chart):
- The price above both its 50-period EMA and its 21-period EMA
- Price is near its top Bollinger band
- RSI is ascending (58.25)
- Volume is elevated
Key levels to the upside Key levels to the downside
1: $0.26 1: $0.2454
2: $0.266 2: $0.235
3: $0.2855 3: $0.227
Related posts
 Daily Crypto Review, July 9 – TikTokers Causing Dogecoin’s Surge; Cryptos Make Another Move Up
 Daily Crypto Review, August 5 – XRP Drops by 6% Despite Fundamentals Booming
 Daily Crypto Review, Nov 11 – Mempool Cleared! Bitcoin Fees Plummet
 Daily Crypto Review, Dec 08 – BTC, ETH and XRP Preparing for a Big Move; Crypto Sector in Consolidation Mode