
The cryptocurrency sector has spent the day consolidating and preparing for the next move and setting up valid technical formations. The largest cryptocurrency by market cap is currently trading for $15,377, representing an increase of 0.01% on the day. Meanwhile, Ethereum gained 2.08% on the day, while XRP gained 1.14%.
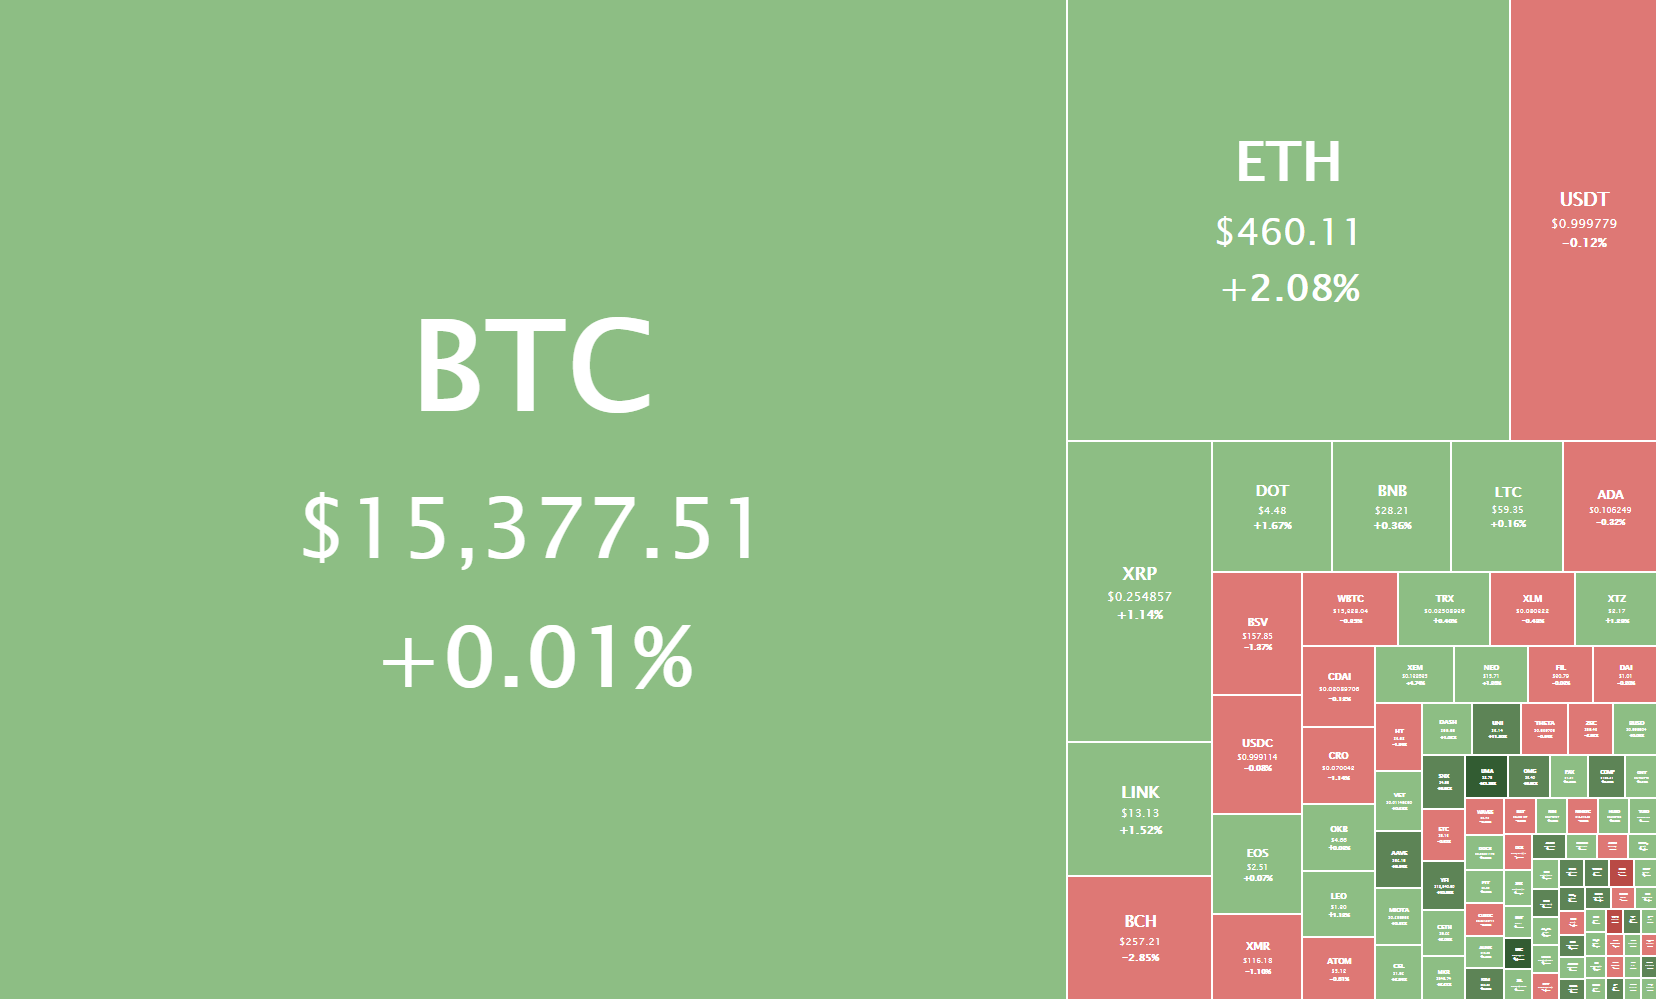
Daily Crypto Sector Heat Map
Loopring gained 30.64% in the past 24 hours, making it the most prominent daily gainer out of the top100 cryptos ranked by market capitalization. It is closely followed by UMA’s gain of 24.45% and yearn.finance’s 17.59% gain. On the other hand, Decentraland lost 13.96%, making it the most prominent daily loser. Decred lost 9.94% while HedgeTrade lost 8.76%, making them the 2nd and 3rd most prominent daily losers.
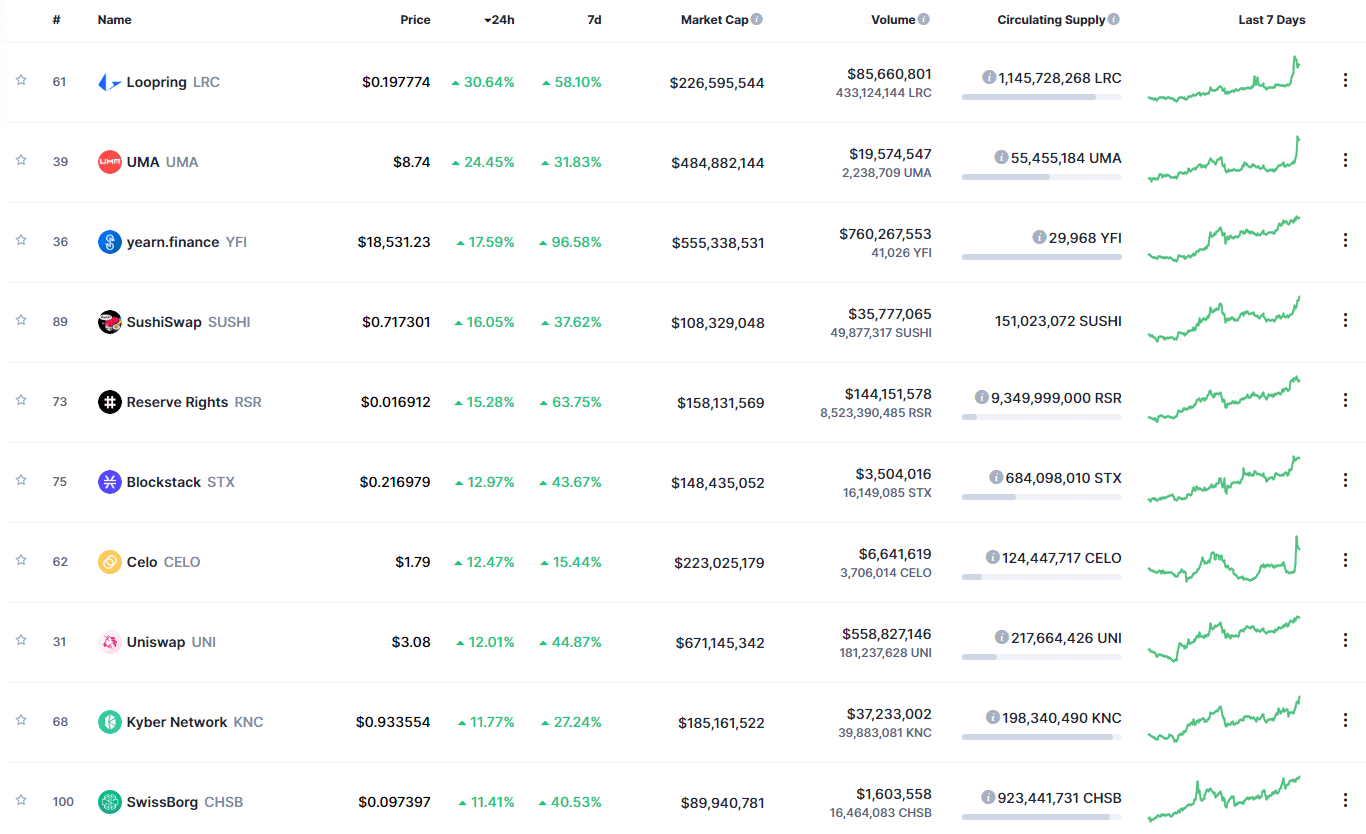
Top 10 24-hour Performers (Click to enlarge)
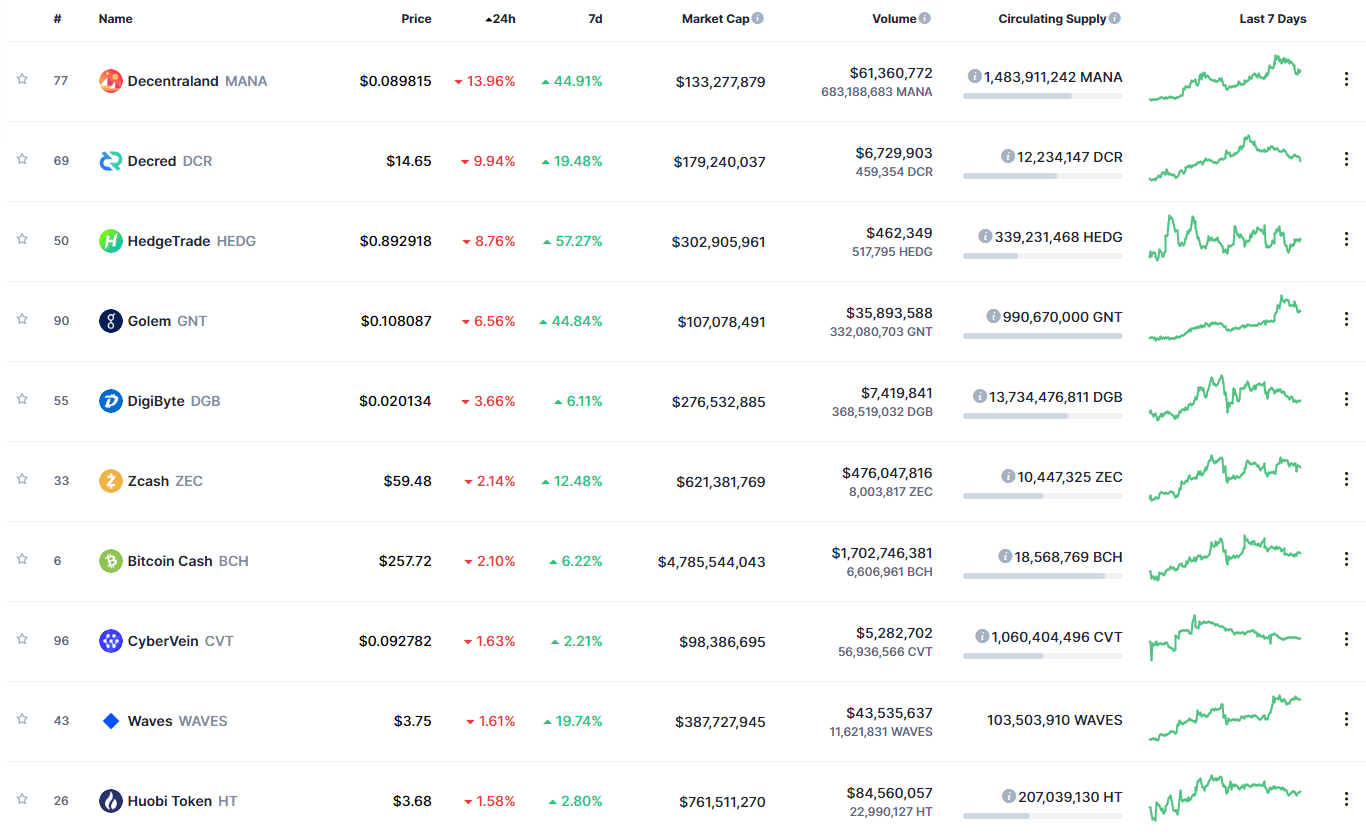
Bottom 10 24-hour Performers (Click to enlarge)
Bitcoin’s market dominance has decreased slightly since we last reported, with its value is currently staying at 63.9%. This value represents a 0.3% difference to the downside compared to the value it had yesterday.
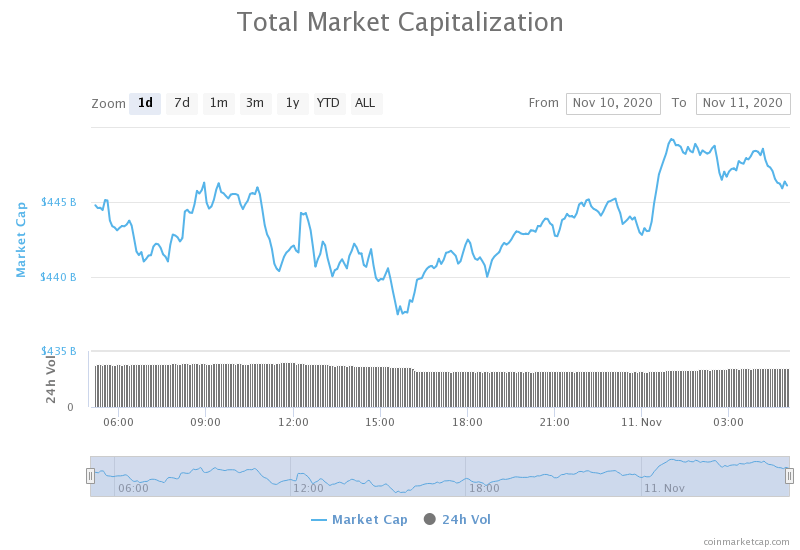
Daily Crypto Market Cap Chart
The crypto sector capitalization has gone up slightly over the course of the day. Its current value is $446.12 billion, representing a $4.38 billion increase compared to our previous report.
_______________________________________________________________________
What happened in the past 24 hours?
_______________________________________________________________________
- Bitcoin fees plummet as its mempool clears to zero (Cointelegraph)
- Sam Bankman-Fried states that even ETH 2 can’t handle DeFi’s potential growth (Cointelegraph)
- Indian exchange offers Ether staking ahead of Ethereum 2.0 launch (Cointelegraph)
- MicroStrategy CEO Explains Why Bitcoin Is ‘a Million Times Better’ Than ‘Antiquated’ Gold (Coindesk)
- ShapeShift Delists Privacy Coin Zcash Over Regulatory Concerns (Coindesk)
- Ethereum 2.0 Deposit Contract Tops $22.5 Million One Week After Launch (Coindesk)
- Failed Sybil Attack Targeted Monero Users, Privacy Is Safe (Cryptobriefing)
- 3 reasons Bitcoin spot volume reaching new yearly peak is highly optimistic (Cryptoslate)
- Former Microsoft employee sentenced in what IRS calls ‘first Bitcoin case’ involving false tax return (The Block)
- Lebanon launching its own digital currency in 2021: report (The Block)
Bitcoin’s transaction fees have plummeted as its mempool got cleared, reaching its smallest size since the middle of Oct. This means that hundreds, if not thousands of unconfirmed transactions, got included in the recent blocks, leaving the blockchain clear and unclogged. The mempool clearing has been attributed to a 42% increase in hash rate, which happened just a couple of days ago as Chinese miners completed their migration from the Sechuan region.
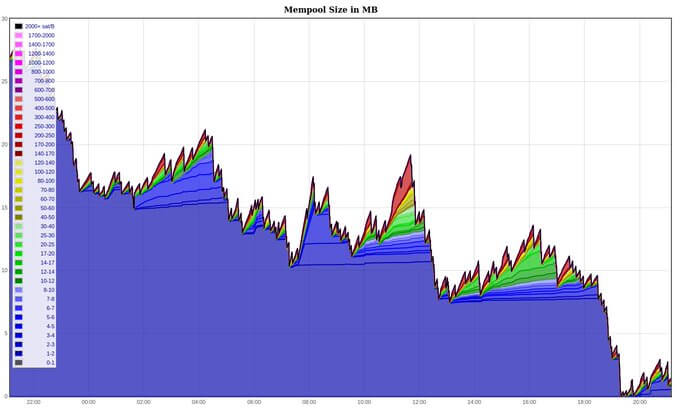
At the moment, the median transaction fee is 3 sat/byte, or roughly $0.11.
_______________________________________________________________________
Technical analysis
_______________________________________________________________________
Bitcoin
The largest cryptocurrency by market capitalization has spent the day trading in a narrow range between $15,100 and $15,500, trying to pass the $15,480 level with confidence. However, as this did not happen, we are seeing a possible lower high forming. The flat RSI and volume dropping signal a “calm before the storm,” which means that traders should prepare for a sharp move soon.
Traders should wait for Bitcoin to choose its short-term direction and trade only if Bitcoin confidently goes above $15,480 or below $15,420 with significant volume.
BTC/USD 4-hour Chart
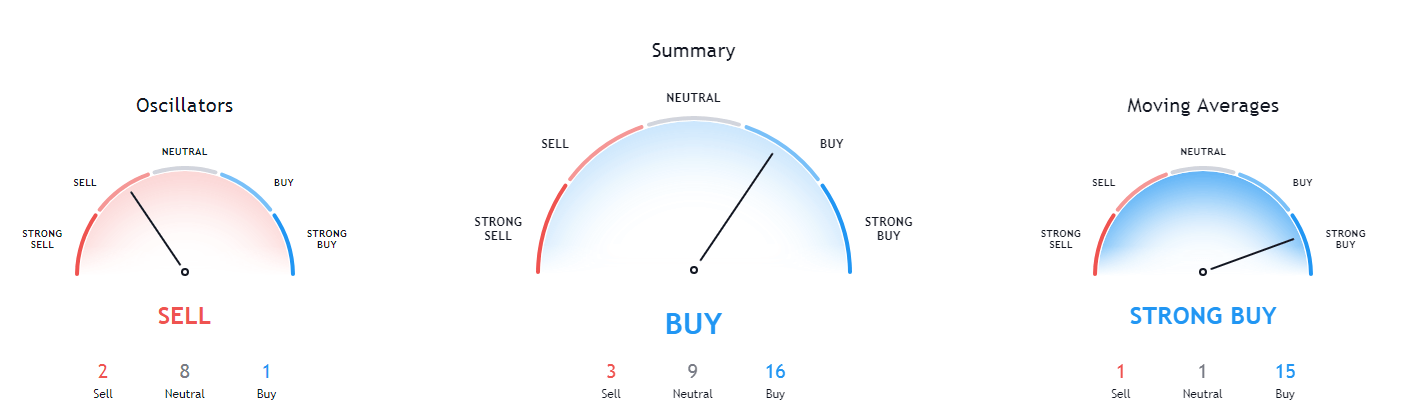
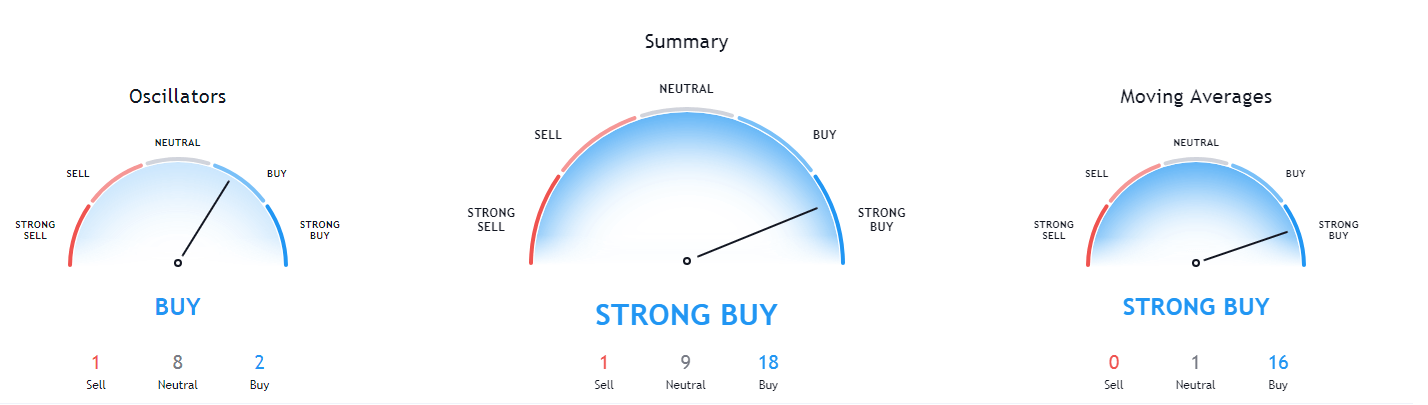
Bitcoin’s technicals are bullish on all time-frames. However, its shorter time-frames are showing signs of neutrality, or even slight bearish presence, while its monthly overview is completely bullish.
BTC/USD 1-day Technicals
Technical factors (4-hour Chart):
- Price is above its 50-period EMA and right at its 21-period EMA
- Price is at its middle Bollinger band
- RSI is neutral (54.44)
- Volume is average
Key levels to the upside Key levels to the downside
1: $15,480 1: $15,420
2: $16,400 2: $14,640
3: $16,700 3: $14,100
Ethereum
Ethereum has, unlike Bitcoin, had a great day as its price propelled past the top line of the ascended channel. The price increase is mainly attributed to great news regarding its 2.0 update adoption, as its deposit contracts top 22.5 million only one week after launch.
However, while the price increase is certainly a great thing, Ethereum is currently entering a strong resistance zone (above $460), which may cause problems for the ETH bulls.
Traders should pay close attention to how (and if) Ethereum pulls back or continues upwards. If Bitcoin doesn’t make any moves, it’s safe to assume that Ethereum will pullback in the short future.
ETH/USD 4-hour Chart
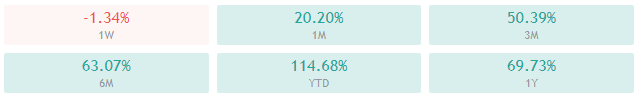
Ethereum’s technicals show “extreme buy” daily, weekly, and monthly time-frames, while its 4-hour overview is slightly more neutral.
ETH/USD 1-day Technicals
Technical Factors (4-hour Chart):
- The price is above both its 50-period and its 21-period EMA
- Price is at its top Bollinger band
- RSI is neutral (60.73)
- Volume is average
Key levels to the upside Key levels to the downside
1: $470 1: $451
2: $490 2: $445
3: $500 3: $420
Ripple
The fourth-largest cryptocurrency by market cap has continued trading within a range, bound by $0.2454 to the downside and $0.26 to the upside. XRP has spent the day slowly increasing its price, but the one attempt it had of pushing past $0.26 got shut down quickly.
Traders are safe to assume that XRP will trade within the same range and that they can trade the sideways action. On the other hand, if the volume increases drastically, a move towards the upside is much more likely than one towards the downside (unless fueled by Bitcoin’s move).
XRP/USD 4-hour Chart
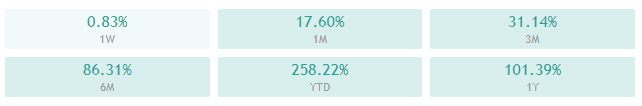
XRP’s technicals on the 4-hour and weekly time-frame are slightly bullish with slight hints of neutrality, while its daily overview is bullish. On the other hand, its monthly overview is tilted towards the sell-side.
XRP/USD 1-day Technicals
Technical factors (4-hour Chart):
- The price above its 50-period EMA and slightly above its 21-period EMA
- Price is slightly above its middle Bollinger band
- RSI is neutral (52.36)
- Volume is average
Key levels to the upside Key levels to the downside
1: $0.26 1: $0.2454
2: $0.266 2: $0.235
3: $0.27 3: $0.227
Related posts
 Daily Crypto Review, Sept 9 – Will DeFi Bubble Burst, Send Ethereum to Freefall?
 Daily Crypto Review, Sept 14 – The EU Regulating Stablecoins; Crypto Market Preparing For a Move
 Daily Crypto Review, Sept 25 – ETH Options Traders Like Trading Below $360; Crypto Market In the Green
 Daily Crypto Review, Oct 13 – G7 Will Continue to Oppose Libra; Bitcoin Consolidating After Another Bull Run