
The cryptocurrency market had another pullback today, with Bitcoin coming dangerously close to $10,000. Bitcoin is currently trading for $10,087, which represents a decrease of 2.29% on the day. Meanwhile, Ethereum lost 3.26% on the day, while XRP lost 2.52%.

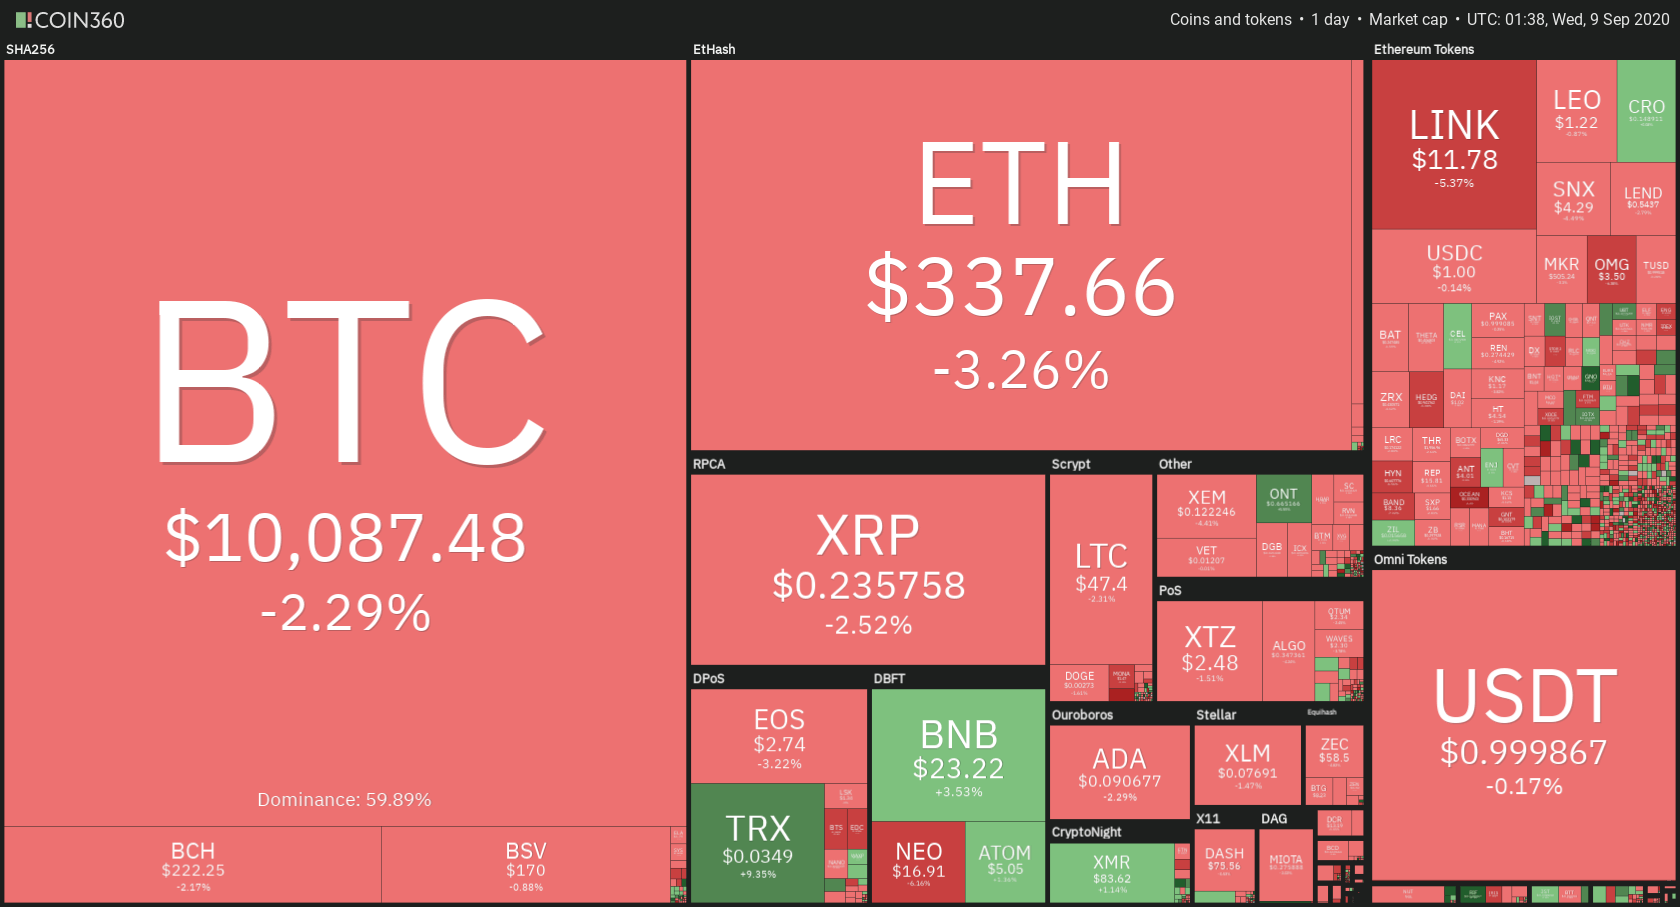
Daily Crypto Sector Heat Map
If we take a look at the top100 cryptocurrencies, IOST gained 11.86% on the day, making it the most prominent daily gainer. TRON (11.78%) and Ontology (7.92%) also did great. On the other hand, the SushiSwap lost 15.01%, making it the most prominent daily loser. It is followed by Hyperion’s loss of 14.32% and Ocean Protocol’s loss of 11.46%.
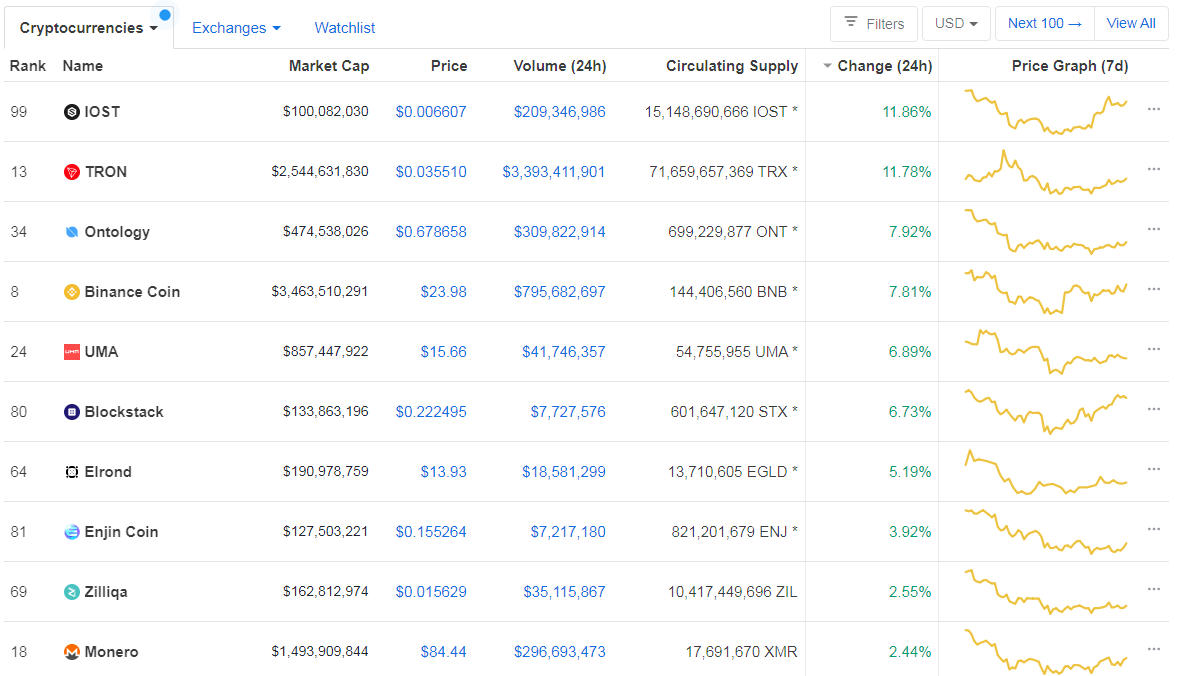
Top 10 24-hour Performers (Click to enlarge)
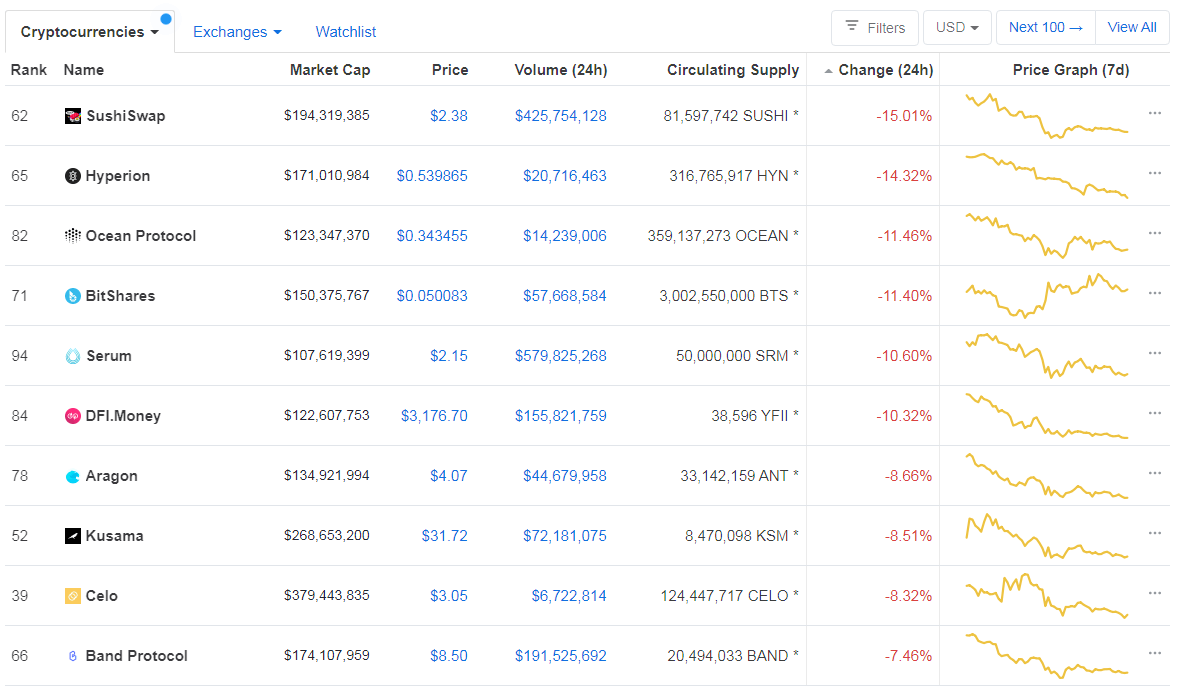
Bottom 10 24-hour Performers (Click to enlarge)
Bitcoin’s dominance level stayed at the same spot since our last report, with its value is currently at 59.89%. This value represents a 0.05% difference to the upside when compared to when we last reported.
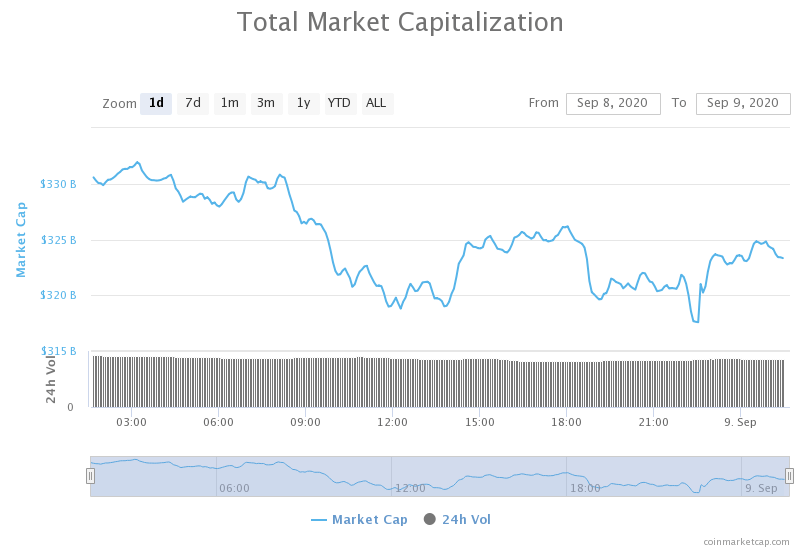
Daily Crypto Market Cap Chart
The crypto sector capitalization has gone down slightly in the past 24 hours. Its current value is $326.90 billion, which represents a decrease of $6.34 billion when compared to our previous report.
_______________________________________________________________________
What happened in the past 24 hours?
_______________________________________________________________________
- Major food delivery service Just Eat will now allow France customers to pay in BTC (The Block)
- Volatility in Stocks May Be Strengthening Their Correlation With Bitcoin (Cryptobriefing)
- Ethereum Ready for Freefall? 30% Correction After $490 Peak (Cryptobriefing)
- Top Bitcoin analyst flips bullish after predicting the 20% retracement last week (Cryptoslate)
- User who turned $200 in Ethereum into $250k due to altcoin bug comes clean (Cryptoslate)
- DeFi Is Hot but Retail Interest Nowhere Close to ICO Frenzy (Coindesk)
- Why Bitcoin Investors Aren’t Worried About This Price Pullback (Coindesk)
- LedgerX exchange launches physically settled Bitcoin mini futures (Cointelegraph)
- Brave browser adds new tricks to protect crypto users from phishing attacks (Cointelegraph)
- Bitcoin options data shows traders anticipate BTC price to fall soon (Cointelegraph)
_______________________________________________________________________
Technical analysis
_______________________________________________________________________
Bitcoin
Bitcoin has been clinging to the $10,000 psychological resistance for the past 24 hours as bears took over the market yet again. The largest cryptocurrency by market cap fell well below $10,000, but quickly recovered and stayed just a bit up for the duration of the day. The reason for the sudden drop is most likely the inability to break the $10,360 resistance level. Lower time-frames show that Bitcoin might have formed a triple bottom formation, which would indicate some form of bullishness.
When it comes to predictions, we are one step closer to the bearish scenario than yesterday. A drop sustained drop below $10,000 could lead us to $9,600 and ultimately to the 200-day SMA ($9,080). On the other hand, if BTC manages to bounce off the current levels and surpass $10,500, a move to $11,000 is likely.
BTC/USD 4-hour Chart
Technical factors:
- Price is well below its 50-period, while it’s slightly below its 21-period EMA
- Price is slightly below middle Bollinger band
- RSI is neutral (43.31)
- Volume is stable
Key levels to the upside Key levels to the downside
1: $10,360 1: $10,015
2: $10,500 2: $9,870
3: $10,850 3: $9,600
Ethereum
Ethereum had quite a bad day, with its price falling below the $340 mark. The second-largest cryptocurrency by market cap is already down over 30% from the $490 peak, with many indicators showing bearish scenarios. If the DeFi bubble pops, we can see Ethereum in freefall, though that is unlikely simply due to high yields current investors are collecting from staking.
On the other hand, while some DeFi enthusiasts cashed out and left the market due to the volatility, Ethereum’s gas prices have normalized from its Sept 2nd highs, which may be just enough to push the price slightly up or at least keep it stable.
Traders should pay attention to how Ether handles the $340 level.
ETH/USD 4-hour Chart
Technical Factors:
- The price is slightly below its 21-period and well below its 50-period EMA
- The price is right below its middle Bollinger band
- RSI is neutral (41.08)
- Volume is descending (low)
Key levels to the upside Key levels to the downside
1: $340 1: $300
2: $360 2: $289
3: $371
Ripple
XRP has lost a couple of percent of its value, though nothing to be scared of. The third-largest cryptocurrency by market cap tested its support level of $0.235 for a couple of times in the past 24 hours, and all attempts towards the downside failed. Many analysts are calling for XRP’s future rise, but we need to see a drastic change in volume for that to happen.
XRP traders should watch out for volume spikes, as even sideways trading is hard now due to the extremely low volume.
XRP/USD 4-hour Chart
Technical factors:
- The price is just under its 21-period, while it is well below its 50-period EMA
- Price is at its middle Bollinger band
- RSI is neutral (45.18)
- Volume is low
Key levels to the upside Key levels to the downside
1: $0.2454 1: $0.235
2: $0.266 2: $0.227
3: $0.285 3: $0.221
Related posts
 Daily Crypto Review, Jun 16 – BTC Whale Count Back To Dec 2017 Levels; BTC Back Above $9,000
 Daily Crypto Review, Jun 18 – Binance Pool the Biggest Miner of Craig Wright’s Bitcoin SV – What’s Actually Happening?
 Daily Crypto Review, Oct 22 – PayPal to Enable its Users to Buy and Sell Crypto; Bitcoin Skyrockets to $13,000 as a Response
 Daily Crypto Review, Oct 27 – Bitcoin Preparing For a Retracement; XRP Tumbles on the Daily
One reply on “Daily Crypto Review, Sept 9 – Will DeFi Bubble Burst, Send Ethereum to Freefall?”
Hopefully ETH will stay stable